SafeGraph’s 14-slide deck is a focused argument for the value of high-veracity geospatial data. Founded in 2016 by Auren Hoffman, the company raised a total of $61,000,000 by positioning itself as the 'Source of Truth for Physical Places.' The deck is notable for its explicit rejection of the traditional SaaS model—stating 'No software, analytics, visualization' on slide 4—and instead emphasizing the 'Data-As-A-Service' (DaaS) paradigm. Key to their strategy is the Placekey initiative, a free universal identifier for physical locations intended to solve data conflation issues. With a team of…
Key takeaways
- The company explicitly positions itself against traditional SaaS by stating their only product is data, with no software or visualization tools (Slide 4).
- SafeGraph reports high-precision data covering 6.8 million points of interest across 5,800 major brands in the US and Canada (Slide 5).
- Unit economics are a highlight, featuring an LTV to CAC ratio greater than 4x and an efficiency score greater than 1.5 (Slide 7).
- The 'Placekey' initiative acts as a strategic moat, providing a free and open standard ID for physical places to over 1,000 organizations (Slide 8, 9).
- The deck leverages significant social proof from the COVID-19 pandemic, citing usage by the CDC, Federal Reserve, and White House (Slide 10).
- Future growth is predicated on international expansion, a feedback co-op, self-serve APIs, and M&A activity (Slide 11).
- The leadership team is highly experienced, led by Auren Hoffman (formerly of LiveRamp) and veterans from Uber and Microsoft (Slide 12).
- The deck completely omits a specific 'Ask' slide, financial projections, or a detailed breakdown of the $61,000,000 raised (General observation).
The Pure-Play Data Strategy
SafeGraph’s pitch deck is a refreshing anomaly in a venture landscape dominated by 'Software as a Service' (SaaS). Founded in 2016, the company has successfully raised $61,000,000 by leaning into a 'Data as a Service' (DaaS) model. The deck is structured to first validate the DaaS category, then demonstrate SafeGraph’s technical dominance in geospatial data, and finally prove their operational efficiency. It is a lean, 14-slide presentation that prioritizes clarity and authority over flashy design.
Slides 1-2: The Macro Argument for DaaS
Slide 1 introduces the company with the tagline: "The Source of Truth for Physical Places." This immediately establishes a high-authority position. Rather than being a 'tool' or a 'platform,' they are the 'source of truth.'
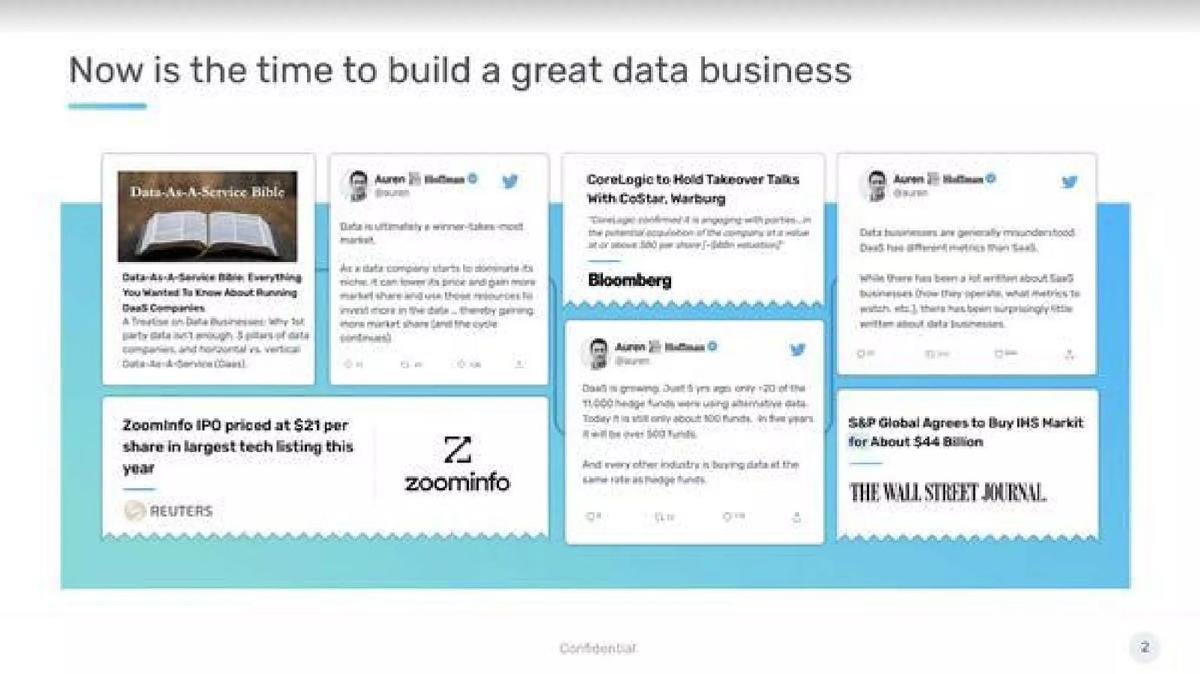
Slide 2, titled "Now is the time to build a great data business," is a collage of market validation. It features tweets from founder Auren Hoffman, news of the ZoomInfo IPO, and massive acquisitions like S&P Global buying IHS Markit for $44 billion. This slide serves two purposes: it establishes Auren Hoffman as a thought leader in the DaaS space and proves that the exit environment for data companies is robust. It addresses the 'Why Now?' question by showing that data businesses are finally being valued correctly by the public markets.
Slides 3-5: Defining the Product and the 'Truth'
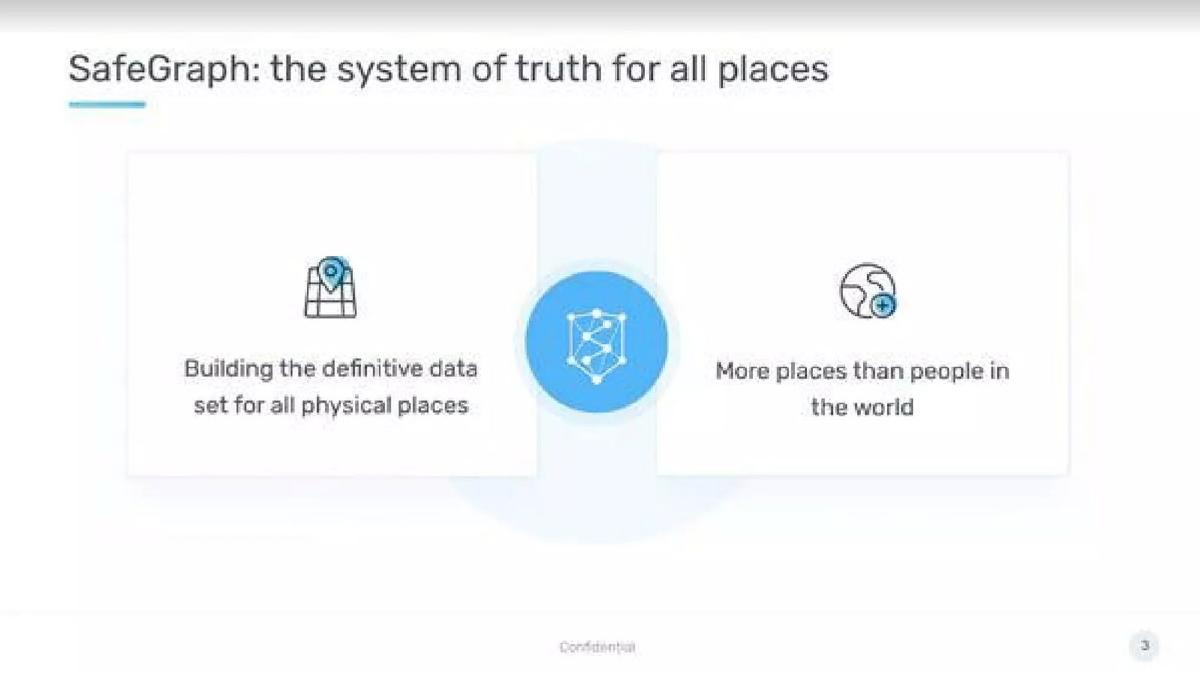
Slide 3 defines SafeGraph as the "system of truth for all places," claiming they have "more places than people in the world." This is a bold scale claim that sets the stage for their technical capabilities.
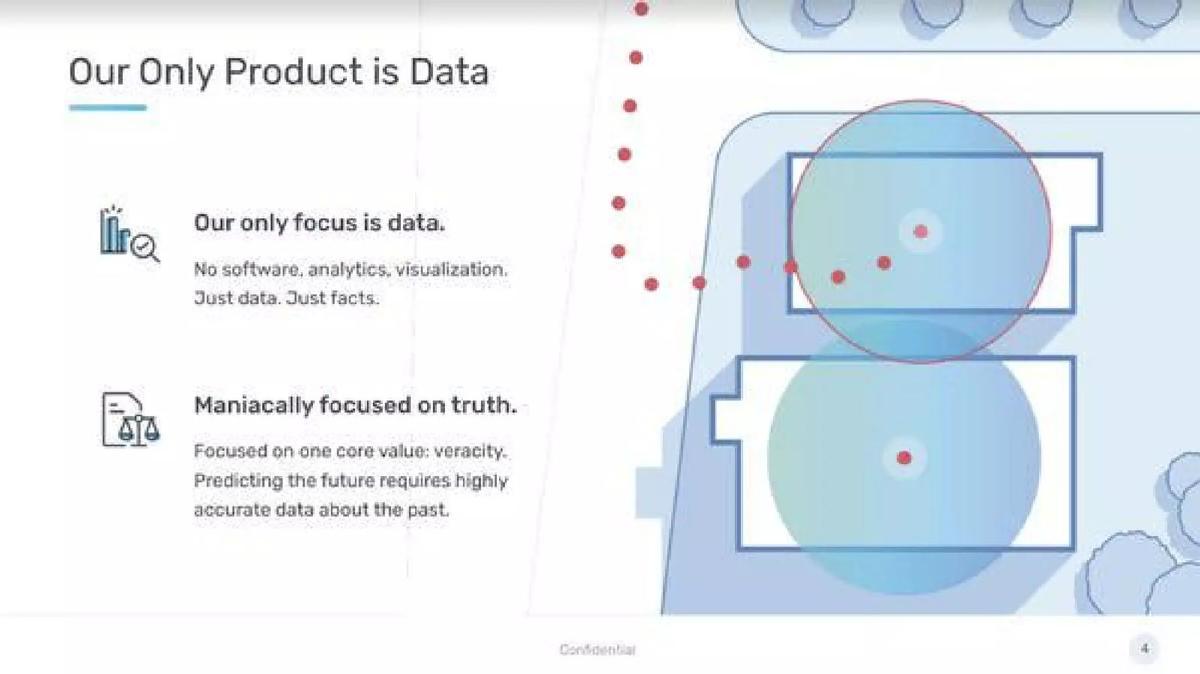
Slide 4 is perhaps the most important slide for a founder to study. Titled "Our Only Product is Data," it contains a rare admission: "No software, analytics, visualization. Just data. Just facts." This is a strategic 'anti-pitch.' By telling investors what they don't do, they make their core focus—veracity—more believable. They argue that predicting the future requires highly accurate data about the past, positioning themselves as the essential ingredient for any AI or ML application.
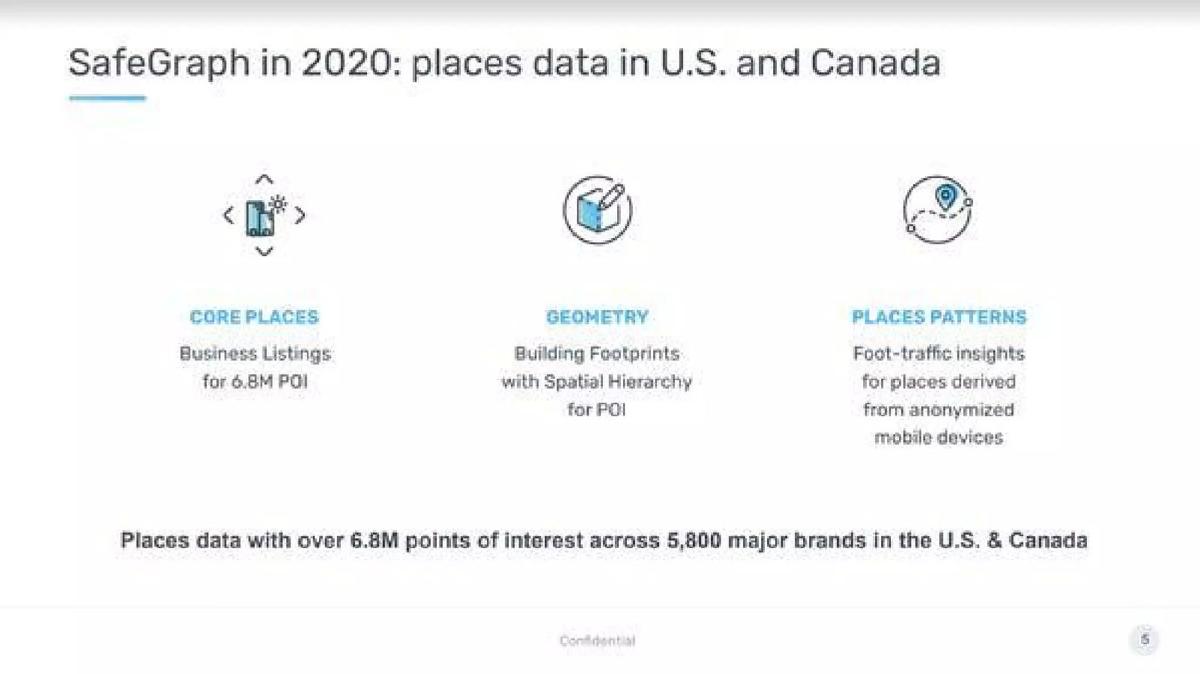
Slide 5 gets specific about their 2020 footprint. They cite 6.8 million points of interest (POI) across 5,800 major brands in the U.S. and Canada. They break their data into three pillars: Core Places (listings), Geometry (building footprints), and Places Patterns (foot traffic). This clarity helps investors understand exactly what the 'raw material' is that SafeGraph sells.
Slides 6-7: Traction and Unit Economics
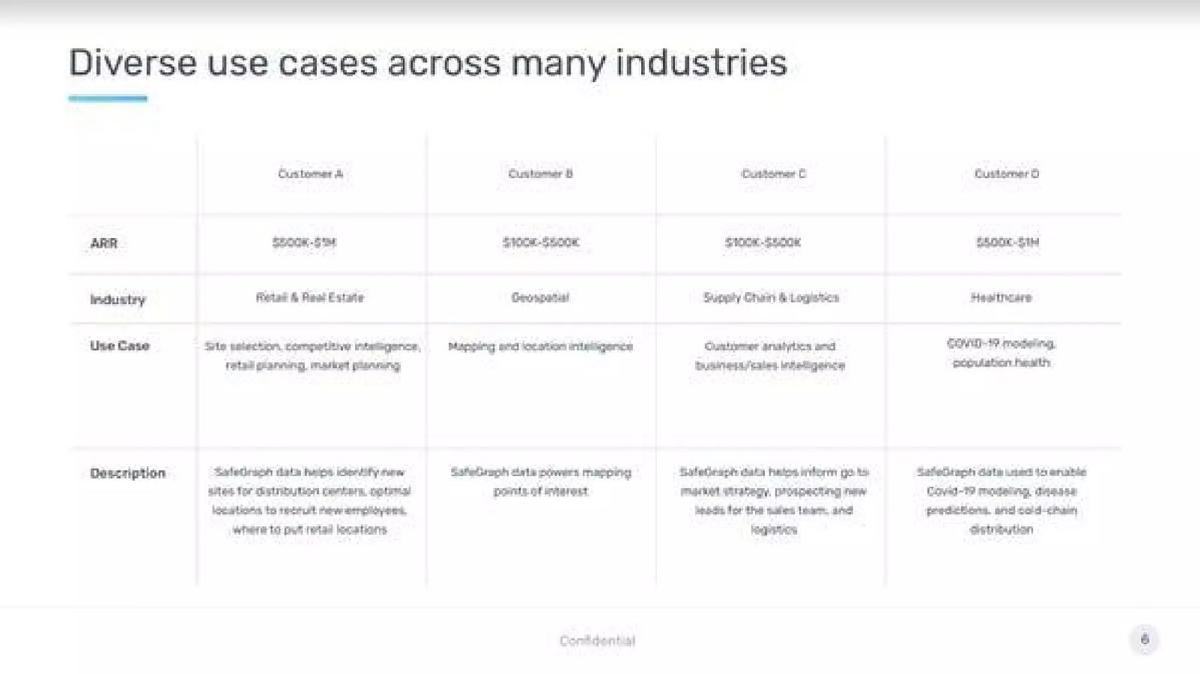
Slide 6 uses an anonymized table to show "Diverse use cases across many industries." It lists four customer profiles (A through D) with ARR ranges from $100K to $1M. This proves that their data is not a niche product; it is equally valuable to a healthcare researcher modeling COVID-19 as it is to a retail executive doing site selection. The inclusion of ARR figures provides a concrete sense of their contract sizes.
Slide 7 focuses on efficiency. For a company that has raised $61M, investors want to see that the capital is being used effectively. SafeGraph reports an LTV to CAC of >4x, a SaaS Magic Number of ~1.0, and an Efficiency Score of >1.5. These are 'best-in-class' metrics for a growth-stage company, signaling that their sales engine is well-tuned and their churn is likely low.
Slides 8-10: The Placekey Moat and Social Proof
Slides 8 and 9 introduce 'Placekey,' a free and open standard ID for physical places. Slide 8 explains the technical problem: data conflation. Addresses are messy (e.g., '123 N. Main St' vs '123 North Main Street'). Placekey provides a universal join key. Slide 9 shows a 'logo cloud' of over 1,000 organizations that have joined the Placekey ecosystem, including Esri, Carto, and the City of Boston. This is a brilliant strategic move; by giving away the 'key,' they ensure that everyone in the industry uses their map, making their paid data the default choice.
Slide 10 provides massive social proof. It highlights how the 7,000-member Placekey community used SafeGraph data to respond to the COVID-19 pandemic. It features logos from Fortune, Axios, and CNN, and mentions that the White House, CDC, and Federal Reserve used their data. This elevates the company from a mere commercial vendor to a critical piece of national infrastructure.
Slides 11-14: Future Initiatives and Team
Slide 11 outlines the roadmap for the next three years: international expansion, a feedback co-op, self-serve APIs, and M&A. This shows they are thinking about horizontal and vertical growth simultaneously.
Slide 12 is the team slide, titled "been there, done that." It features Auren Hoffman (CEO, formerly of LiveRamp) and leaders from Uber, Microsoft, and LinkedIn. For a data business, the pedigree of the engineering and product leadership is paramount, and this slide delivers that confidence.
The deck concludes with a simple 'Thank you' (Slide 13) and a contact slide (Slide 14). Notably, there is no 'Ask' slide in this version of the deck, which is common for companies in the middle of a large, multi-stage raise or those using the deck for general partnership discussions.
What Works in This Deck
Strategic Focus: The explicit rejection of software and analytics (Slide 4) is a powerful differentiator. It tells investors that the company knows exactly what it is—and what it isn't. This prevents the 'we do everything' trap that many startups fall into.
The Ecosystem Play: The Placekey initiative (Slides 8-9) is a masterclass in building a moat. By creating a free industry standard, SafeGraph positions itself at the center of the geospatial universe. It’s not just selling data; it’s defining how data is organized.
High-Stakes Social Proof: Using the COVID-19 response (Slide 10) to demonstrate data utility is incredibly effective. When the CDC and the White House rely on your data for national policy, it’s hard for a VC to argue that the data isn't 'enterprise grade.'
What is Missing
The Financial Ask: The deck does not state how much they are currently raising or the terms of the round. While the catalogue indicates a total of $61M raised, the deck itself is silent on the specific funding requirements or the intended use of proceeds for a specific round.
Competitive Landscape: There is no slide addressing competitors like Foursquare or Google Places. While SafeGraph argues they are the 'source of truth,' investors would likely want to see how their precision or pricing compares to the incumbents.
Detailed Financial Projections: While the deck shows current efficiency metrics (Slide 7), it lacks a forward-looking revenue graph. It shows where they are, but not the specific trajectory of their ARR over the next 3-5 years.
What a Founder Should Copy
The 'Anti-Pitch': If your business has a very specific focus, don't be afraid to say what you don't do. It builds credibility. SafeGraph’s 'No software' stance is their strongest selling point because it promises a lack of distraction.
Metric Transparency: Slide 7 is a great template for showing business health. Instead of just showing a 'up and to the right' revenue chart, show the ratios (LTV/CAC, Magic Number) that prove your growth is sustainable.
Standardization as a Strategy: If you are in a fragmented industry, consider creating a free 'standard' or 'identifier' like Placekey. It is the ultimate top-of-funnel lead generator and creates a network effect that is very difficult for competitors to displace.
Conclusion SafeGraph’s deck is a disciplined, professional presentation that relies on the strength of its data and the pedigree of its team. It avoids the fluff of modern design in favor of hard metrics and strategic moats. For any founder building a DaaS or infrastructure-level business, this deck provides a blueprint for how to sell 'truth' as a product.
Frequently asked questions
- What is SafeGraph's core value proposition?
- SafeGraph positions itself as the 'system of truth for all places.' Unlike many geospatial companies that provide analytics software, SafeGraph focuses exclusively on the underlying data. Their value lies in the veracity and precision of three specific datasets: Core Places (business listings), Geometry (building footprints), and Patterns (anonymized foot traffic). By providing the raw 'truth' rather than the tools to interpret it, they serve as a foundational layer for other companies' AI and machine learning models.
- How does SafeGraph differentiate itself from traditional SaaS companies?
- On slide 4, the company explicitly states, 'No software, analytics, visualization. Just data. Just facts.' This is a strategic departure from the SaaS model. They argue that data businesses are often misunderstood and have different metrics than SaaS. By focusing solely on data veracity, they avoid the 'feature creep' and high maintenance costs of software, instead building a 'winner-takes-most' market position based on data quality and the network effects of their Placekey identifier.
- What is the significance of the Placekey initiative mentioned in the deck?
- Placekey is a universal identifier for physical places designed to solve the problem of 'data conflation'—where different datasets use slightly different addresses for the same location. By offering this as a free and open standard, SafeGraph encourages other organizations to adopt their naming conventions. Slide 9 shows that over 1,000 organizations have joined, which creates a powerful ecosystem where SafeGraph's paid data products become the easiest to integrate.
- Who are SafeGraph's primary customers according to the deck?
- Slide 6 outlines diverse use cases across multiple industries without naming specific companies. Customer A (Retail & Real Estate) uses the data for site selection and competitive intelligence. Customer B (Geospatial) uses it for mapping. Customer C (Supply Chain) uses it for sales intelligence. Customer D (Healthcare) used it for COVID-19 modeling and population health. These customers represent ARR tiers ranging from $100k to over $1M.
- What metrics does SafeGraph use to prove business efficiency?
- SafeGraph uses three primary metrics on slide 7 to demonstrate efficiency: an LTV to CAC ratio of >4x, a SaaS Magic Number of approximately 1.0, and an Efficiency Score of >1.5. These figures suggest that for every dollar spent on customer acquisition, the company generates significant long-term value, and their sales and marketing spend is highly effective at driving new recurring revenue.