GRID raised $16.5 million in 2018 for its Series A by targeting the massive, underserved market of spreadsheet users. The 11-slide deck is a study in narrative simplicity, focusing on the friction of sharing data rather than just the technical features of a new spreadsheet tool. By identifying that 88% of spreadsheet users share their work with others—often through inefficient means like email attachments—GRID positioned itself as the essential 'visual and interactive' layer on top of existing data. The deck relies heavily on the founder's pedigree, with Hjalmar Gislason bringing a track reco…
Key takeaways
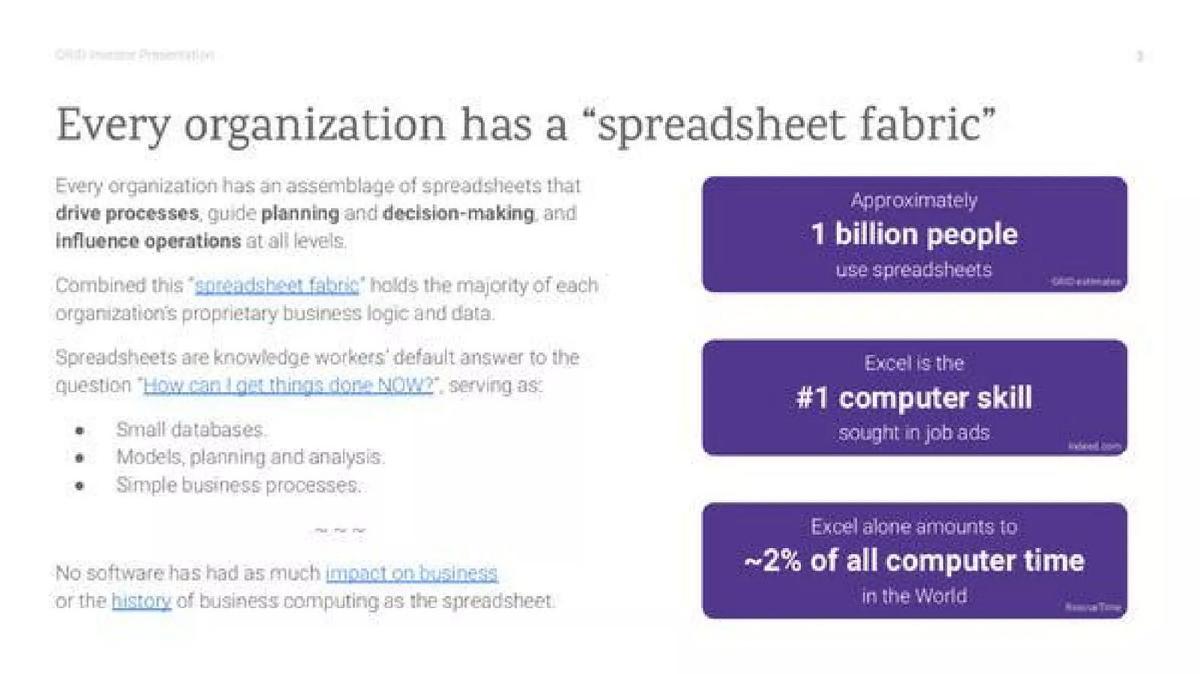
- The deck identifies a massive TAM of approximately 1 billion spreadsheet users worldwide on slide 3.
- Excel is cited as the #1 computer skill sought in job ads, highlighting the ubiquity of the underlying technology GRID builds upon (Slide 3).
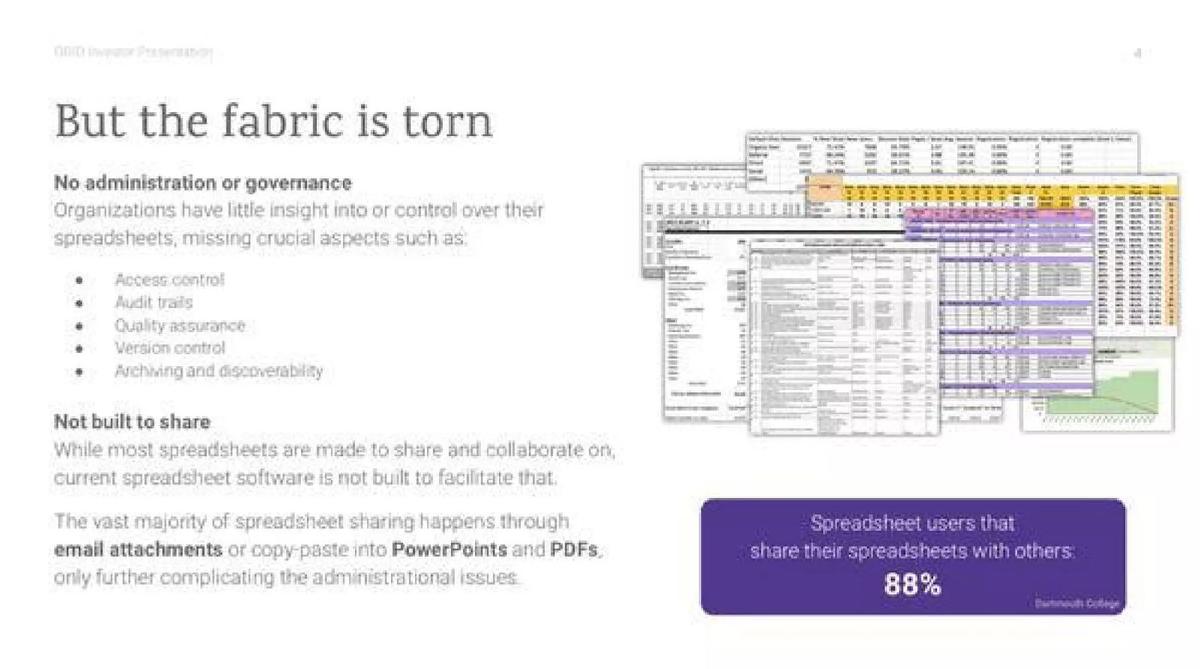
- A critical pain point is identified: 88% of spreadsheet users share their work, but current software is 'not built to share' (Slide 4).
- GRID positions itself as a WYSIWYG editor that creates interactive web documents on top of existing spreadsheets (Slide 7).
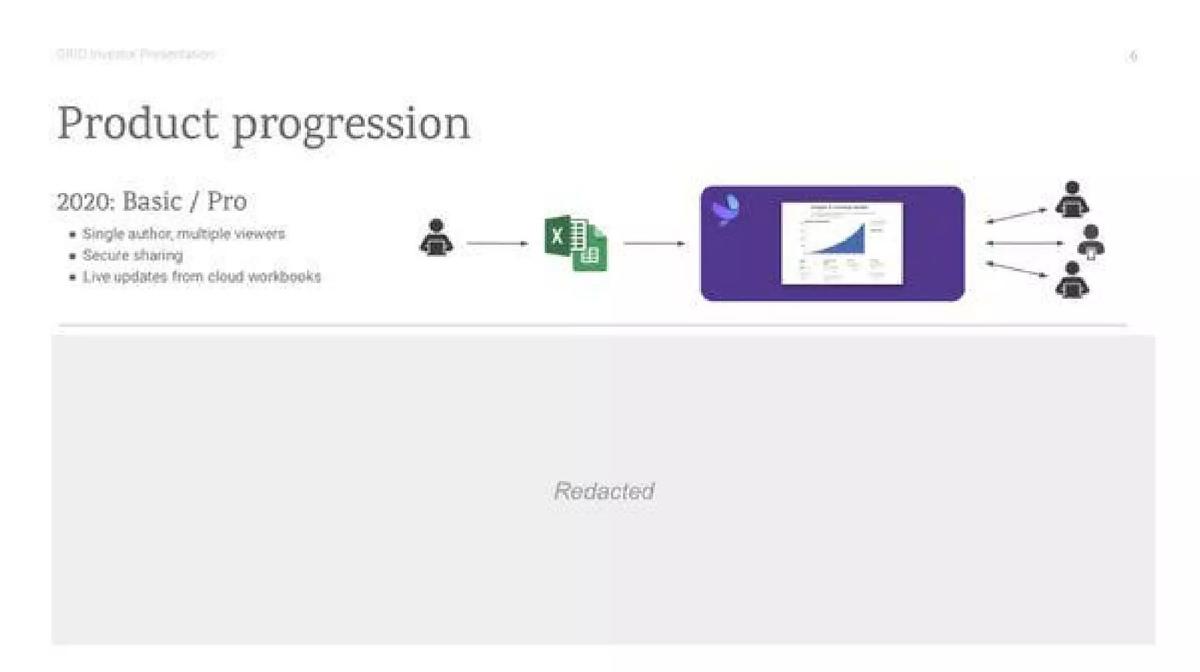
- The product strategy focuses on a 'single author, multiple viewers' model for its 2020 Basic/Pro launch (Slide 6).
- The founder, Hjalmar Gislason, is highlighted as a 5th-time founder with a previous exit to Qlik (Slide 11).
- The deck defines its 'real competition' not as other software, but as the habit of using email attachments and copy-pasting into PPT/PDF (Slide 10).
- The team is described as having 10-20 years of experience in building end-user software (Slide 11).
The Narrative of the Spreadsheet Fabric
GRID's Series A deck is a masterclass in identifying a 'hidden in plain sight' market opportunity. Instead of trying to build a 'better Excel'—a graveyard for many startups—GRID identifies that the spreadsheet is already the 'fabric' of every organization. The deck, dated May 2020, uses 11 slides to argue that while the fabric is ubiquitous, it is also 'torn.' The following teardown examines how they used this narrative to raise $16.5 million.
Slides 1-2: Mission and Identity
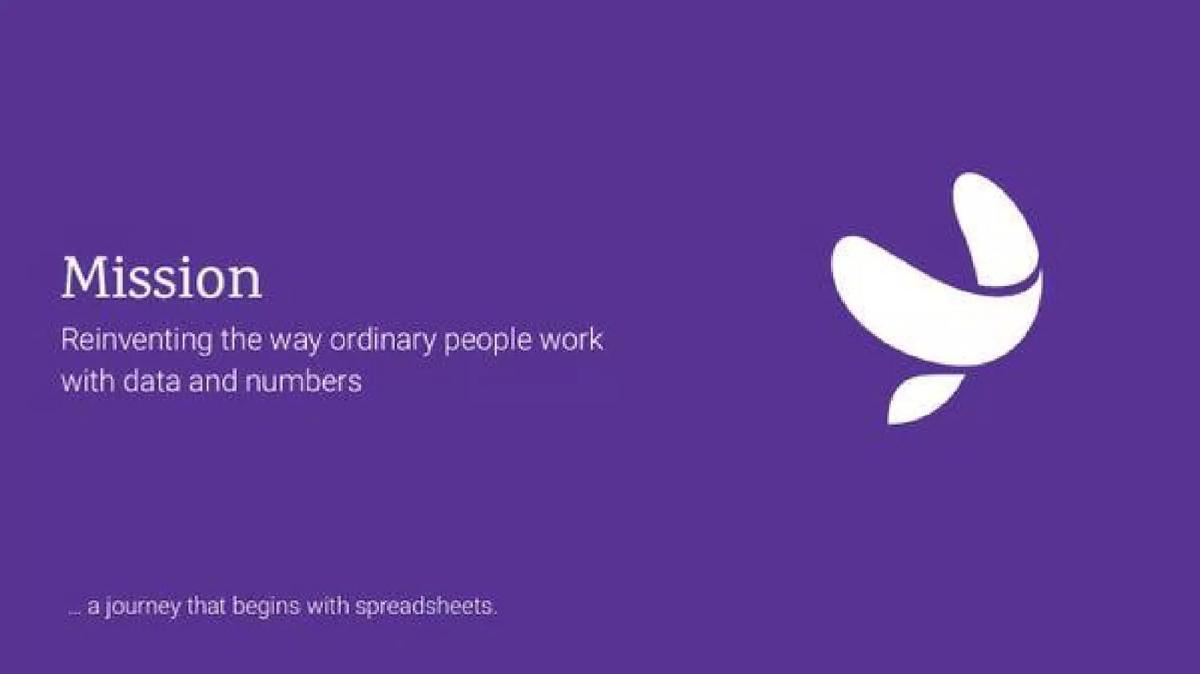
The deck opens with a clean, minimalist title slide. Slide 2 immediately establishes the mission: "Reinventing the way ordinary people work with data and numbers." Crucially, it adds a sub-caption: "...a journey that begins with spreadsheets." This is a strategic choice. It signals to investors that they aren't fighting user behavior; they are augmenting it. The branding is soft and 'friendly,' aligning with their self-description as a 'friendly numbers tool.'
Slides 3-4: The Problem of the 'Torn Fabric'
Slide 3 establishes the scale of the opportunity. It cites three massive figures: 1 billion people use spreadsheets, Excel is the #1 computer skill sought in job ads, and Excel accounts for ~2% of all computer time in the world. By framing spreadsheets as a 'fabric' that holds proprietary business logic, they elevate the importance of the problem.
Slide 4 introduces the conflict: "But the fabric is torn." It lists the lack of administration, governance, access control, and audit trails. The most compelling stat here is that 88% of spreadsheet users share their work , yet the software isn't built for it. This sets the stage for GRID as the solution to the 'email attachment' and 'copy-paste' culture that currently dominates data sharing.
Slides 5-7: The Solution and Product Progression
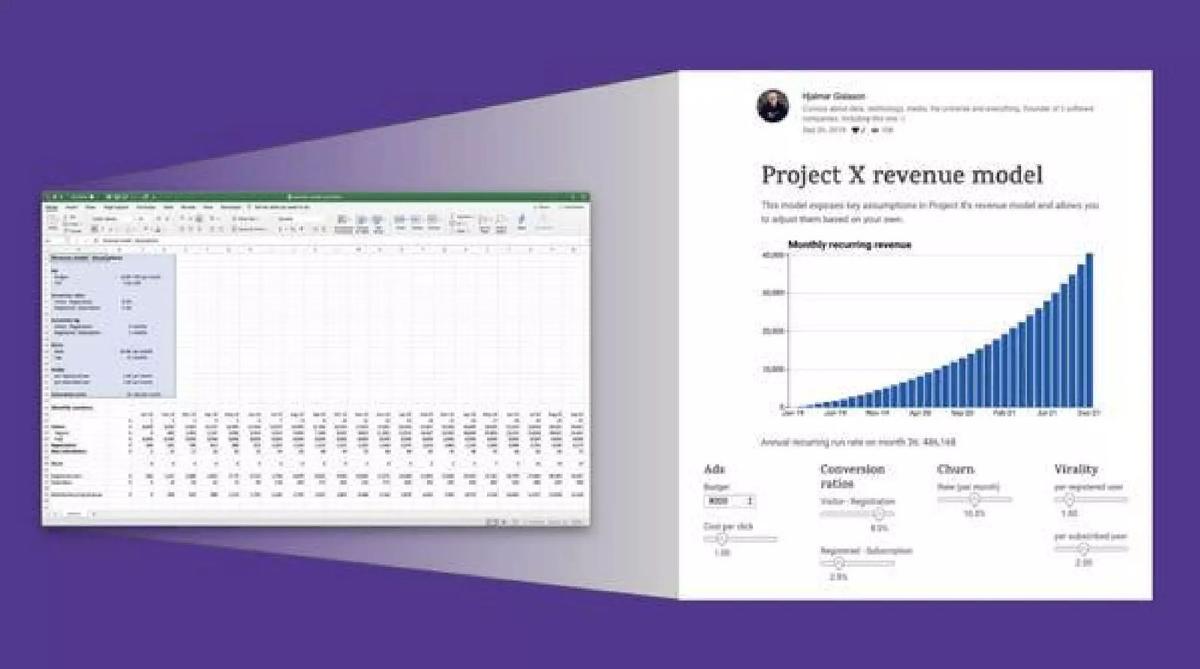
Slide 5 is a visual 'aha' moment. It shows a cluttered, traditional Excel spreadsheet on the left being transformed into a clean, interactive web dashboard on the right. This 'Project X revenue model' example demonstrates how sliders and charts can replace raw cells for the end-viewer.
Slide 6, titled "Product Progression," outlines the 2020 roadmap for Basic and Pro tiers. It emphasizes a "Single author, multiple viewers" model with secure sharing and live updates from cloud workbooks. A large portion of this slide is redacted in the public version, likely containing future roadmap milestones or specific feature sets.
Slide 7 focuses on the "Technology." It claims GRID has solved '3 hard technical problems,' though one is redacted. The two visible points are the WYSIWYG editor for interactive web documents and the direct connection with cloud-based workbooks . This slide is meant to prove the 'moat'—that the synchronization between a live spreadsheet and a web view is a non-trivial engineering feat.
Slides 8-10: Market Strategy and Competition
Slide 8, "Initial product offering," reiterates the value proposition: saving time and improving collaboration. It lists the tradeoffs creators face—interactivity vs. control vs. mobile friendliness—and claims GRID delivers on all of them. Again, a significant visual element is redacted here.
Slide 9 covers "Go-to-Market." It describes a freemium SaaS model sold via self-service. The redactions here likely hide specific pricing tiers or customer acquisition cost (CAC) targets. The strategy is clear: low-friction, digital-first adoption.
Slide 10 addresses "Competition." It makes a bold claim: "When it comes to reporting and sharing visual narratives from spreadsheets... GRID owns the stage." It dismisses other software tools to focus on the 'real competition': traditional habits like email and static PDFs. This is a classic 'status quo' competitive analysis, which is often more effective for early-stage companies than a feature-by-feature matrix against incumbents.
Slide 11: The Team
The final slide is perhaps the strongest for a Series A. It features Hjalmar Gislason , a founder with four previous companies under his belt, including one sold to Qlik. The team is described as having 10-20 years of experience . By showing a group photo alongside individual bios, they balance the 'visionary founder' narrative with the reality of a seasoned engineering and growth team (mentioning a 'team of 9' and 'team of 3' for specific departments).
What Works in This Deck
1. The 'Fabric' Metaphor: By calling spreadsheets the 'fabric' of business, GRID avoids the 'Excel killer' trap. Investors are wary of companies trying to change deep-seated habits. GRID's narrative that the fabric is simply 'torn' and needs a patch (GRID) is much easier to fund.
2. Massive TAM Validation: Using the '2% of all computer time' stat is a brilliant way to quantify the market without relying on questionable 'Total Addressable Market' dollar figures. It makes the scale of the problem feel visceral.
3. Founder-Market Fit: Hjalmar Gislason's background at Qlik (a major player in data visualization) makes him the perfect person to pitch a tool that sits between raw data and visual narrative. The deck leans heavily on this credibility.
What is Missing
1. Unit Economics: While the deck mentions a 'freemium model' and 'digital acquisition,' there is no mention of LTV (Lifetime Value), CAC (Customer Acquisition Cost), or churn rates. Even in a Series A, some early signal on these metrics is usually expected, though they may have been in the redacted sections.
2. Financial Projections: There is no slide detailing the 'Ask' or how the $16.5M will be spent. Usually, a Series A deck includes a 18-24 month roadmap of how the capital will be deployed across hiring, marketing, and R&D.
3. Specific Use Cases: While the 'Project X revenue model' is a good example, the deck lacks a slide showing a variety of industries or roles (e.g., Finance, HR, Marketing) using the tool. This would have helped ground the '1 billion users' claim in specific, repeatable workflows.
What a Founder Should Copy
1. The 'Before and After' Visual: Slide 5 is the most important slide in the deck. If your product transforms a messy process into a clean one, show them side-by-side. Don't just describe the features; show the output.
2. Defining Competition as a Habit: If you are entering a crowded market, don't just list competitors. Identify the 'traditional way' people solve the problem (like email attachments) and explain why that habit is your biggest rival. It makes your market entry feel more like an evolution than a war.
3. The 'Hard Technical Problems' Slide: Even if you are building a 'friendly' tool, you need to show investors that there is a 'moat.' Listing specific hard technical problems you've solved (Slide 7) gives the product weight and prevents it from looking like a simple wrapper.
Conclusion: GRID's deck succeeded because it took a boring, ubiquitous tool (the spreadsheet) and identified a specific, painful friction point (sharing and interactivity). It didn't ask users to change how they calculate; it only asked them to change how they show their work.
Frequently asked questions
- What is the primary problem GRID aims to solve?
- GRID addresses the 'torn fabric' of spreadsheet usage in organizations. While 1 billion people use spreadsheets for planning and analysis, the tools lack administration, governance, and effective sharing capabilities. Slide 4 notes that most sharing happens via email attachments or copy-pasting into static formats like PDFs, which creates version control issues and limits interactivity.
- How does GRID differentiate itself from traditional spreadsheets like Excel?
- GRID does not seek to replace Excel but to sit on top of it. Slide 7 explains that GRID provides a 'direct connection with cloud-based workbooks,' meaning updates in the spreadsheet are immediately reflected in GRID's interactive web documents. It acts as a presentation and interaction layer rather than a new grid-based calculation engine.
- What is GRID's go-to-market strategy?
- According to slide 9, GRID utilizes a freemium SaaS model. The initial 'Pro' offering is sold through self-service channels using fully digital customer acquisition. This strategy leverages the existing 'spreadsheet skills and assets' of users to drive adoption without requiring them to learn an entirely new system.
- Who are the key people behind GRID?
- The team is led by Hjalmar Gislason, a 5th-time founder who previously sold DataMarket to Qlik. The leadership team, including co-founders Thorsteinn Yngvi Gudmundsson, Borgar Thorsteinsson, and Steinn Eldjarn, is presented as a group of 'experienced software innovators' with significant tenure in the industry (Slide 11).
- What metrics are included in the deck?
- The deck is light on internal company metrics, likely because it was used for an early Series A. It focuses more on market-wide statistics, such as the fact that Excel accounts for approximately 2% of all computer time in the world and that 88% of users share their spreadsheets (Slides 3 and 4).