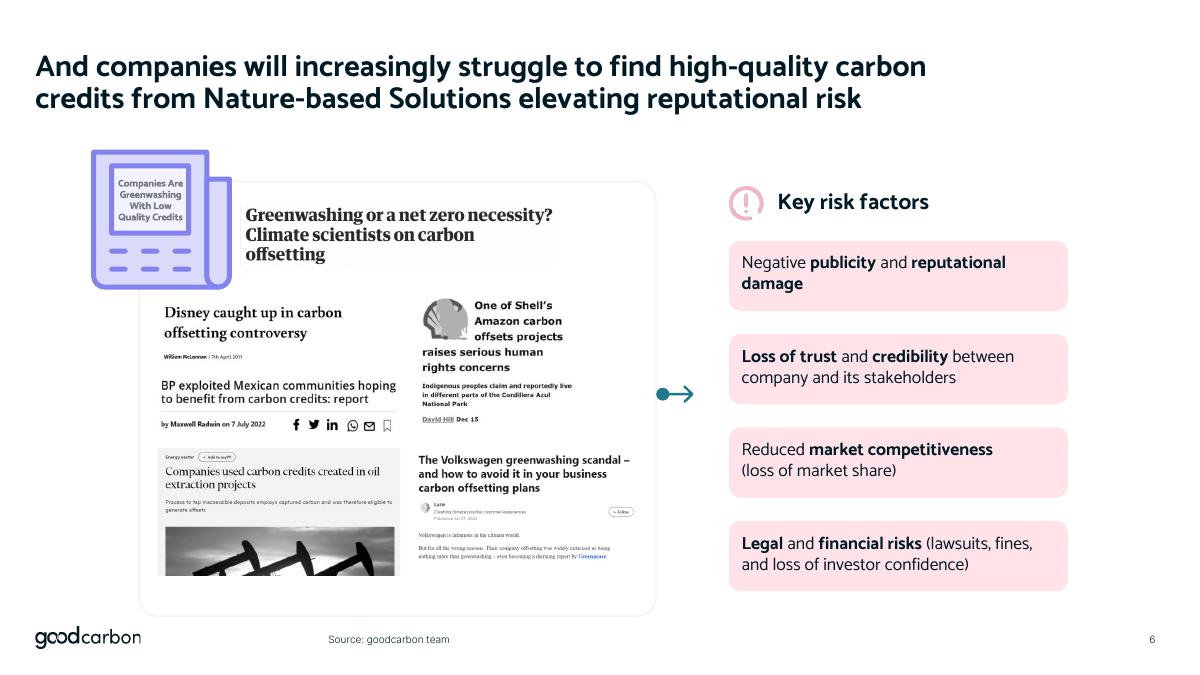
goodcarbon's April 2024 investor deck is 18 slides selling long-term carbon credit portfolios built from Nature-based Solutions to corporates with net zero targets. The public copy is redacted: revenue reads 'EUR XXm', clients are 'Company 1' to 'Company 10', every margin and key metric is the letter X, and the customer logo walls literally say 'Logo'. The market argument and the spot/forward/stream product ladder are excellent; the deck has no funding ask on any slide.
Key takeaways
- goodcarbon's April 2024 pitch deck is 18 slides pitching corporate buyers on long-term carbon credit portfolios sourced from Nature-based Solutions such as forests, mangroves, soil and ocean projects.
- The public copy of the deck is redacted: contracted revenue appears as 'EUR XXm', the ten-row client table is labelled Company 1 through Company 10, and every gross margin and key metric is shown as the letter X.
- Three slides rely on customer and partner logo walls, and in this copy every logo is replaced with the placeholder word 'Logo', so the 'Trusted by leading companies' claim carries no evidence.
- The deck's market chain is unusually tight: 3,000 companies with science-based net zero targets, a carbon removal gap from ~30m tonnes issued in 2023 to ~1.5bn needed by 2050, and removal prices forecast to rise 10-15x to 150-200 USD per tonne.
- The strongest slide is the contract ladder, which maps a buyer from spot credits today through forward and offtake agreements to carbon streams and owned projects out to 2040.
- A partnership with Swiss Re insuring against non-delivery, announced for Q2 2024, answers the biggest objection to buying forward carbon credits and is buried as a footnote under a chart rather than given its own slide.
- The only surviving hard figure is roughly 9,000k tonnes of spot and forward inventory across retail, marketplace and goodcarbon Originals channels, with the removal-versus-avoidance breakdown blanked out.
- The deck contains no funding ask, no round size, no use of funds and no competition slide, and the source line on 17 of 18 slides reads 'Source: goodcarbon team'.
What this deck actually is
This is goodcarbon's April 2024 investor and partner deck: 18 slides, 960x540 points, exported from Microsoft PowerPoint for Microsoft 365 on 8 May 2024 by Ricarda Roeller, who appears on the team slide as Director of Business Development. The company builds and manages long-term carbon credit portfolios for corporates, sourced from Nature-based Solutions — forests, mangroves, soil and ocean projects.
The important thing to understand before reading a single slide is that this is a redacted copy. Every traction number in the deck has been replaced with a placeholder. The revenue headline reads "EUR XXm". The client table lists Company 1 through Company 10 with blank revenue and "X%" gross margin. The key metrics box says "Sales cycle: X-X months" and "Median contract value: X EUR". The supply inventory grid is a matrix of the letter X. The customer logos are literally the word "Logo" repeated across three slides.
So there are two decks here. The one goodcarbon actually sends to a term-sheet conversation, which presumably has numbers in it, and the one that circulates publicly, which is a fully built narrative with the evidence surgically removed. Teardown-wise, that is unusually instructive: it lets you evaluate the argument architecture in isolation, and it shows you exactly which slides a company considers confidential. Both are worth studying.
Slide-by-slide walkthrough
Slide 1 — Cover
"We build & manage trustworthy, long-term carbon credit portfolios from Nature-based Solutions for companies." Dated April 2024, with goodcarbon.earth as the only contact detail. This is a complete positioning statement, not a tagline. It names the verb (build and manage), the object (carbon credit portfolios), the qualifier (trustworthy, long-term), the supply type (Nature-based Solutions) and the buyer (companies). A reader who stops after slide one already knows what the business is. Most cover slides cannot claim that.
Slide 2 — The climate crisis is a nature crisis
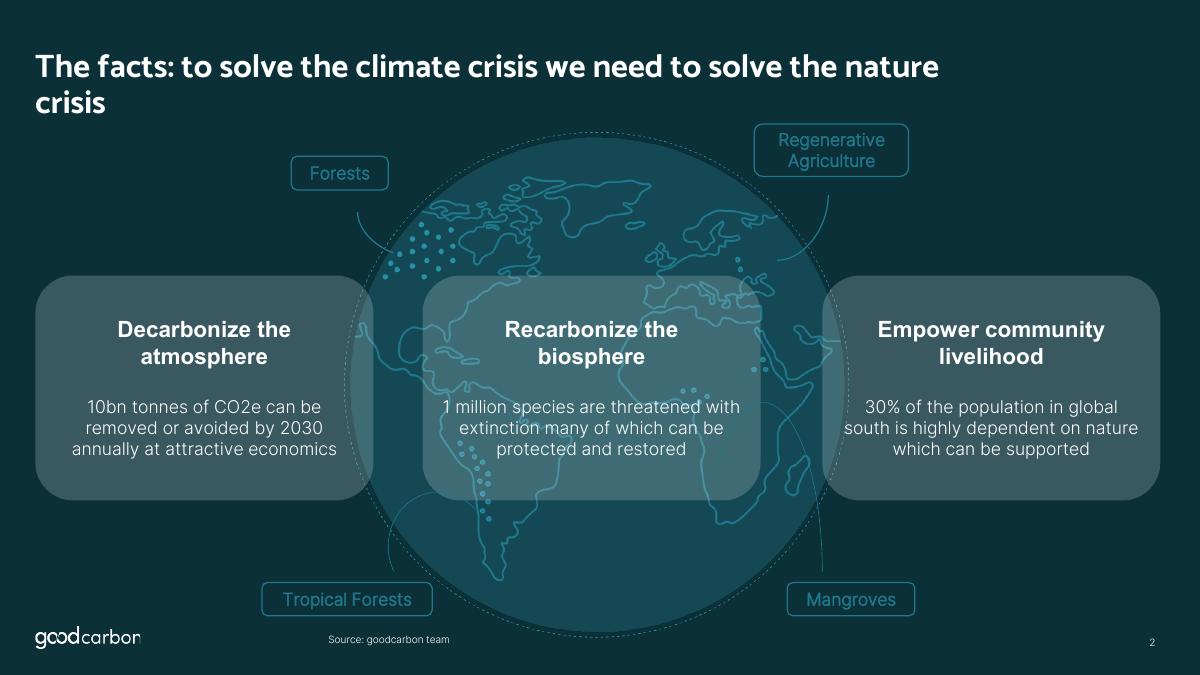
Three columns: decarbonize the atmosphere, recarbonize the biosphere, empower community livelihood. Each carries one number — 10bn tonnes of CO2e removable or avoidable annually by 2030 at attractive economics; 1 million species threatened with extinction; 30% of the population in the global south highly dependent on nature. Source line: "goodcarbon team". That source attribution repeats on all 17 content slides and is the deck's single weakest recurring habit. "Source: goodcarbon team" on a market-sizing figure means the company is citing itself.
Slide 3 — Demand exists by mandate
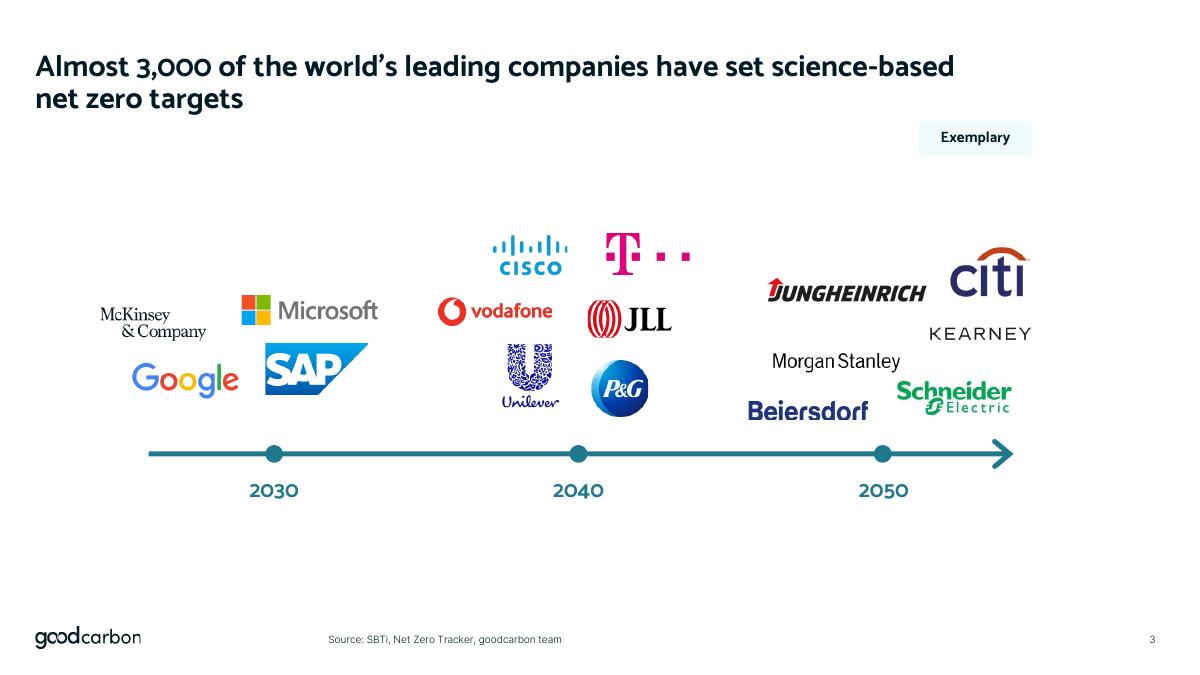
"Almost 3,000 of the world's leading companies have set science-based net zero targets," with a 2030/2040/2050 timeline and exemplary logos. Sources: SBTi, Net Zero Tracker, goodcarbon team. This is the strongest slide in the first act because it is the only one whose central claim rests on an external, verifiable registry. Demand for this category is not a forecast; it is a set of published corporate commitments with dates attached.
Slide 4 — Mind the gap
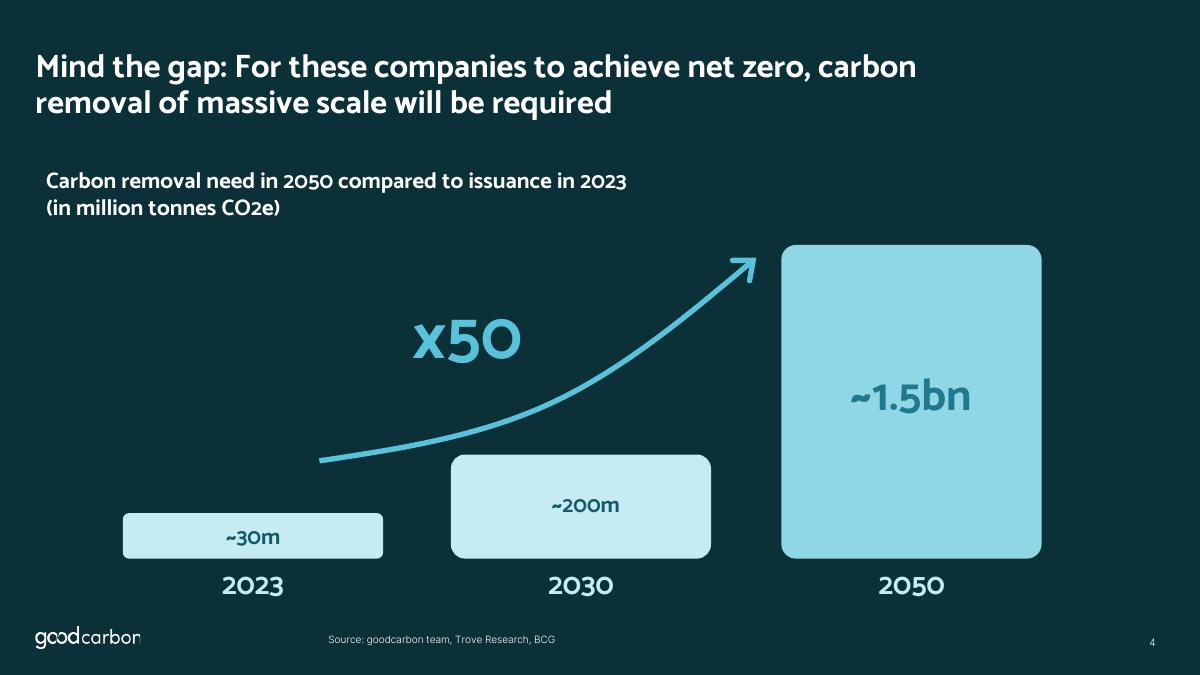
Carbon removal need in 2050 versus issuance in 2023: ~30m tonnes in 2023, ~200m in 2030, ~1.5bn in 2050. A "x50" callout spans the chart. Sources: goodcarbon team, Trove Research, BCG. This is the classic supply-demand-gap slide, and it does its job in one visual. The weakness is that a 50x gap over 27 years is also the market's central risk: nobody knows whether that gap gets closed by nature-based credits, by engineered removal, or by the targets quietly being revised.
Slide 5 — Price risk
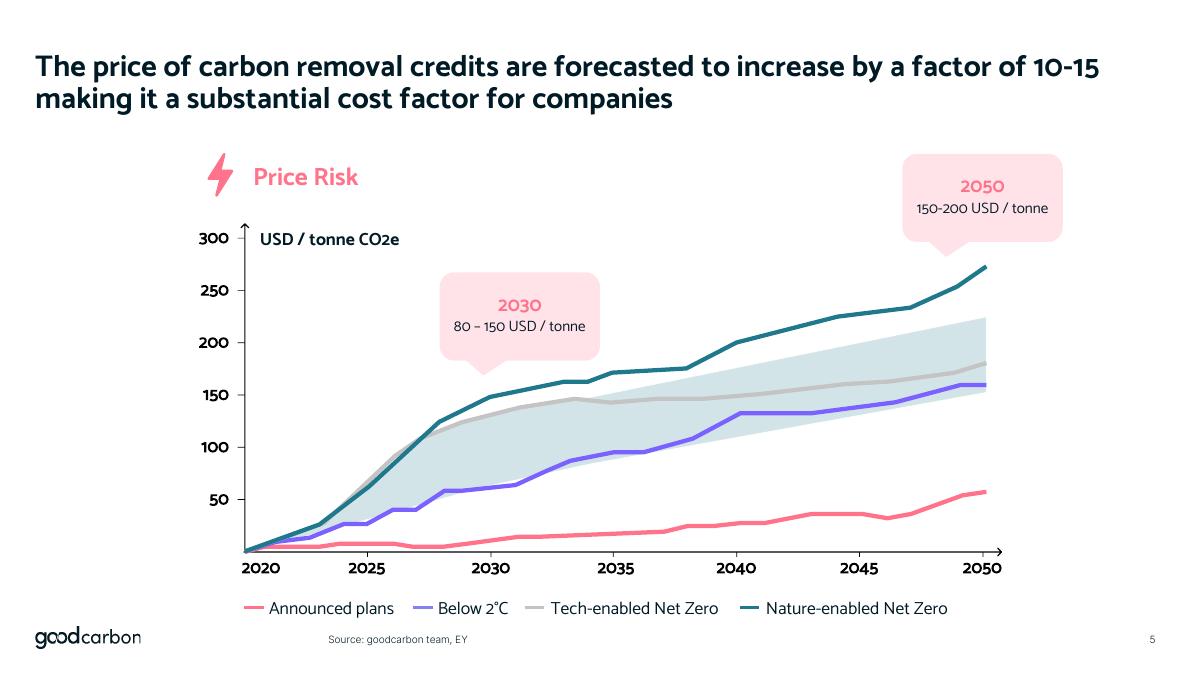
Removal credit prices forecast to rise by a factor of 10–15: 80–150 USD per tonne by 2030, 150–200 USD per tonne by 2050, across four scenarios (announced plans, below 2C, tech-enabled net zero, nature-enabled net zero). Source: goodcarbon team, EY. This is the commercial spine of the pitch. If prices rise 10x, buying forward is rational, and goodcarbon sells forward contracts. The argument is coherent. What is missing is the counter-case: if prices instead collapse because supply floods in, the forward book the company is building becomes a liability rather than an asset.
Slide 6 — Reputational risk
Four key risk factors of buying low-quality credits: negative publicity, loss of trust and credibility, reduced market competitiveness, legal and financial risks. No numbers, no cited example. In a market that spent 2023 absorbing high-profile journalism about worthless rainforest credits, this slide had the easiest job in the deck — name the incidents, name the buyers who got burned — and instead it stayed abstract. Four bullets of generic risk language where two dated, cited examples would have landed harder.
Slide 7 — Portfolio building: the contract ladder
The product slide, and the best one in the deck. A single chart maps a buyer's journey from "Scope 1+2 climate neutral" today to "Net-Zero" in 2040, layering three contract types: spot for short-term targets, forward/offtake for mid-term need, and streams or bespoke projects for the long-term portfolio. A footnote announces insurance against non-delivery in collaboration with Swiss Re in Q2 2024. That Swiss Re line is the single most valuable sentence in the deck and it is set in the smallest type on the page.
Slide 8 — Three supply sources
Marketplace projects (15 projects, 10m carbon credits), goodcarbon Originals (18,000 ha forest to be restored, more than 3m tonnes of CO2 to be removed, 42,700 people positively impacted), and bespoke project development (pre-feasibility, design, certification, implementation, monitoring). This is the supply-side moat slide. Note the tense: "to be restored", "to be removed". These are forward commitments, not delivered volumes, and the slide does not distinguish between the two.
Slide 9 — Global project map
A world map showing forest-, soil- and ocean-based projects with two "goodcarbon Original" pins. Pure geography, no counts, no volumes per region. It is the sort of slide that looks like evidence and carries none.
Slide 10 — Nature Analytics Framework
All projects are designed to or have passed goodcarbon's Nature Analytics Framework, with logos for project standards and integrity initiative alignment. Slide 12 later reveals the framework analyses impact, risk and integrity along 165 criteria. That number belongs here, on the slide that names the framework, not two slides later as a bullet in a benefits list.
Slide 11 — Portfolio management
Two halves: portfolio monitoring (review projects, receive status updates and Nature Analytics reassessments, adjust the portfolio if a project underperforms) and portfolio reporting (publish project pages in internal and external sustainability communication). This is the recurring-revenue argument. It is stated as a feature and never converted into a number — no management fee, no retention rate, no share of revenue that is recurring versus transactional.
Slide 12 — Why buyers choose goodcarbon
Three value propositions: verifiable nature, climate and social impact (the 165 criteria); plannable climate and nature pledges (hedging volume and price risk); amplified return on carbon credit investment. Alongside, two logo walls headed "Trusted by leading companies" and "Collaborating with innovative partners". In the public copy the trust wall is doing the heaviest lifting on the page and the logos are placeholders.
Slide 13 — Traction highlight (redacted)
"We contracted revenues of EUR XXm with trusted brands on the demand and the supply side." A quarterly contracted-revenue chart runs from Q4 2022 through Q1 2024 with no axis values, and the bars are built out of stacked boxes labelled "Logo". The shape of the chart implies growth. The deck asks you to accept the shape without the scale.
Slide 14 — Traction deep-dive (redacted)
A ten-row client table: Company 1 to Company 10 plus Other, with an empty revenue column and X% gross margin. A key metrics box lists sales cycle, median contract value, median contract value for the ideal customer profile, average gross margin on transactions and sales person efficiency — every one of them a letter X. Structurally this is an excellent slide. An investor wants exactly these five metrics for a B2B business, and the company clearly tracks them. In the public copy it conveys nothing except that the metrics exist.
Slide 15 — Supply inventory (partially redacted)
"We have built up an exclusive spot and forward inventory of ~9,000k tonnes across Retail, Marketplace and Originals." The one survivor: 9 million tonnes. The grid underneath splits avoidance versus removal by spot versus forward across three channels, and every cell is an X. That grid is the most important table in the whole deck — the removal-versus-avoidance split determines whether goodcarbon's inventory matches the premium demand it spent slides 4 and 5 describing — and it is entirely blank.
Slide 16 — The Great Green Wall of Gujarat
The flagship Originals project: a community-led mangrove restoration building a bio shield along 1,000km of Gujarat's 1,600km coastline. 1.5–3.0m tonnes of CO2 to be removed over the project lifetime, 10,000 hectares of forest and biodiversity restored, 1.6 million workdays created, 250 villages protected. Developed by an NGO with 45 years of rural development experience that has restored 2,300 ha of mangroves to date. Three problems addressed: soil erosion and coastal instability, seawater intrusion, and livelihoods for marginalised communities. This is the best-evidenced slide in the deck because the NGO's 2,300 ha is delivered work, not a projection.
Slide 17 — Team
Four people. Jerome Cochet, Co-Founder & MD — Global MD at Dunnhumby, SVP at Zalando, Engagement Manager at McKinsey, INSEAD. David Diallo, Co-Founder & MD — multi-exit entrepreneur (GoodJobs, GoodBuy, Enorm, epubli, myphotobook). Dr. Nicola Rodewald, Director NbS — PhD in Biology, Engagement Manager at McKinsey, MD of a company in the health sector. Ricarda Roeller, Director Biz Dev — Engagement Manager at Kearney, London Business School. Commercially heavyweight, and the science credential sits at director rather than founder level.
Slide 18 — Closing
"Let's restore nature, together!" with the goodcarbon wordmark and the website. No ask. No round size. No use of funds. No valuation, no milestones, no next-meeting request. An 18-slide deck that argues a 50x market gap and a 10–15x price increase ends by asking for nothing at all.
What this deck does better than most startup pitch decks
The problem is built as a chain, not a list. Nature crisis (slide 2) leads to mandated demand (3) leads to a supply gap (4) leads to price risk (5) leads to quality risk (6). Each slide is the reason the next one matters. By slide 7 the product is the only sensible conclusion. · The product slide sells a relationship, not a transaction. The spot/forward/stream ladder maps to a buyer's own net-zero timeline through 2040. It reframes a commodity purchase as multi-decade portfolio construction, which is also the argument for a higher-multiple business. · It names two risks and sells the hedge for both. Price risk and volume risk are stated explicitly, then answered by forward contracts and by owned supply. Very few decks are that clean about what the customer is actually buying. · The quality framework is a real differentiator, honestly bounded. "Designed to or have successfully passed" is a careful phrase. It admits some projects are still in assessment rather than claiming a fully certified portfolio. · The flagship project slide is specific. 1,000km of 1,600km, 10,000 ha, 250 villages, an NGO with 45 years of history and 2,300 ha already restored. Named geography and delivered work beat portfolio abstractions. · The traction slides are the right traction slides. Contracted revenue by quarter, revenue and gross margin by client, sales cycle, median contract value, ICP contract value, salesperson efficiency. That is the correct metric set for a B2B business, and the fact that it is pre-built means the data room version is likely strong.
Where this deck would fail in an investor meeting
There is no ask. Eighteen slides, no round size, no use of funds, no milestones the round buys. The final slide is a slogan. An investor cannot act on this deck without a follow-up email to find out what is being requested. · Every number that proves the business is redacted. Revenue is "EUR XXm", every client is "Company N", every margin is "X%", every key metric is "X". The one surviving figure — 9,000k tonnes of inventory — measures supply, not demand. · The trust wall is made of the word "Logo". Three slides depend on customer and partner logos and all three are placeholders. "Trusted by leading companies" with no companies is an assertion, not evidence. · "Source: goodcarbon team" appears on 17 of 18 slides. On the market slides it means the company is citing itself for the size of its own opportunity. Trove Research, BCG, EY and SBTi are named on four slides; everywhere else the source is internal. · Everything is forward-tense. "18,000 ha to be restored", "3m tonnes to be removed", "1.5–3.0m tonnes to be removed over project lifetime". There is no slide showing credits delivered and retired to date, which is the number that separates a broker from a promise. · The Swiss Re insurance is a footnote. Non-delivery is the biggest structural objection to buying forward nature-based credits. An insurance partnership with Swiss Re answers it. That belongs on its own slide, not in six-point type under a chart. · No competition slide. The carbon portfolio and NbS project development market has well-funded incumbents. Zero acknowledgement of any of them, and no stated reason why the Nature Analytics Framework is defensible rather than replicable. · No unit economics on the Originals. Developing bespoke projects is capital-intensive. There is no cost per hectare, no time to first issuance, no capital requirement — and no ask that would fund it.
Redacted public deck versus the deck that raises money
Revenue "EUR XXm" contracted Contracted vs recognised revenue, by quarter, with the 2024 run rate
Customers Company 1–10, logos say "Logo" Named logos, concentration (top-3 share), renewal or repeat rate
Margin "X%" per client Blended gross margin, split transaction vs management fee
Sales motion "Sales cycle: X-X months" Cycle length, pipeline coverage, CAC payback, quota attainment
Supply ~9,000k tonnes, grid all X Removal vs avoidance split, spot vs forward, cost basis per tonne
Delivery proof All forward-tense projections Tonnes issued and retired to date, per project
Risk cover Swiss Re as a chart footnote A dedicated slide on non-delivery insurance and buffer pools
Ask None Round size, instrument, use of funds, 18–24 month milestones
How you would rebuild this deck in 12 slides
Cover, unchanged. The positioning line already does the work. · Compress the market act from five slides to two. Slide 2 becomes the mandate (3,000 companies with SBTi targets, dated). Slide 3 becomes the gap plus the price curve on one page — 30m tonnes today, 1.5bn needed by 2050, prices up 10–15x. Cut the reputational-risk slide or fold it into a single line on the quality slide. · Keep the contract ladder as the product slide. It is the strongest page in the deck. Move the Swiss Re insurance line off the footnote and into a callout on the same page. · Merge supply sources and the map. One slide: three sourcing channels with tonnes secured under each, plotted on the map. Drop the decorative version. · Give Nature Analytics its number. "165 criteria across impact, risk and integrity" belongs on the framework slide with two or three of the criteria named, plus a rejection rate — how many assessed projects failed. A rejection rate is the only thing that makes a quality framework credible. · One traction slide with real numbers. Contracted revenue by quarter with an axis, named logos, blended gross margin, and the count of tonnes actually delivered and retired. · One economics slide. Median contract value, sales cycle, CAC payback, and the recurring share from portfolio management. · Keep Gujarat. Add cost per hectare and expected first issuance date to convert it from a story into an asset. · Add a competition slide. Three named alternatives, one row each, and the honest reason a buyer chooses goodcarbon over them. · Keep the team slide. Add whether the founders are full-time and the size of the current team. · Add the ask. Amount, instrument, use of funds across supply acquisition, project development and sales, and the specific milestones the money buys. · Close on the ask, not the slogan. "Let's restore nature, together" can be the sign-off line under a slide that states the number.
The transferable lesson
goodcarbon built a genuinely good argument and then published it with the evidence removed. That is a defensible choice for a public copy — contracted revenue and named clients are commercially sensitive. But it exposes something most founders get wrong in the other direction: this deck's narrative survives redaction because the logic chain is sound, while the average startup deck, stripped of its numbers, would collapse into nothing at all.
Test your own deck the way this one was accidentally tested. Delete every figure. Replace each customer name with "Company 1". If a reader can still follow why the problem exists, why it gets worse, why your product is the only reasonable response and what a buyer is actually purchasing, your structure is strong and the numbers will amplify it. If what remains is a series of unconnected claims, no amount of traction will rescue the story — investors will read the numbers, fail to see what they prove, and pass.
Then do the opposite check, which is the one goodcarbon's public copy fails: make sure the version you actually send has an ask on the last slide. A deck that argues a 50x market and never says what it wants is not a pitch. It is an essay.
Frequently asked questions
- What is goodcarbon?
- goodcarbon is a Berlin-based climate company that builds and manages long-term carbon credit portfolios for corporates, sourced from Nature-based Solutions. It supplies credits from three channels: marketplace projects, its own goodcarbon Originals projects, and bespoke project development, and it assesses every project against an internal Nature Analytics Framework covering 165 criteria.
- Is the goodcarbon deck a real investor pitch deck?
- Yes, but the publicly circulating April 2024 copy is redacted. It has the full structure of an investor deck including traction, client economics and supply inventory slides, but the numbers on those slides have been replaced with placeholders such as XX, X% and Company 1 through Company 10, and the customer logos read 'Logo'.
- How many slides is the goodcarbon pitch deck?
- Eighteen slides at 960x540 points, exported from Microsoft PowerPoint for Microsoft 365 in May 2024 and dated April 2024 on the cover. The structure is one cover slide, five market slides, five product and quality slides, three traction slides, one flagship project slide, a team slide and a closing slide.
- What are Nature-based Solutions carbon credits?
- They are carbon credits generated by protecting or restoring natural ecosystems such as forests, mangroves, soils and coastal habitats, rather than by engineered capture. goodcarbon's deck argues they deliver three benefits at once: removing or avoiding emissions, restoring biodiversity, and supporting livelihoods in communities that depend on nature.
- Which slides should founders copy from this deck?
- Two. The market chain across slides two to five, where each slide is the reason the next one matters, and the contract ladder product slide, which maps spot, forward and stream contracts onto the buyer's own net zero timeline. Together they turn a commodity purchase into a multi-decade portfolio relationship.
- What is the biggest weakness in the goodcarbon deck?
- There is no ask. Across eighteen slides there is no round size, no instrument, no use of funds and no milestones, and the final slide is the slogan 'Let's restore nature, together!'. Combined with fully redacted traction numbers and placeholder logos, the public copy gives an investor nothing to act on.