This 2017 investor presentation from Golden Star Resources (GSR) serves as a progress report and growth thesis for a mid-tier gold producer operating in Ghana. The deck focuses heavily on the transition from open-pit to higher-grade underground mining at two primary sites: Wassa and Prestea. By highlighting a management team with over 28 years of individual experience and technical data showing significant underutilized processing capacity (e.g., Wassa's 7,700 tpd plant capacity versus a 2,200 tpd targeted mining rate), the company argues for a clear path to increased production and lower uni…
Key takeaways
- The company operates two main assets in Ghana: the Wassa Gold Mine and the Prestea Gold Mine, both transitioning to underground operations (Slides 7 and 13).
- Management is highly experienced, led by CEO Sam Coetzer who has 28 years of experience with firms like Kinross and Xstrata (Slide 4).
- Wassa's 2017 forecast production was set at 135-150 Koz, a significant increase from 104 Koz in 2016 (Slide 7).
- Prestea Underground is highlighted as a high-grade asset with Mineral Reserves of 1.1Mt at 13.93g/t (Slide 13).
- There is significant 'latent' value in underutilized infrastructure, with Wassa's processing plant capable of 7,700 tpd despite a current 2,200 tpd target (Slide 19).
- Exploration upside is demonstrated through 3D geological modeling of the B Shoot North and Prestea West Reef (Slides 10 and 16).
- The company is publicly traded on the NYSE American and TSX, with a market capitalization of $289m as of late 2017 (Slide 22).
- Institutional backing is strong, featuring shareholders like Van Eck, Franklin Templeton, and BlackRock's Gold 2000 (Slide 22).
Executive Summary and Leadership
Slide 1: Title Slide
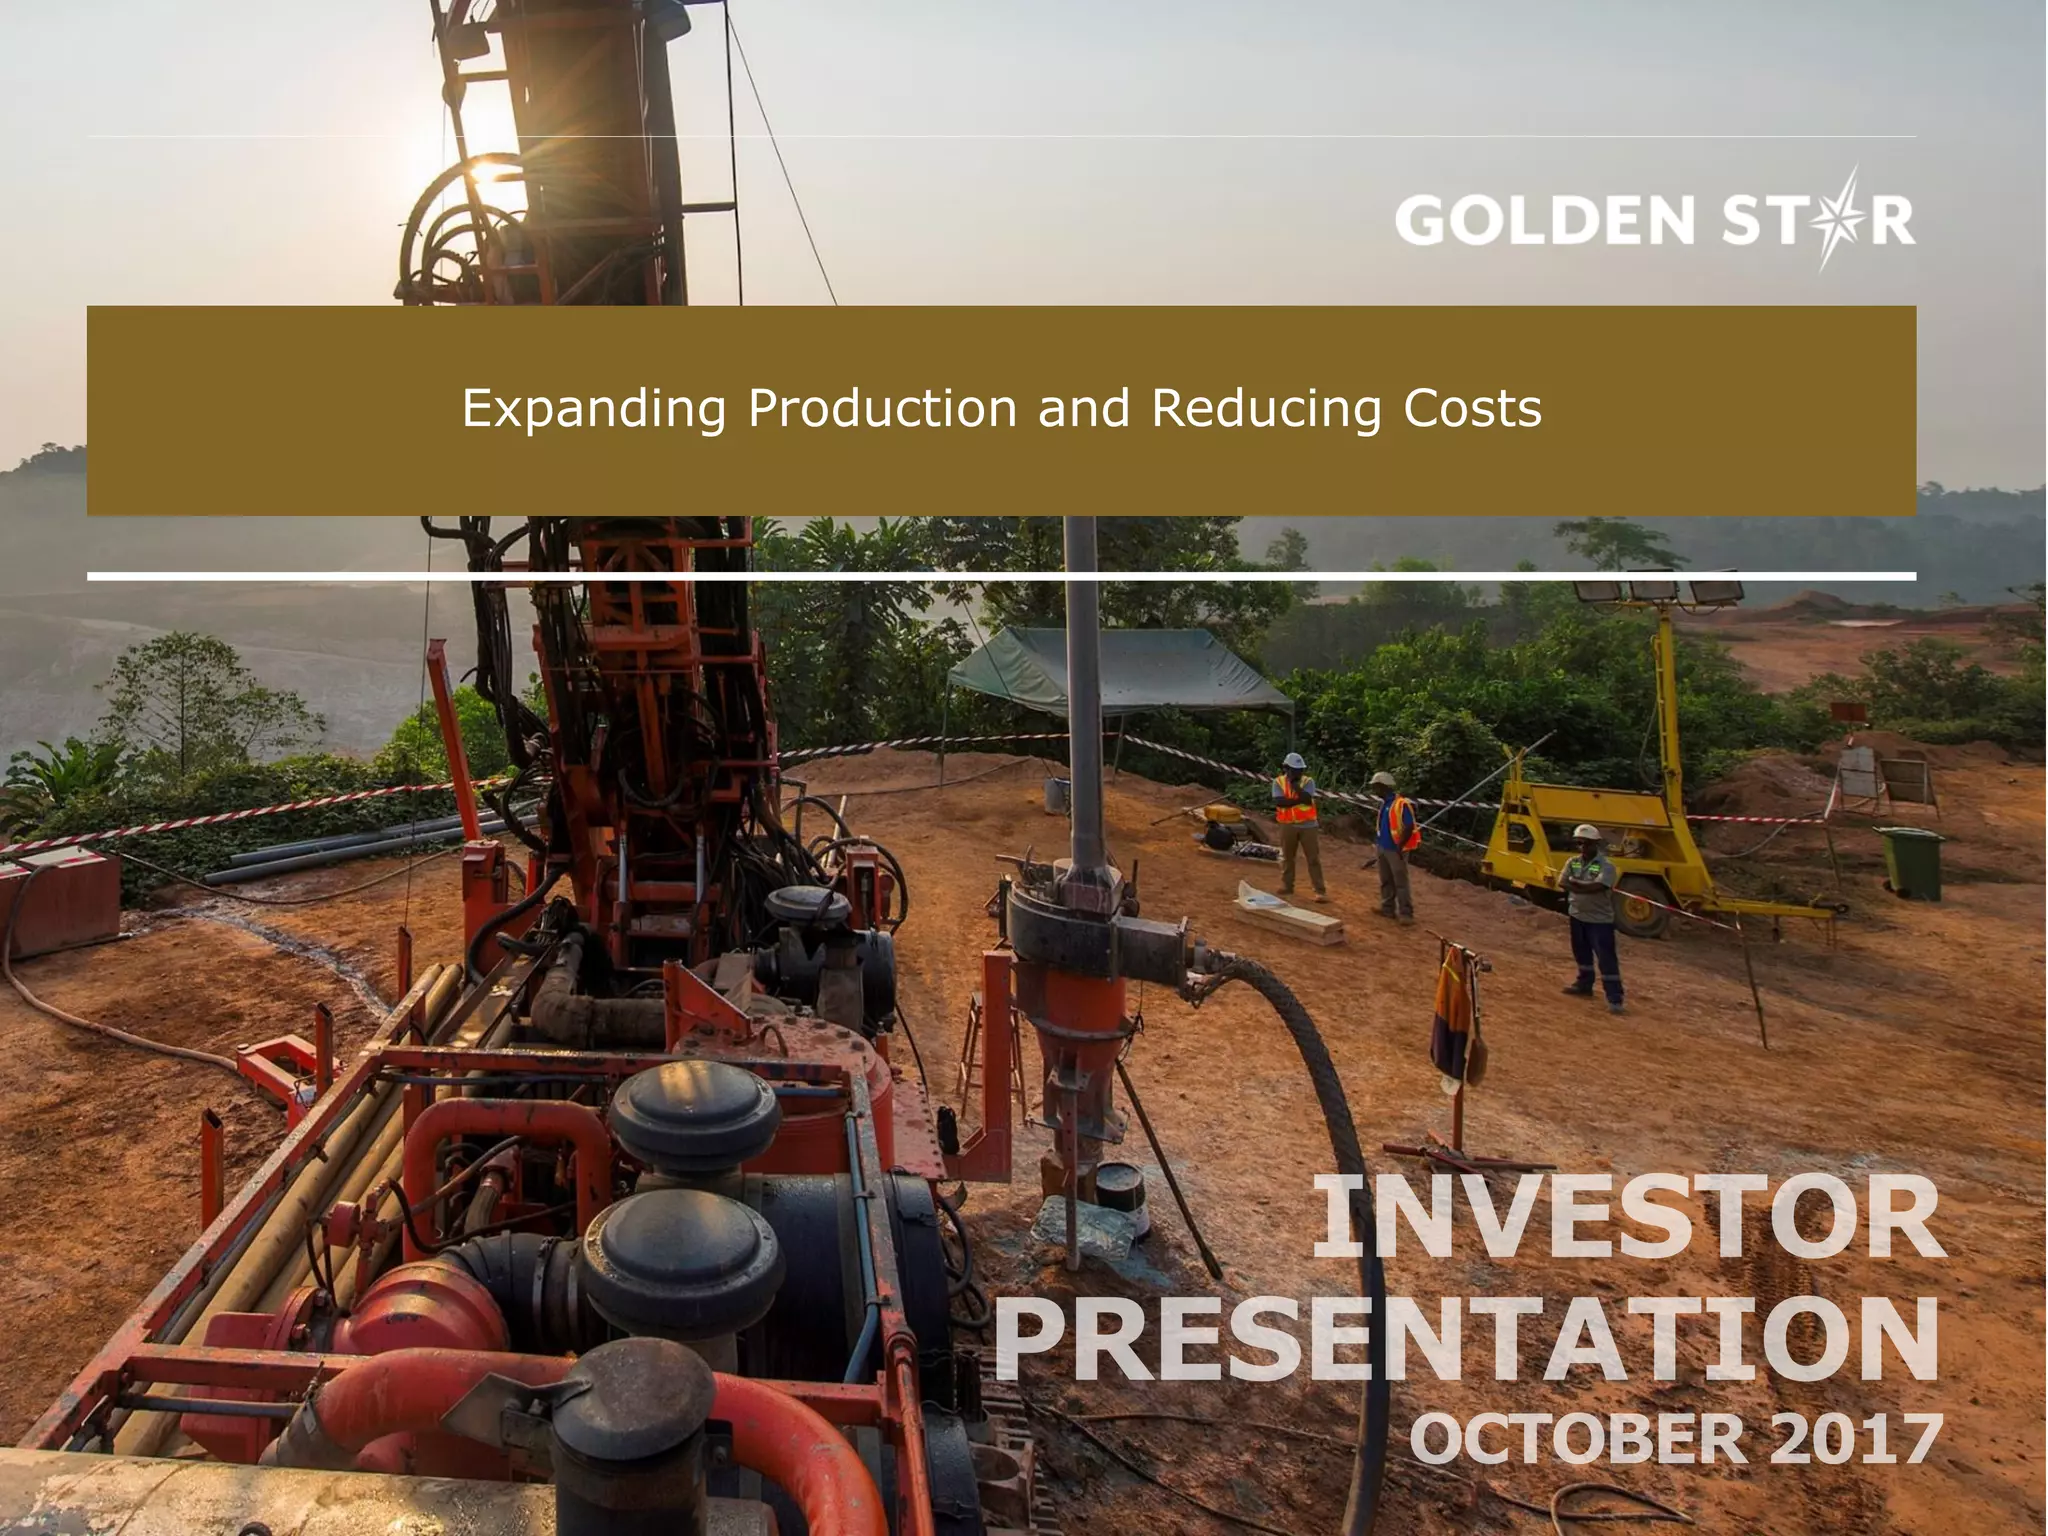
The presentation begins with a high-resolution photograph of a drilling rig in operation at a mine site. The title, "Expanding Production and Reducing Costs," establishes the primary value proposition for investors. The Golden Star logo is prominently displayed, and the deck is dated October 2017.
Slide 4: Experienced Management and Technical Leadership
This slide introduces the executive team, emphasizing deep industry experience and regional expertise. Sam Coetzer, President & CEO, is highlighted as a mining engineer with 28 years of experience at major firms including Kinross and Xstrata. The slide also features André van Niekerk (CFO), Daniel Owiredu (COO), Martin Raffield (SVP Project Development), and Mitch Wasel (VP Exploration). Notably, Owiredu and Wasel are credited with significant tenure in Ghana (20 years and 17 years respectively), signaling to investors that the company possesses the local knowledge necessary to navigate the West African mining landscape. The inclusion of a Ph.D. in geotechnical engineering (Raffield) reinforces the technical rigor of the team.
Asset Deep Dive: Wassa Gold Mine
Slide 7: Wassa Gold Mine: Snapshot
Wassa is presented as a mature asset that commenced production in 2005. The slide lists mineral reserves of 1.3Moz at a grade of 2.37g/t, with a remaining mine life of 7 years based on current reserves. A key operational detail is the 2.7Mtpa processing plant located within 500m of the pit. The financial table compares 2016 actuals with 2017 forecasts: production was expected to rise from 104 Koz to a range of 135-150 Koz, while cash operating costs were projected to drop from $941/oz to between $880-$935/oz. This slide effectively communicates the "expanding production and reducing costs" theme through hard metrics.
Slide 10: B Shoot North: Potential To Increase Near-Term Production
This technical slide uses a 3D geological model to show the "B Shoot North" extension drilling. It notes promising results from 15 holes and states that the ore body remains open to the north. The visual representation of the F Shoot and B Shoot Panel 1 Transverse Stopes provides evidence of the mine's expansion potential beyond current reserves, targeting an increase in ounces for the Wassa Underground mine plan in the near term.
Asset Deep Dive: Prestea Gold Mine
Slide 13: Prestea Gold Mine: Snapshot
Prestea is described as a historic site with over 100 years of mining history, acquired by Golden Star in 1999. The focus here is the transition to high-grade underground mining. The slide notes that Prestea Underground has mineral reserves of 1.1Mt at a very high grade of 13.93g/t for 490Koz. The forecast for 2017 showed a massive jump in production from 90 Koz in 2016 to 120-130 Koz. Most impressively, the forecast cash operating cost was projected to drop from $800/oz to $680-$725/oz, driven by the high-grade underground ore.
Slide 16: Prestea Underground: Close Up of 2017 Drilling
Similar to the Wassa technical slide, this provides a cross-section of the Prestea Underground levels (17 Level to 30 Level). It maps out the Main Reef mined stopes, the West Reef planned stopes, and inferred resource blocks. The slide explicitly states that successful drilling in late 2017/2018 represents an opportunity to increase the annual production rate and extend the life of the mine. This level of geological detail is standard for mining decks to justify "blue sky" potential to institutional investors.
Growth Strategy and Market Position
Slide 19: Expansion Potential At Both Underground Operations
This is arguably the most important strategic slide in the deck. It uses two large arrows to compare current mining rates against existing infrastructure capacity. For Wassa Underground, the targeted mining rate was 2,200 tpd, yet the shaft capacity is 4,000 tpd and the processing plant capacity is 7,700 tpd. Prestea shows a similar gap: a 650 tpd target against a 4,000 tpd processing capacity. The message is clear: Golden Star has already built the expensive infrastructure; now, it simply needs to increase the mining rate to achieve massive economies of scale.
Slide 22: Appendices: Market Information
The final slide provides a comprehensive look at the company's capital structure and market standing as of late 2017. It includes a one-year share price graph showing volatility between $0.60 and $1.00. Key metrics include 380.5 million shares in issue, a $289 million market cap, $25.9 million in cash, and $94.1 million in debt. The slide also lists heavy-weight institutional shareholders, including Van Eck and Franklin Templeton, and names six major analyst coverage firms (e.g., BMO Capital Markets, Scotiabank), which serves as a form of social proof for the stock's legitimacy.
What Golden Star Resources Does Well
The deck is exceptionally strong at demonstrating operational leverage . By showing the massive gap between current production and total plant capacity (Slide 19), the founders make a compelling case that every additional ounce of gold produced will be significantly more profitable than the last, as the fixed costs of the plants are already covered. Furthermore, the use of technical geological data (Slides 10 and 16) moves the presentation beyond mere marketing and into the realm of a professional mining prospectus, which is essential for the target audience of institutional resource investors.
What is Missing
The deck lacks a clear Environmental, Social, and Governance (ESG) section. While it mentions the long history in Ghana and the local experience of the team, there is no specific data on safety records, community relations, or environmental reclamation efforts, which were becoming increasingly important to institutional investors in 2017. Additionally, while the deck mentions $94.1 million in debt (Slide 22), it does not provide a debt maturity schedule or a clear explanation of how the increased production will be used to deleverage the balance sheet.
What a Founder Should Copy
Founders in capital-intensive industries should emulate the "Latent Capacity" visualization on Slide 19. If your startup has built a platform, a factory, or a network that is currently underutilized, showing the "headroom" for growth without additional CAPEX is a powerful way to argue for future margin expansion. Additionally, the Management Slide (Slide 4) is a masterclass in highlighting relevant experience; it doesn't just list titles, it lists specific years of experience and previous high-profile employers, immediately establishing credibility.
Frequently asked questions
- What are the primary mining assets discussed in the deck?
- The deck focuses on two major Ghanaian assets: the Wassa Gold Mine and the Prestea Gold Mine. Wassa is described as an open-pit and underground operation that commenced production in 2005, while Prestea is a historic mining site (100+ year history) acquired in 1999 that was ramping up its underground production in 2017.
- How does the company plan to reduce its operating costs?
- The strategy relies on increasing the grade of ore processed by transitioning to underground mining and utilizing existing, underutilized infrastructure. For example, Slide 19 shows that both mines have processing and shaft capacities far exceeding their 2017 mining rates, meaning production can scale without massive new capital expenditure on plants.
- What is the projected production for the Wassa mine?
- According to Slide 7, the 2017 forecast production for Wassa was between 135,000 and 150,000 ounces. This represented a substantial increase over the 104,000 ounces produced in 2016. The life-of-mine average annual production is expected to be approximately 175,000 ounces.
- What is the financial position of Golden Star Resources in this deck?
- Slide 22 details the market information as of late 2017. The company had a market capitalization of $289 million, with a share price of $0.76. It held $25.9 million in cash against $94.1 million in debt. The stock was traded on the NYSE American (GSS) and TSX (GSC).
- Who leads the technical and executive team?
- The team is led by President & CEO Sam Coetzer, a mining engineer with 28 years of experience. Other key leaders include Daniel Owiredu (COO) with 20 years of West African mining experience and Martin Raffield (SVP Project Development), who holds a Ph.D. in geotechnical engineering.