Golden Star (GSR), a publicly traded mining company on the NYSE and TSX, used this December 2016 presentation to communicate a fundamental shift in its business model. The company moved away from high-cost refractory ore production to focus on high-grade underground assets at its Wassa and Prestea mines in Ghana. The deck is a masterclass in managing investor expectations during a turnaround, detailing a $150 million financing agreement with Royal Gold and the repayment of multiple Ecobank loans to align debt maturity with future cash flows. By providing granular operational data—such as a 70…
Key takeaways
- The company secured a $150 million financing agreement and $20 million loan with Royal Gold to fund underground developments (Slide 5).
- Golden Star successfully transitioned into a non-refractory producer by replacing 2Moz of refractory reserves with non-refractory reserves (Slide 5).
- Prestea Underground reserves are noted as very high grade at 14.02g/t for 469Koz (Slide 13).
- The company demonstrates a strong historical M&I Resource to Reserve conversion rate of approximately 70% (Slide 17).
- Debt maturity was significantly restructured, moving a large $81 million obligation in 2017 to a more manageable $19 million (Slide 21).
- Wassa 2016 production guidance was set at 89,000-97,000oz from the Main Pit plus 11,000-15,000oz from Underground (Slide 29).
- Cash operating costs at Wassa rose to $1,110/oz in Q3 2016 compared to $770/oz in Q3 2015 due to higher dilution (Slide 29).
- The presentation provides direct contact information for Investor Relations, reflecting its status as a publicly traded entity (Slide 32).
Golden Star: A Case Study in Public Company Turnarounds
The December 2016 investor presentation for Golden Star (GSR) is not a typical startup pitch deck. As a company listed on both the NYSE and TSX, the stakes for this presentation were high: convincing the public markets that a fundamental shift in mining strategy and a massive debt restructuring would lead to long-term profitability. The deck focuses on the transition from open-pit refractory mining to high-grade underground operations in Ghana.
Slide 1: Title and Vision
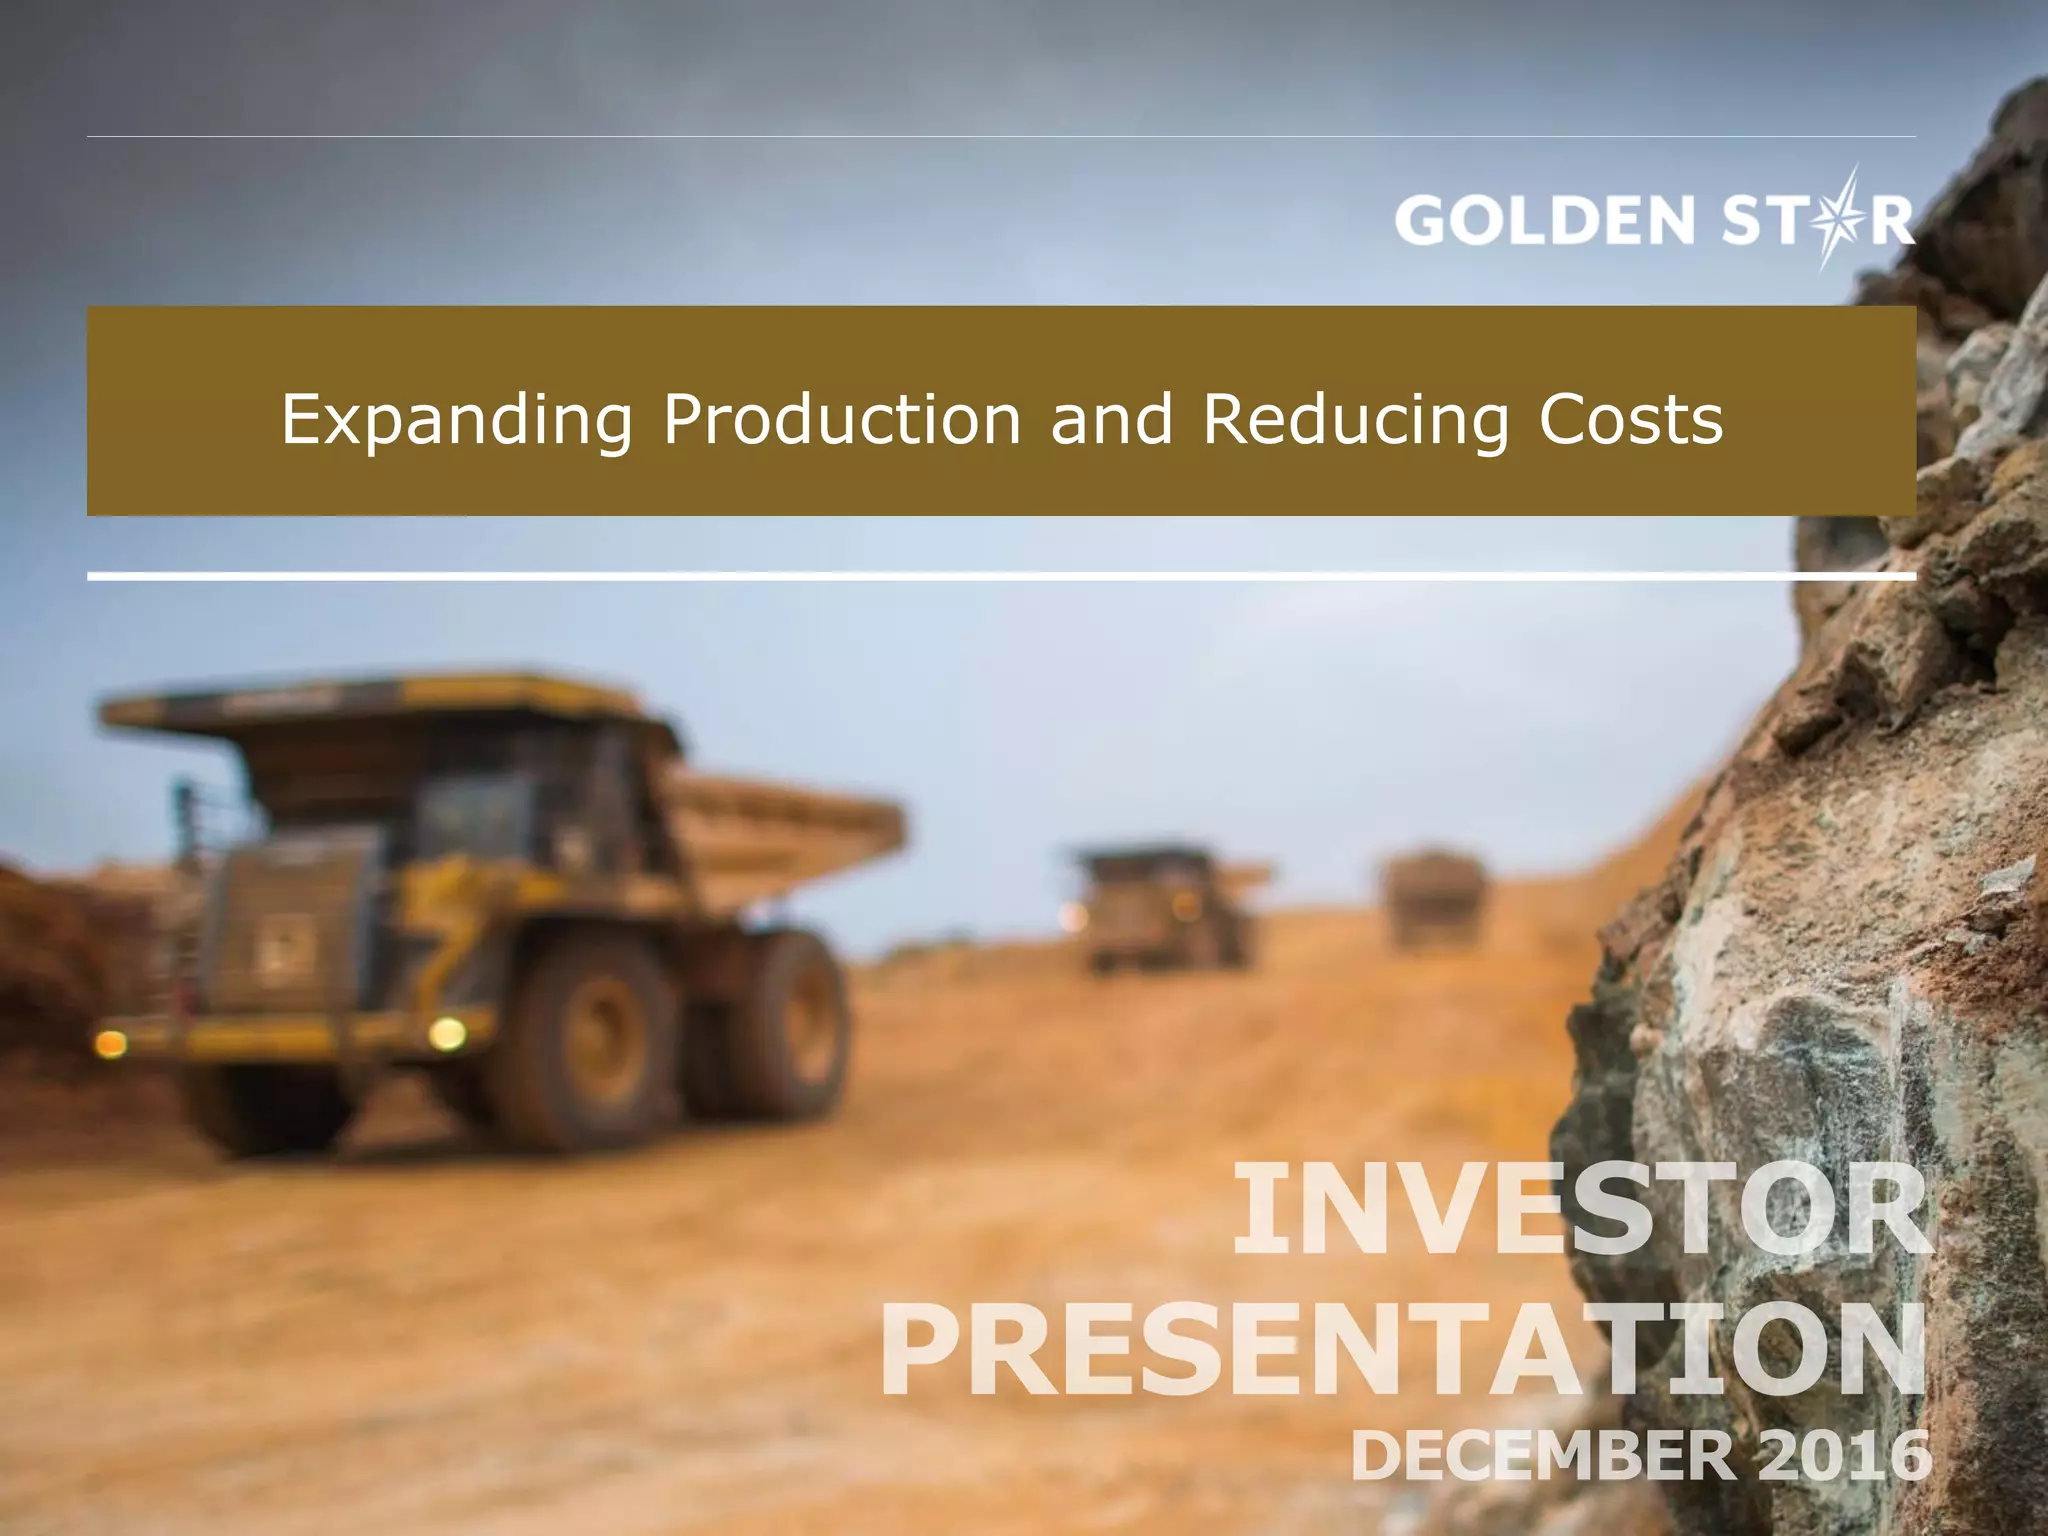
The cover slide establishes a clear, dual-purpose theme: "Expanding Production and Reducing Costs." The imagery of heavy machinery at a mine site immediately grounds the presentation in industrial reality. The date, December 2016, is prominent, signaling that this is a timely update for the fiscal year-end and the upcoming 2017 production cycle.
Slide 5: The Transformation Roadmap
This slide is the executive summary of the company's recent achievements and near-term goals. It is divided into three logical sections: financial strengthening, operational transition, and upcoming milestones. Key figures include a $150m financing agreement with Royal Gold and the repayment of $75m in Ecobank loans. The slide also notes the cessation of refractory production at Bogoso, a major strategic pivot. By using checkmarks for completed tasks, the company visually demonstrates execution capability before asking investors to believe in the "Upcoming Milestones" like commercial production at Wassa Underground in early 2017.
Slide 9: Operations & Exploration Overview
This is a transition slide that introduces the two primary assets: Wassa Gold Mine and Prestea Gold Mine. The high-contrast photography of night operations suggests a 24/7 work cycle, reinforcing the scale of the enterprise. It sets the stage for the deep dive into the specific geology and economics of these two sites.
Slide 13: Prestea Gold Mine - The High-Grade Bet
Slide 13 focuses on the Prestea mine, emphasizing the phase-out of refractory ore. The company highlights a "+100 year history of mining at Prestea," which provides a sense of geological stability. The most critical data point here is the Prestea Underground reserves: 1.0Mt at 14.02g/t for 469Koz. In the mining world, 14g/t is exceptionally high grade. The table at the bottom compares 2015 actuals with 2016 forecasts, showing a projected drop in cash operating costs from $1,108/oz to a range of $800-$890/oz, directly supporting the deck's title theme of cost reduction.
Slide 17: Mineral Reserve Expansion Potential
This slide addresses the "upside" for investors. It explains the objective to convert Measured & Indicated (M&I) Resources into Mineral Reserves. The company boasts a historical conversion rate of approximately 70% , a strong technical metric. It also notes that only 42% of Wassa's and 57% of Prestea's M&I resources are currently classified as reserves, implying significant room for growth through further drilling without needing to acquire new land.
Slide 21: Debt Maturity Restructuring
For a company in transition, the balance sheet is as important as the mine. Slide 21 uses two bar charts to show the "Pre-Transaction" vs. "Post-Transaction" debt maturity schedules. The transformation is stark: a massive $81 million debt wall in 2017 was dismantled and spread out , with only $19 million due in 2017 and the largest chunk ($65 million) pushed to 2021. This visual proof of "strengthening the balance sheet" is essential for maintaining investor confidence during the capital-intensive phase of underground development.
Slide 29: Q3 2016 Operational Results
Transparency is the theme of Slide 29. The company admits that Q3 2016 cash operating costs were high ($1,110/oz) compared to Q3 2015 ($770/oz). They explain this was due to "higher than expected dilution during mining." However, they immediately pivot to the "Measures put in place to reduce dilution" and provide 2016 production guidance of 89,000-97,000oz for Wassa Main Pit. This slide is a good example of how to report bad news by pairing it with a corrective action plan and forward-looking guidance.
Slide 32: Contact and Compliance
The final slide provides direct contact information for Katharine Sutton in Investor Relations. It also lists the ticker symbols for the NYSE MKT (GSS) and TSX (GSC). This reinforces the company's accessibility and its status as a regulated, public entity.
What Golden Star Does Well
Golden Star excels at providing granular, technical data that mining investors require. They don't just say they have gold; they provide the tonnage, the grade (g/t), and the specific classification (Reserves vs. Resources). The use of comparative debt schedules (Slide 21) is a brilliant way to visualize financial health improvements. Furthermore, their willingness to explain operational setbacks (like the dilution issues on Slide 29) builds credibility. They treat the investor as a partner who understands the complexities of mining rather than a spectator to be dazzled by hype.
What is Missing from the Deck
While the deck is comprehensive for an operational update, a few elements are notably absent from these specific slides:
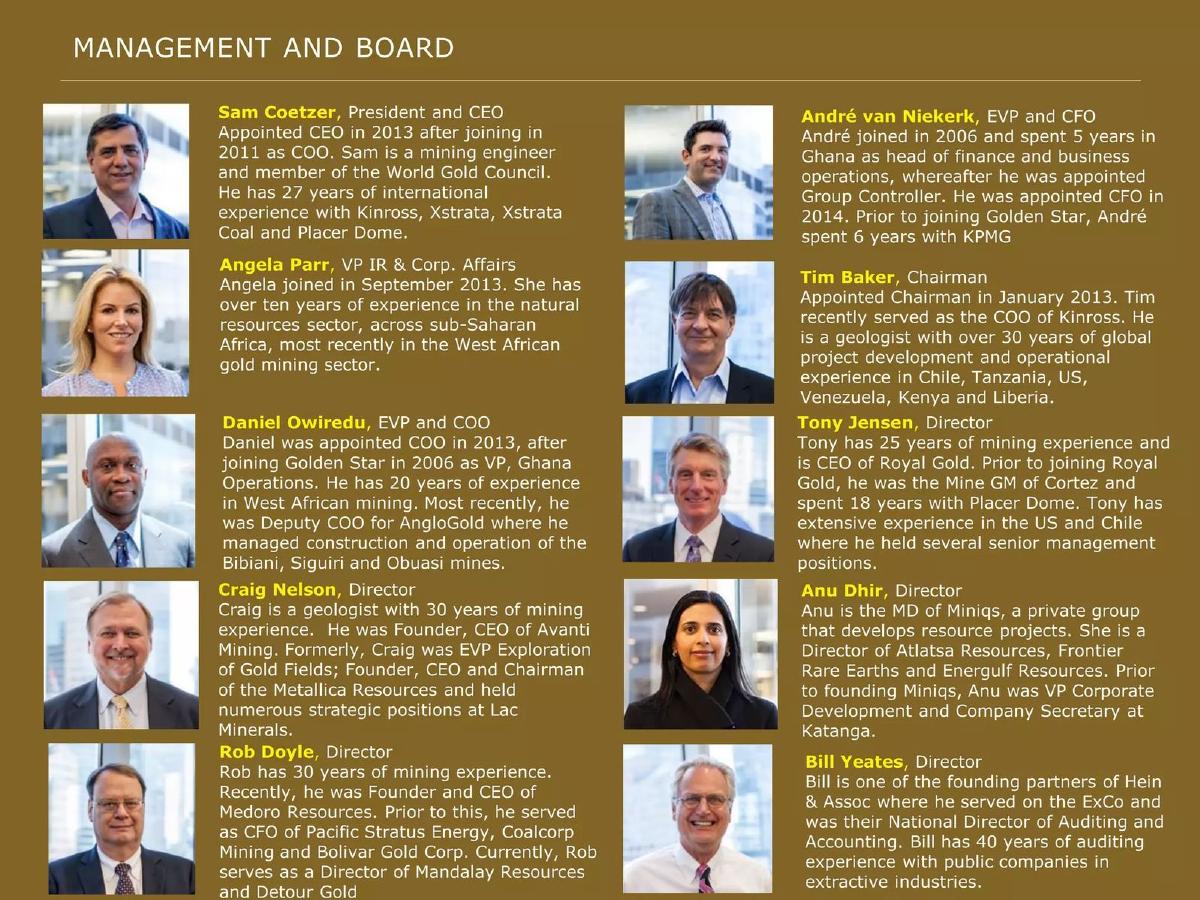
Management Team: There is no slide detailing the experience of the board or executive leadership. In a turnaround, the "who" is often as important as the "what." · Gold Price Sensitivity: The deck assumes a certain gold price to make its "low cost" claims attractive, but it does not provide a sensitivity analysis showing how the company performs if gold prices drop significantly. · Environmental and Social Governance (ESG): For a mine operating in Ghana, there is very little mention of community relations, environmental impact, or safety records in these slides, which are increasingly critical for institutional investors.
Lessons for Founders
Founders can learn several key lessons from this public-market presentation: 1. Visualize the Turnaround: If your company is changing direction, use "Before and After" visuals. Golden Star's debt maturity charts are the perfect example of showing, not just telling, that a problem has been solved. 2. Own Your Metrics: Even when the numbers are bad (like the Q3 cost spike), presenting them clearly alongside a solution is better than hiding them. Transparency builds trust. 3. Focus on the 'High-Grade' Asset: Every business has a "high-grade" equivalent—the one product, client, or unit that has the best margins. Golden Star put their 14.02g/t reserve front and center because it is the engine of their future profitability. Identify your engine and make sure investors can't miss it.
Frequently asked questions
- What was the primary strategic shift for Golden Star in 2016?
- The primary shift was transitioning from a refractory ore producer to a high-grade, non-refractory producer. This involved ceasing refractory production at the Bogoso mine and investing in exploration to replace 2Moz of refractory reserves. The company focused on developing underground operations at Wassa and Prestea to achieve a lower operating cost profile.
- How did the company handle its significant debt load?
- Golden Star executed a major balance sheet strengthening exercise. They secured $150 million from Royal Gold, repaid $75 million in Ecobank loans, and refinanced convertible debentures. Slide 21 shows they successfully pushed major repayments from 2017 into later years, better aligning debt service with the expected cash flow from new underground production.
- What are the specific production grades for the new underground mines?
- The Prestea Underground is highlighted as a 'very high grade' asset with reserves of 1.0Mt at 14.02g/t, totaling 469Koz of gold. This high grade is central to the company's strategy of becoming a low-cost producer, as higher gold concentration typically reduces the cost per ounce of extraction.
- Why did operating costs increase at the Wassa mine in late 2016?
- According to Slide 29, cash operating costs at Wassa increased to $1,110/oz in Q3 2016. This was attributed to weaker production in Q2 due to higher than expected dilution during mining. The company implemented measures to reduce dilution and process higher-grade ore to bring costs back in line with the $900-$990/oz guidance.
- What is the significance of the 70% resource conversion rate?
- Slide 17 cites a 70% historical conversion rate from Measured & Indicated (M&I) Resources to Mineral Reserves. This metric is crucial for mining investors as it demonstrates the company's technical proficiency and the reliability of its geological modeling, suggesting that current resources are highly likely to become mineable, profitable reserves.