Golden Star’s September 2015 investor presentation serves as a progress report on a major corporate turnaround. The company communicates a shift away from high-cost, low-margin refractory gold production toward high-grade, lower-cost underground mining in Ghana. By replacing 150,000 ounces of Bogoso production with 80,000 high-margin Prestea ounces, the company aims to optimize its return on capital rather than chasing volume. The deck provides granular operational updates, including a $40M initial capex for Prestea and a 72% Internal Rate of Return (IRR) projection. While the deck excels at…
Key takeaways
- The company is explicitly prioritizing operating margin over total ounces produced, replacing 150,000 oz of Bogoso production with 80,000 high-margin Prestea oz (Slide 7).
- Management projects an Internal Rate of Return (IRR) in excess of 70% for its new projects through operational leverage (Slide 7).
- The Wassa Underground project is progressing to schedule with first production expected in early 2016 (Slide 10).
- Prestea Underground Preliminary Economic Assessment (PEA) results show an All-In Sustaining Cost (AISC) of $518 per ounce (Slide 13).
- The company holds the largest land tract on the Ashanti Gold belt with substantial resource potential, including 1M oz of Inferred Resources at Wassa (Slide 16).
- Mine operating expenses show a clear downward trend, dropping from $72.9M in Q2 2014 to $60.2M in Q2 2015 (Slide 19).
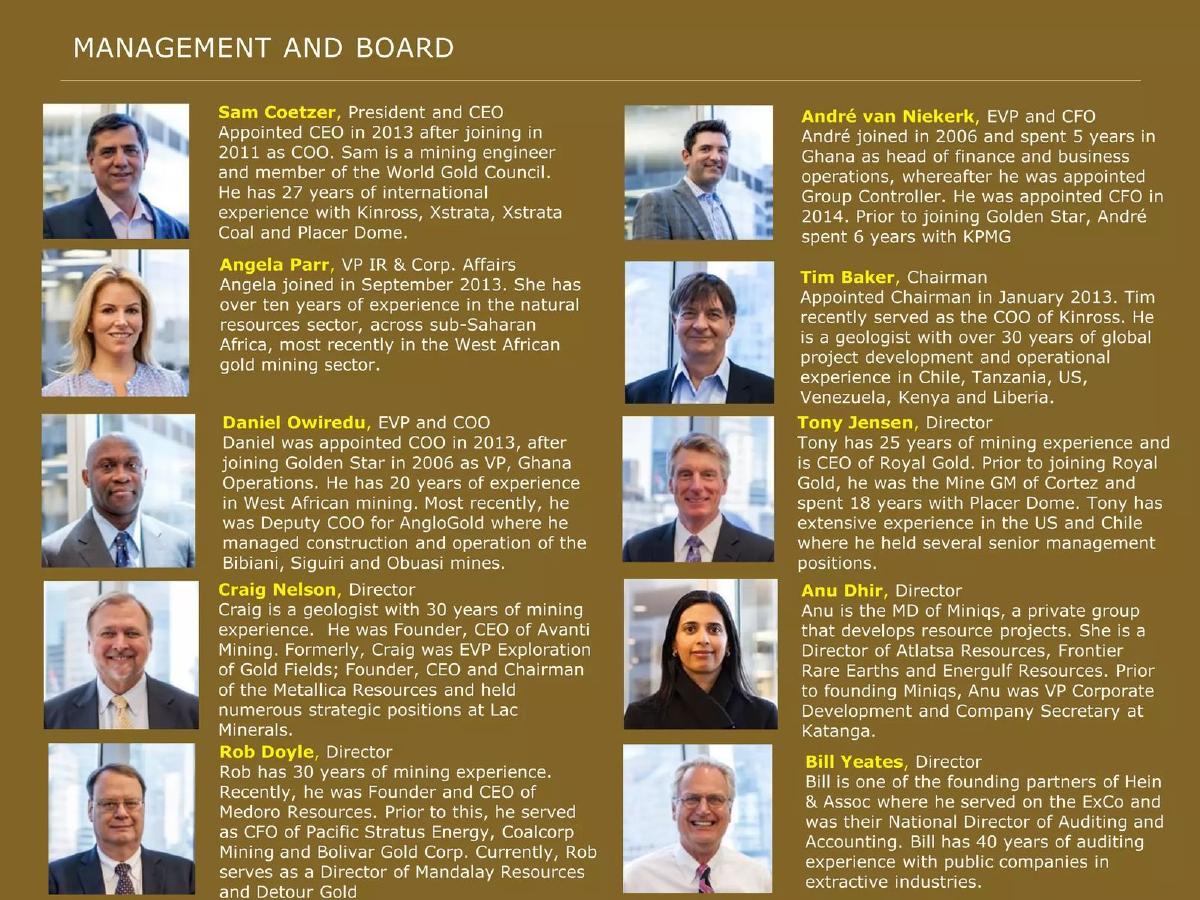
- The leadership team is highly experienced, featuring a CEO with 27 years of mining experience and a Chairman who was formerly the COO of Kinross (Slide 3).
- The investment case relies on 15 years of production history in Ghana and un-hedged exposure to the gold price (Slide 24).
Golden Star Investor Presentation: The Margin-First Mining Strategy
The September 2015 investor presentation for Golden Star represents a classic industrial turnaround narrative. At a time when gold prices were volatile, the company chose to communicate a strategy of 'quality over quantity.' This teardown examines how the company used operational data and geological potential to justify a reduction in total output in favor of higher margins.
Slide 1: Title and Branding
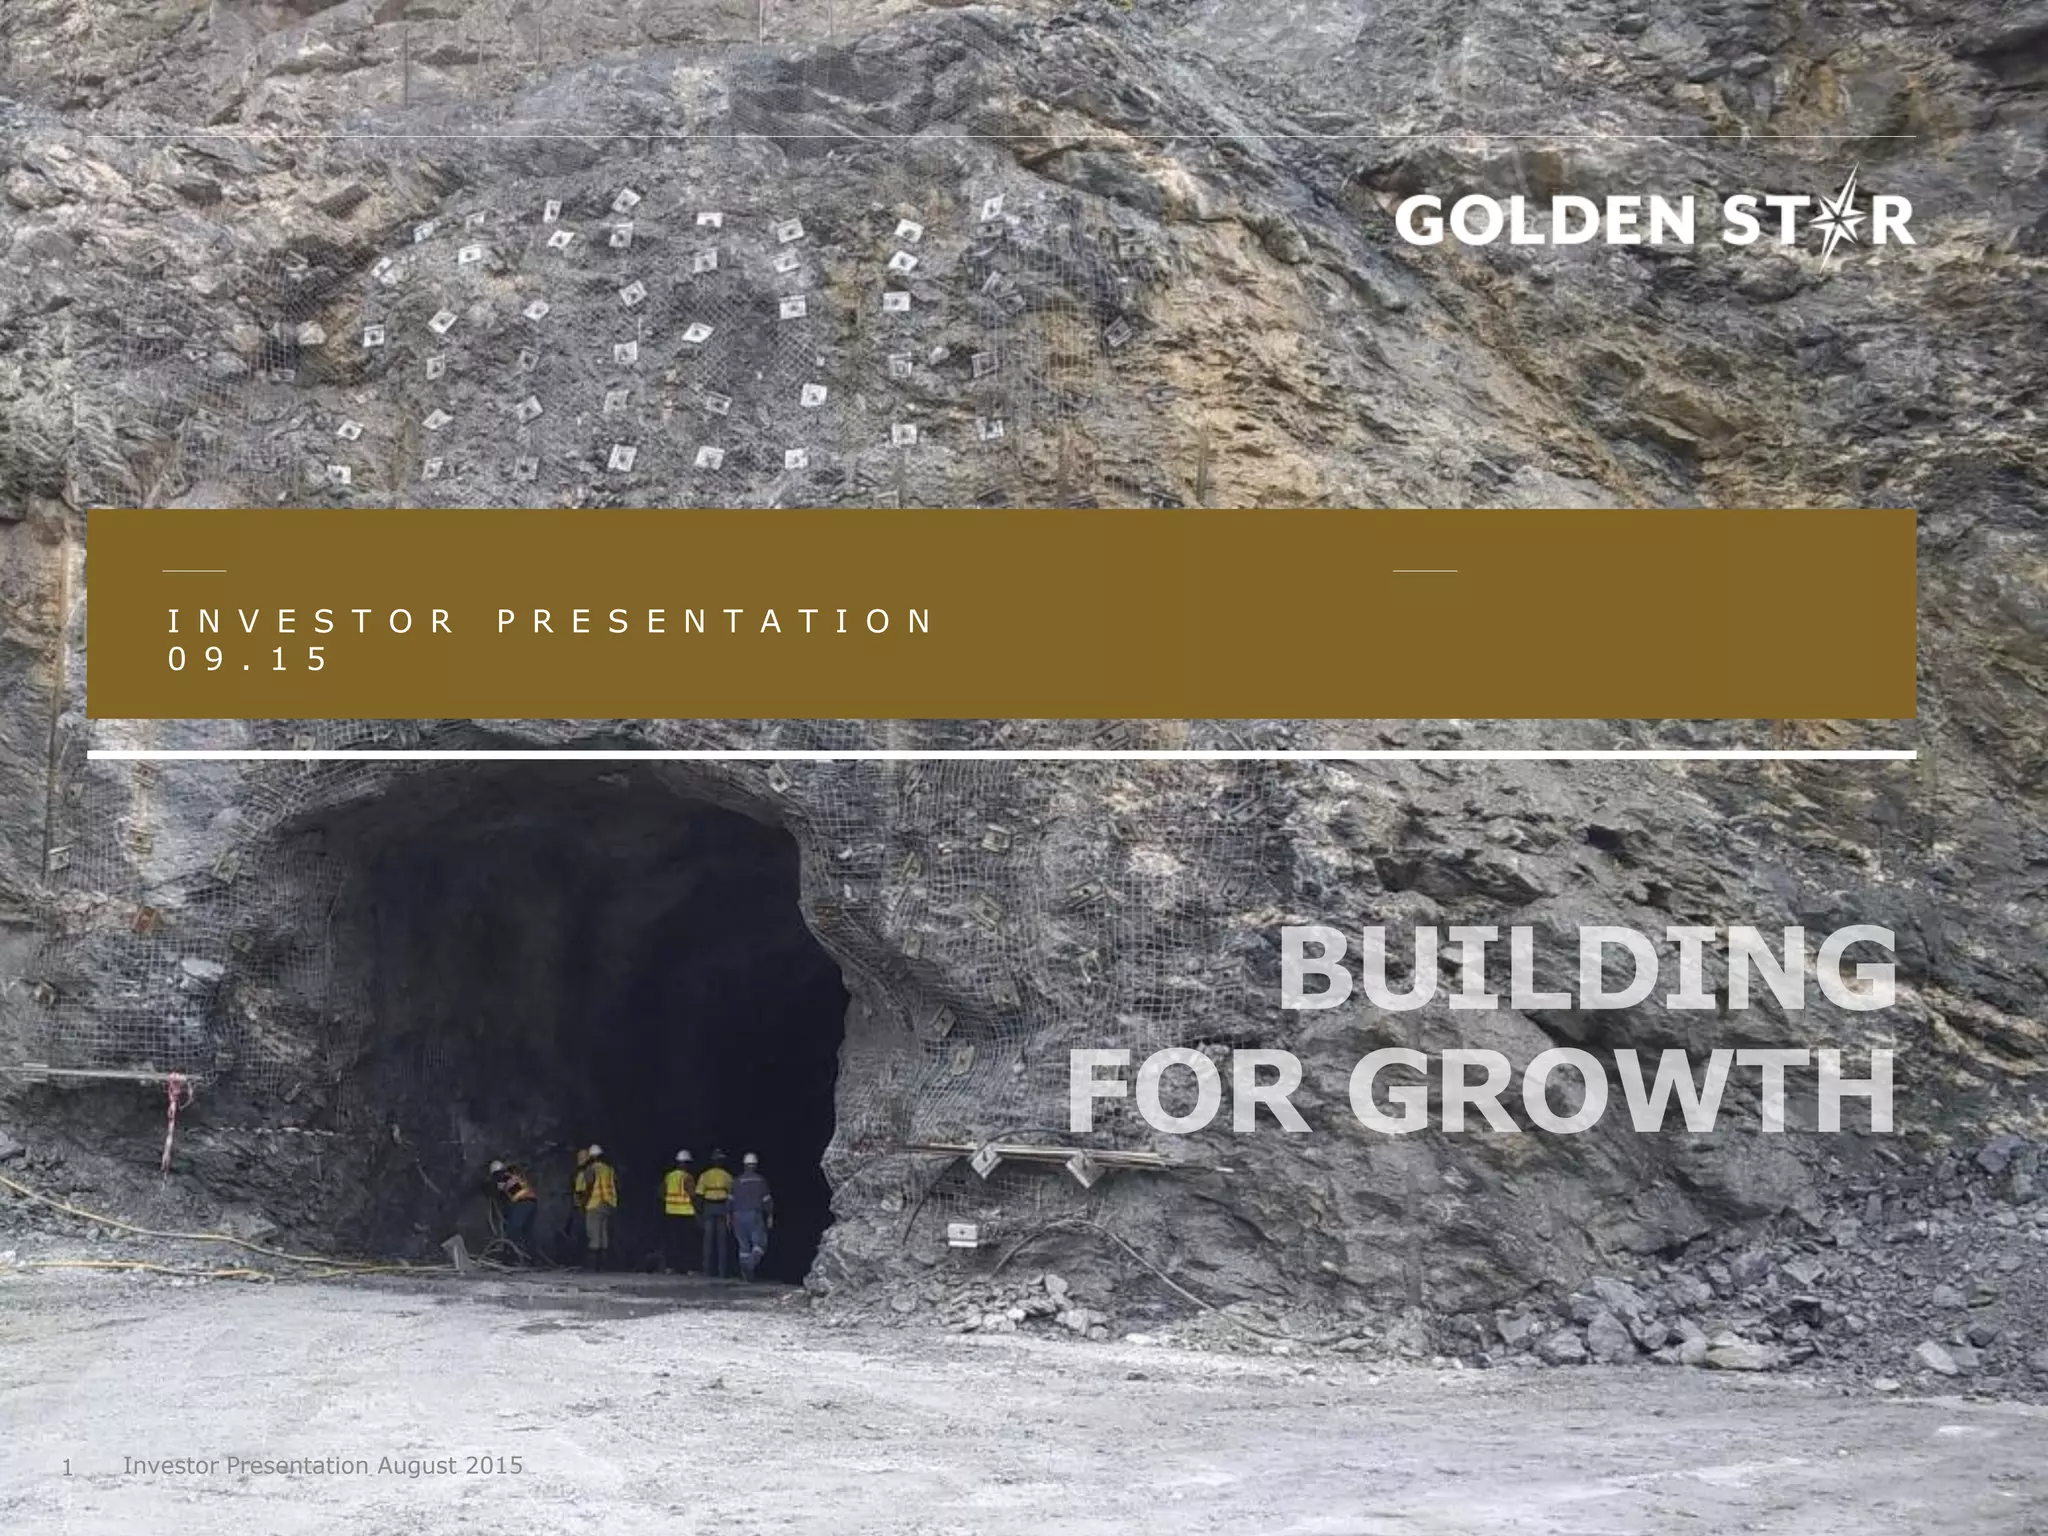
The cover slide establishes the theme: 'Building for Growth.' The background image shows an active underground mine entrance with personnel, signaling that the company is in the execution phase of its development projects rather than just the exploration phase. The date, September 2015, places this deck in a specific market context where cost control was paramount for gold producers.
Slide 3: Management and Board
This is a comprehensive team slide that emphasizes deep industry experience. It lists ten individuals, providing headshots and detailed biographies. Key highlights include CEO Sam Coetzer’s 27 years of experience and Chairman Tim Baker’s previous role as COO of Kinross. The inclusion of directors like Tony Jensen (CEO of Royal Gold) and Bill Yeates (40 years of auditing experience) adds significant institutional weight. For a mining company, where technical execution and capital discipline are the primary risks, this level of detail on the board and management is essential for building investor trust.
Slide 7: Delivering on Strategy
This slide is the intellectual heart of the deck. It outlines four strategic pillars: favoring operating margin over total ounces, leveraging existing infrastructure, reducing costs through behavioral change, and maintaining a disciplined focus on return on capital. The most striking figure is the replacement of 150,000 oz of Bogoso production with 80,000 high-margin Prestea oz. This is a bold admission that the company is shrinking its footprint to increase its profitability. The slide also claims an IRR in excess of 70% on new projects, a high bar that sets expectations for the following technical slides.
Slide 10: Wassa Underground Progress
Slide 10 provides a status report on the Wassa Underground project. It uses a bulleted list over an aerial photo of the mine site to show tangible progress. Key metrics include 106m of decline development and the installation of 4MVA generator capacity. The financial transparency is notable, stating that $3.4M was spent in Q2 with a forecast of $10.8M for H2 2015. By setting a 'First production expected early 2016' deadline, management gives investors a clear milestone to track.
Slide 13: Prestea Underground PEA Results
This slide presents the results of the Preliminary Economic Assessment (PEA) for Prestea. It is divided into 'Investment' and 'Return' columns. The 'Return' side is particularly strong, showing a Cash Operating Cost (COC) of $370 per ounce and an All-In Sustaining Cost (AISC) of $518 per ounce. In the context of 2015 gold prices, these figures represent a very high-margin operation. The $40M initial capex and 2.5-year payback period suggest a relatively low-risk, high-reward entry into production, provided the technical assumptions hold true.
Slide 16: Resource Potential
Mining decks must address the 'life of mine' (LOM) and exploration upside. Slide 16 highlights that Golden Star holds the 'largest land tract' on the Ashanti Gold belt. It details specific geological targets like the B Shoot and F Shoot at Wassa, and the West Reef and Main Reef at Prestea. The mention of 1M oz of Inferred Resources at Wassa and the fact that ore bodies remain 'open down plunge' or 'open down dip' indicates that the current mine plans are likely the floor, not the ceiling, of the company's potential.
Slide 19: Costs and Expenses Tracking Downwards
This slide uses two bar charts to visualize the company's success in cost reduction. The left chart shows mine operating expenses falling from $72.9M in Q2 2014 to $60.2M in Q2 2015. The right chart shows costs per ounce, with a FY 2015 estimate of $1,000-$1,200. The text notes that Bogoso refractory operations impacted unit costs due to lower grades and reduced processing capacity, which further justifies the strategic shift away from those operations mentioned on Slide 7.
Slide 24: Investment Case
The final slide summarizes the value proposition. It emphasizes the company's 15-year history in Ghana, the reduction in operating costs, and the pipeline of low-cost ounces. It also positions the stock as a 'leveraged, un-hedged exposure to the gold price,' which appeals to investors who are bullish on the commodity itself. The mention of 'low political risk in a stable African mining jurisdiction' addresses a common concern for investors in West African operations.
What Golden Star Does Well
Golden Star excels at providing specific, verifiable data. Instead of vague promises of 'efficiency,' they show a $12.7M reduction in quarterly operating expenses (Slide 19). Instead of saying they are 'on track,' they specify exactly how many meters of decline have been developed (Slide 10). This level of granularity is vital in the mining sector, where investors are often wary of 'promotional' decks that lack technical substance.
The strategic clarity is also a major strength. The decision to cut 150,000 ounces of production is counter-intuitive for a growth-oriented company, but by framing it as a shift toward 'high margin' ounces, they turn a production cut into a profitability story. This shows a management team that is responsive to market conditions rather than one that is wedded to legacy assets.
What is Missing from the Deck
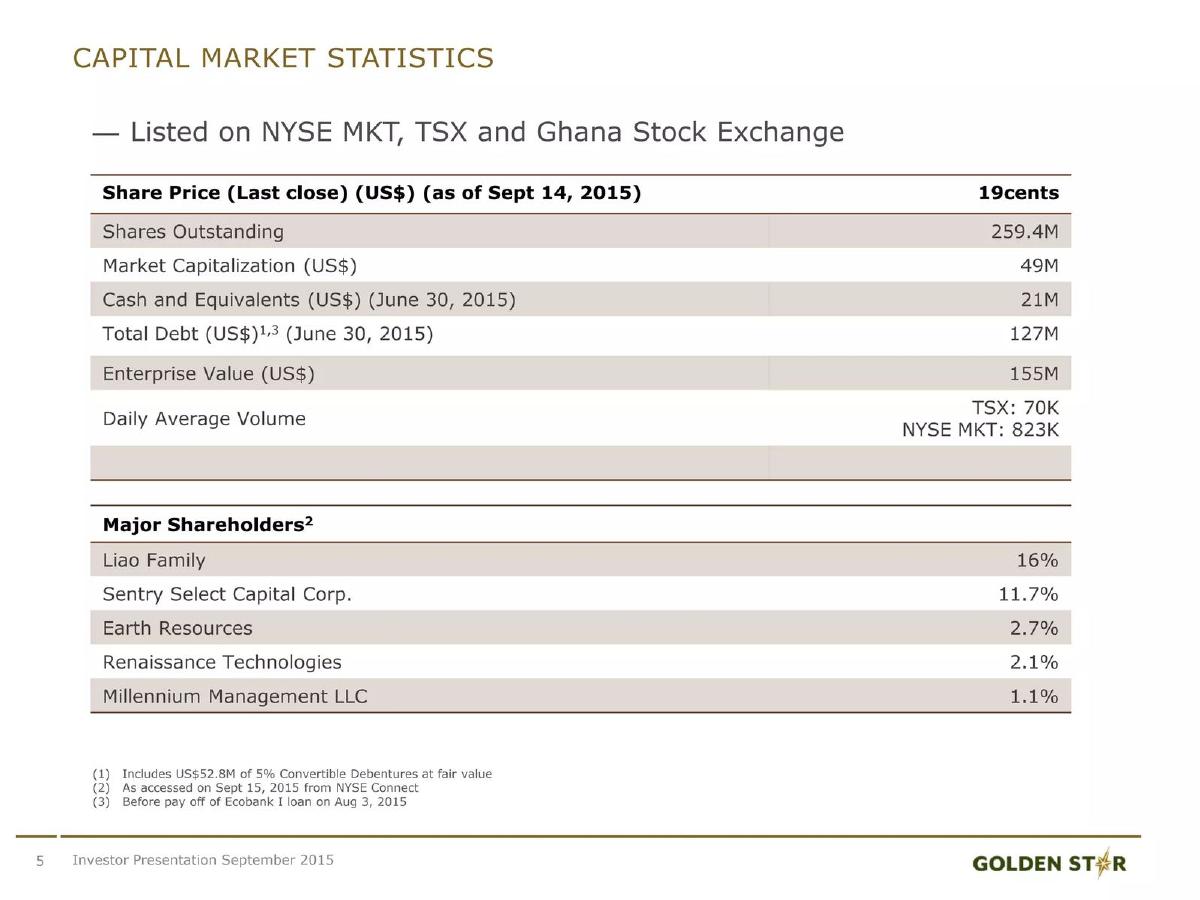
The most significant omission is a clear 'Ask' or financing slide. While Slide 10 mentions a forecast spend of $10.8M for H2 2015, the deck does not explicitly state how this will be funded—whether through existing cash reserves, operational cash flow, or a new capital raise. For an investor presentation, understanding the capital structure and potential dilution is critical.
Furthermore, while the deck mentions 'low political risk' in Ghana (Slide 24), it lacks a dedicated ESG (Environmental, Social, and Governance) slide. In modern mining, social license to operate and environmental compliance are as important as geological reserves. While this was less of a standard in 2015 than it is today, a brief overview of their community relations or environmental reclamation efforts would have strengthened the 'stable jurisdiction' argument.
Summary for Founders
Founders in capital-intensive industries can learn a lot from Golden Star’s approach to data. If you are undergoing a pivot, do not hide the parts of the business you are moving away from. Instead, follow Golden Star’s lead on Slide 7: explicitly state what you are replacing and why the new model offers better margins or returns. Use technical milestones (like the decline development on Slide 10) to prove that you are executing on your timeline. Finally, ensure your management slide (Slide 3) does more than just list titles; it should demonstrate a collective history of success in the specific challenges your company faces.
Frequently asked questions
- What is the core strategic shift identified in the deck?
- Golden Star is moving away from high-volume, high-cost refractory gold production. As stated on Slide 7, they are replacing 150,000 ounces of Bogoso production with 80,000 ounces of high-margin Prestea production. This indicates a focus on profitability and return on capital rather than just scale, which is a common pivot for mining companies facing low commodity prices.
- What are the projected economics for the Prestea Underground project?
- According to Slide 13, the Prestea Underground project has very attractive economics based on a $1,200 gold price assumption. It features an All-In Sustaining Cost (AISC) of $518 per ounce, an IRR of 72%, and a Net Present Value (NPV) at a 5% discount rate of $121M. The payback period is estimated at 2.5 years.
- How is the company performing regarding cost management?
- The company is successfully reducing its cost base. Slide 19 shows that mine operating expenses decreased from $72.9M in Q2 2014 to $60.2M in Q2 2015. Additionally, the Group cash operating costs per ounce for FY 2015 were revised to a range of $955-$1,050, reflecting a disciplined focus on operational efficiency.
- What is the status of the Wassa Underground development?
- Slide 10 reports that Wassa Underground is progressing to schedule. Key milestones include the first blast of the decline in July 2015, 106m of decline development completed, and the installation of 4MVA generator capacity. The company expects early production to begin in early 2016, with $10.8M in forecast spending for H2 2015.
- What makes the management team credible for this turnaround?
- Slide 3 highlights a team with deep institutional knowledge and industry experience. CEO Sam Coetzer has 27 years of experience with majors like Kinross and Xstrata. Chairman Tim Baker was the former COO of Kinross. The board includes individuals with 20 to 40 years of experience in mining, geology, and extractive industry auditing, providing strong oversight for the strategic pivot.