Potash Ridge’s 2017 investor presentation outlines a clear path toward dominating the North American Potassium Sulphate (SOP) market. The company leverages two distinct assets: the Valleyfield project in Quebec, utilizing the Mannheim process, and the Blawn Mountain project in Utah, a large-scale mining operation. With a total of $46.15 million raised by early 2017, the deck emphasizes high-margin potential ($450/tonne at Valleyfield) and massive reserves (45+ years at Blawn Mountain). However, the presentation also reveals the immense capital hurdles common in the mining sector, with Blawn M…
Key takeaways
- The company aims to address a significant supply-demand gap, noting North American production is only 400k tonnes against a 1M tonne demand (Slide 4).
- Valleyfield is positioned as a near-term producer with a 9-12 month build time and a targeted production start in H1 2018 (Slide 13).
- Blawn Mountain represents a massive long-term asset with over 100 years of potential potash production and 45+ years of established reserves (Slide 19).
- The economic projections for Valleyfield show a 30% after-tax IRR and an $82 million NPV at a 10% discount rate (Slide 13).
- Capital requirements are heavy, particularly for Blawn Mountain, which carries a projected $458 million capex (Slide 4).
- The company has a complex capital history, having raised $46.15 million through various rounds between 2011 and 2017 (Slide 25).
- Potash Ridge is publicly traded on the TSX under the symbol PRK, with a market cap of $31 million as of February 13, 2017 (Slide 25).
- Strategic partnerships are highlighted, including a collaboration with Migao Corp. to leverage their 20-year Mannheim process experience (Slide 16).
Investor Presentation Analysis: Potash Ridge
The Potash Ridge investor presentation from February 2017 is a technical, data-heavy deck designed for institutional investors and mining specialists. It focuses on the economic viability of two distinct projects aimed at capturing the North American Potassium Sulphate (SOP) market. The presentation is structured to move from the macro market opportunity to specific project economics and finally to the company's capital structure.
Slide 1: Title Slide
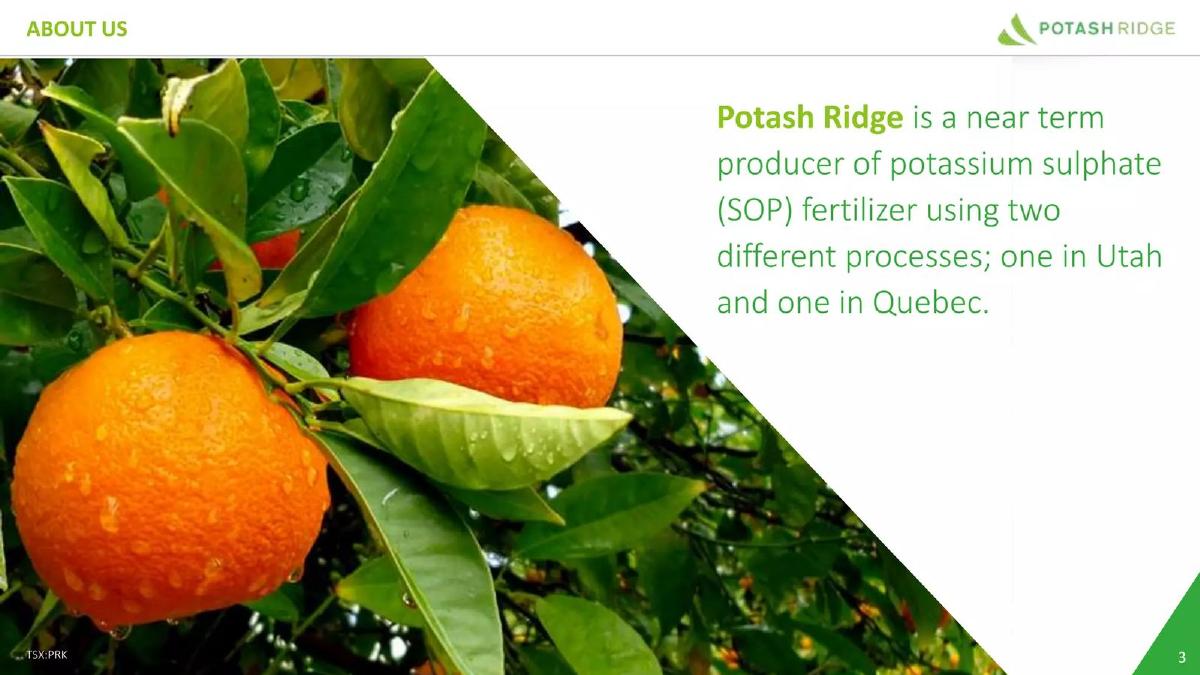
The cover slide features high-quality imagery of an orchard, immediately signaling the end-market for the company's product: high-value agriculture. It establishes the brand identity with a clean green-and-white color palette and clearly states the date as February 2017. The inclusion of the company logo and a professional layout sets a serious tone for the technical details to follow.
Slide 4: Vision and Strategy Overview
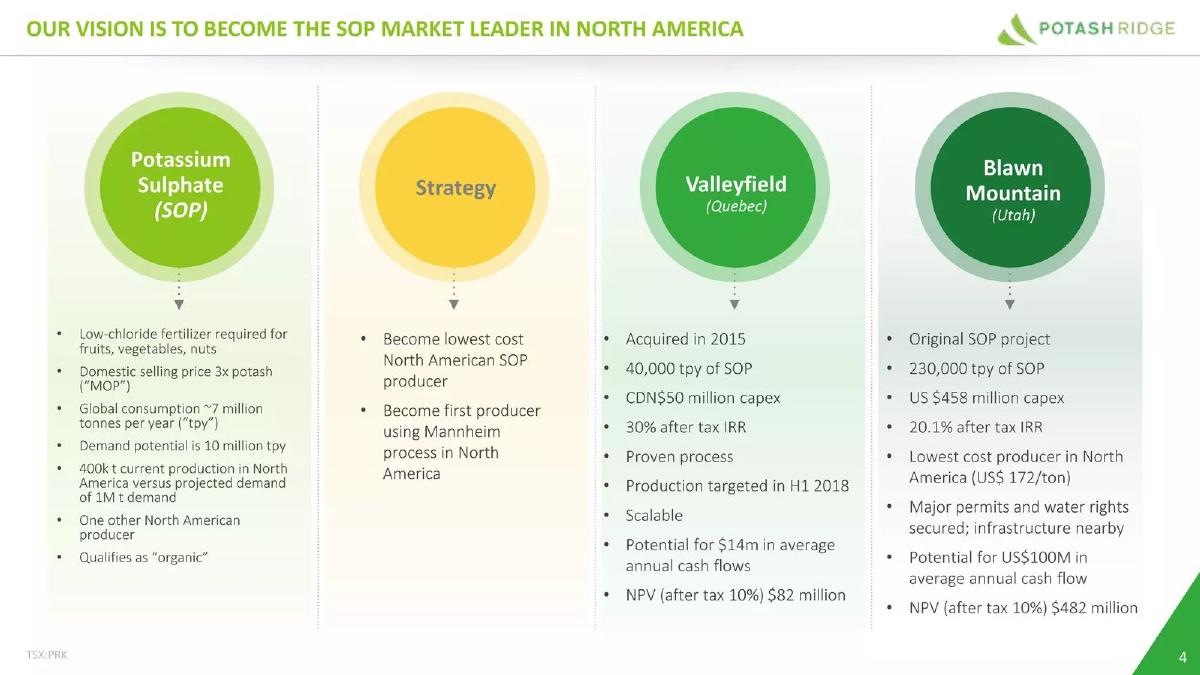
This slide serves as the executive summary. It defines the company's vision: to become the SOP market leader in North America. It breaks the business down into four pillars: the product (SOP), the strategy, and the two primary projects (Valleyfield and Blawn Mountain). Key figures include a global SOP consumption of ~7 million tonnes per year and a domestic selling price 3x that of standard potash (MOP). The strategy is explicitly stated as becoming the lowest-cost producer in North America using the Mannheim process. This slide is effective because it provides a side-by-side comparison of the two projects, showing the near-term cash flow potential of Valleyfield ($14m average annual) versus the massive scale of Blawn Mountain ($100m average annual).
Slide 7: The Problem - Chloride Damage
Using visual evidence, this slide illustrates the 'pain point' for farmers. It shows peach and grape leaves suffering from salt (chloride) damage. This justifies the premium price of SOP over MOP; because SOP is low-chloride, it is required for sensitive, high-value crops. By showing the physical damage caused by inferior fertilizers, the company builds a technical case for the necessity of its product.
Slide 10: Market Opportunity - North America is Underserved
This bar chart compares current production, existing consumption, and estimated demand across five global regions. In North America, the gap is stark: estimated demand is nearly double the current production. The slide reinforces the 'buy' signal by showing that while Asia is a massive market, North America offers a significant domestic supply deficit that Potash Ridge is positioned to fill. The data is attributed to 'Green Markets, Northern Shoreline, company reports,' providing third-party credibility to the demand projections.
Slide 13: Valleyfield Project (Quebec) Economics
This slide focuses on the 'Phase 1' economic summary for the Quebec project. It lists several strategic advantages, including a short 9-12 month build time and established infrastructure. The right-hand table provides the hard numbers: an initial capital cost of $50.0 million CAD, a 30% unlevered after-tax IRR, and a margin of $450 per tonne. The inclusion of the 'Net of acid credit' footnote for the $370/tonne Opex shows a level of detail expected by sophisticated investors who understand the chemistry of the Mannheim process.
Slide 16: Valleyfield Milestones
A horizontal timeline breaks down the path to production into six steps. It shows that as of Q1 2017, engineering and permitting were underway. Crucially, it mentions a partnership with Migao Corp. to leverage 20 years of Mannheim process experience , which mitigates execution risk. The timeline targets 'Ramp up to full production' in H1 2018. This slide is vital for investors to track progress and understand the immediate funding requirements for construction, which was slated to break ground in Q2 2017.
Slide 19: Blawn Mountain Project (Utah) Overview
Shifting to the larger Utah asset, this slide uses a topographical map and a site photograph to ground the project in reality. It emphasizes the longevity of the asset, citing 45+ years of established reserves and over 100 years of potential production. It also highlights the favorable regulatory environment, noting Utah is ranked the #2 state for business and that the land is 100% state-owned, which typically simplifies permitting compared to federal land.
Slide 22: Blawn Mountain Development Timeline
This slide provides a historical perspective, showing that the project has been in development since the late 1970s, with $25 million already invested before Potash Ridge's involvement. It tracks the progress from the 2011 acquisition through the 2012 IPO ($80M market cap) to the January 2017 updated Pre-Feasibility Study (PFS) showing reduced capex. This long history is intended to show that the project is 'de-risked' and has survived multiple cycles of scrutiny.
Slide 25: Capital Structure
The final slide in this selection provides a transparent look at the company's finances. A donut chart shows 162.2 million total fully diluted shares. A detailed 'Capital Raises' table lists every funding event from February 2011 to January 2017, totaling $46.15 million. The market figures section shows a share price of $0.25 and a market cap of $31 million as of the presentation date. This level of transparency regarding dilution and historical pricing is excellent for building trust with potential new investors.
What Potash Ridge Does Well
The deck is exceptionally strong in its technical and economic disclosures. By providing specific IRR, NPV, and Opex/tonne figures, the company allows investors to run their own models. The clear distinction between the two projects—one as a near-term 'quick win' (Valleyfield) and one as a 'generational asset' (Blawn Mountain)—provides a balanced investment thesis. The use of third-party rankings (Forbes, Fraser Institute) and specific partner names (Migao Corp, Jones Hamilton) adds significant weight to their claims of operational readiness.
What is Missing from the Deck
While the deck is thorough, a few key elements are missing from these nine slides. There is no dedicated 'Team' slide in this selection, which is a major omission for a project requiring such specialized engineering and mining expertise. Additionally, while the $458 million capex for Blawn Mountain is mentioned on Slide 4, there is no detailed breakdown of how that massive sum will be raised, other than a vague mention of 'debt and equity negotiations' on Slide 16. The deck also lacks a clear 'Competitor Analysis' beyond a brief mention that only one other producer exists; identifying that producer and their market share would have strengthened the competitive positioning.
Lessons for Founders
Quantify the Margin: Potash Ridge doesn't just say they are profitable; they show a $450/tonne margin and explain exactly how they get there (Slide 13). Founders should always break down their unit economics to this level of detail. · Visualizing the Problem: The use of actual photos of damaged crops (Slide 7) is much more impactful than a bullet point saying 'chloride is bad.' Use visual evidence to prove your market need. · Transparency in Capital History: The 'Capital Raises' table on Slide 25 is a masterclass in transparency. It shows the price at every round, including down rounds or flat rounds. This honesty prevents surprises during due diligence. · Market Gap Analysis: The bar chart on Slide 10 is a perfect way to show regional demand vs. supply. If you are entering a market, show exactly where the 'underserved' gap lies geographically or demographically. · De-Risking Through History: By showing the project's timeline back to the 1970s (Slide 22), the company proves this isn't a 'fly-by-night' operation. For founders, showing the history of your R&D or previous iterations can build similar credibility.
Frequently asked questions
- What is the primary product Potash Ridge intends to produce?
- The company focuses on Potassium Sulphate (SOP), a low-chloride fertilizer essential for high-value crops like fruits, vegetables, and nuts. Slide 4 notes that SOP sells for three times the price of standard potash (MOP) and qualifies as 'organic,' making it a premium product in the agricultural market.
- How does the Valleyfield project differ from Blawn Mountain?
- Valleyfield is a processing-focused project in Quebec using the Mannheim process with a $50 million CAD capex and a quick 9-12 month build time. Blawn Mountain in Utah is a large-scale mining project with a much higher $458 million USD capex but significantly larger reserves and annual cash flow potential of $100 million.
- What is the current status of the company's financing as of this deck?
- As of February 13, 2017, the company had raised a total of $46.15 million. The most recent raise at the time was a $3.4 million convertible debenture in January 2017. The deck indicates that debt and equity negotiations for Valleyfield were ongoing at that time (Slide 16).
- What are the key risks associated with these projects?
- While not explicitly listed in a 'Risk' slide in this selection, the data points to high capital intensity and permitting requirements. Blawn Mountain requires $458 million to reach production, and Valleyfield relies on securing long-term supply for sulphuric acid and offtake for hydrochloric acid by-products to maintain its $450/tonne margin.
- Who are the competitors in the North American SOP market?
- Slide 4 states there is only 'one other North American producer' currently active. The deck emphasizes that North America is underserved, producing only 400,000 tonnes per year against a projected demand of 1 million tonnes, providing a clear competitive opening for Potash Ridge.