Repeat Purchase Rate on a Pitch Deck: Define It Before You
How consumer and marketplace founders present repeat purchase rate: which customers, over what window, share of customers or of orders.
How to Show Repeat Purchase Rate on Your Pitch Deck: Denominator, Window and Comparison
Twelve slides from real pitch decks that report repeat purchases. We record what each slide states, what a reader can work out from it, and what it leaves undefined.
TL;DR
"Repeat purchase rate" is not one metric. It can mean the share of customers who bought again, the share of orders or revenue that came from returning customers, or the share of users active again in a month. Each can be measured over 30 days, a year or all time. A percentage on a slide becomes evidence when the slide says which of these it is, over what window, for which customers, and what a reader should compare it with. In the twelve slides below, Abbeypost comes closest on the window ("repeat purchase within 30 days") and Kredivo shows most plainly why the definition matters: its comparison table puts three different definitions side by side under one heading.
The most common gaps are a bare percentage with no window or denominator (43 Layers, Three Ships, Kitterly, Bravo Sierra), a share of orders read as if it were a share of customers (Unfabled), a forecast split between new and repeat revenue presented next to real figures (Organic Dried Food), and a claim of proof attached to one number (Abbeypost's "proves that we nailed the product"). Each is fixable with data an online store already records.
Repeat purchase slides from real pitch decks
Each example shows the exact page from the original public deck above its analysis and links to the full teardown. Figures are the companies' own and have not been verified. Page numbers are PDF pages.
Abbeypost traction slide — slide 7
Size-inclusive women's clothing brand. "Happy Customers" slide in an 11-page deck.
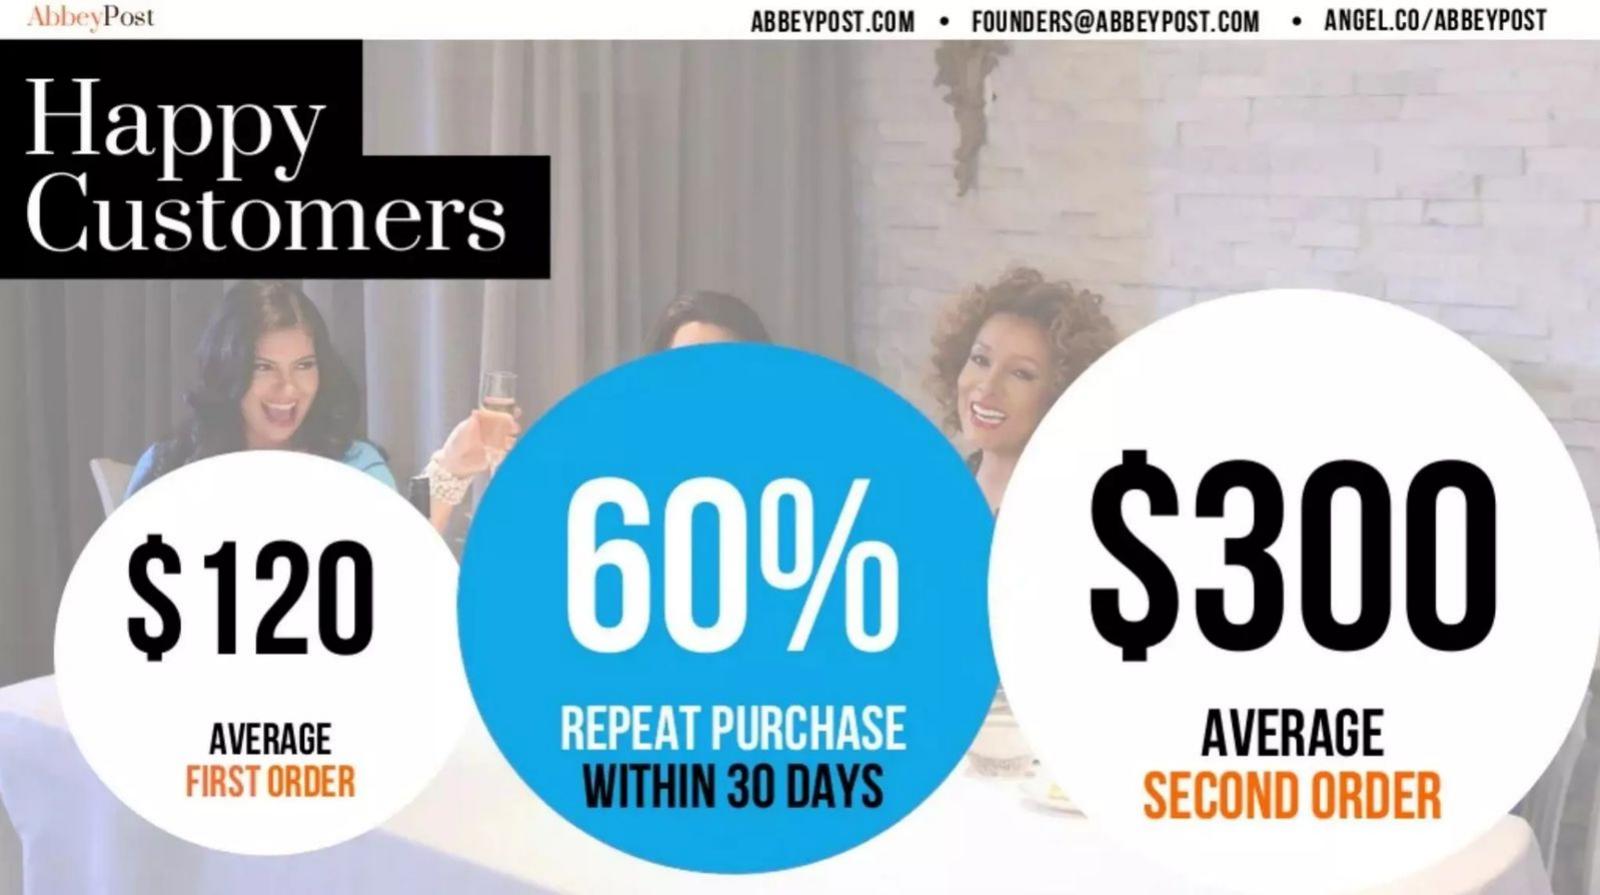
Abbeypost deck, slide 7. Exact stored slide matched to this analysis.
Our analysis: It is the only slide in this set to put a window on the rate, and it pairs the rate with first and second order values, so a reader can see both how many return and what a return is worth.
Evidence and limitation: The base is not stated, and slide 10 calls the rate proof. By our calculation the second order is 2.5 times the first, but the $300 describes only the customers who returned.
What a founder can adapt: Keep the window on the rate and add the number of first-time customers it was measured on.
Supporting analysis
What the deck claims: Three circles: "$120 average first order", "60% repeat purchase within 30 days", "$300 average second order". A later slide (10) repeats the rate as "Our 60% repeat purchase rate proves that we nailed the product."
Presentation choice: It is the only slide in this set to put a window on the rate, and it pairs the rate with first and second order values, so a reader can see both how many return and what a return is worth.
When it does not fit: The base is not stated, and slide 10 calls the rate proof. By our calculation the second order is 2.5 times the first, but the $300 describes only the customers who returned.
Online marketplace. "Metrics" slide in a 10-page deck.
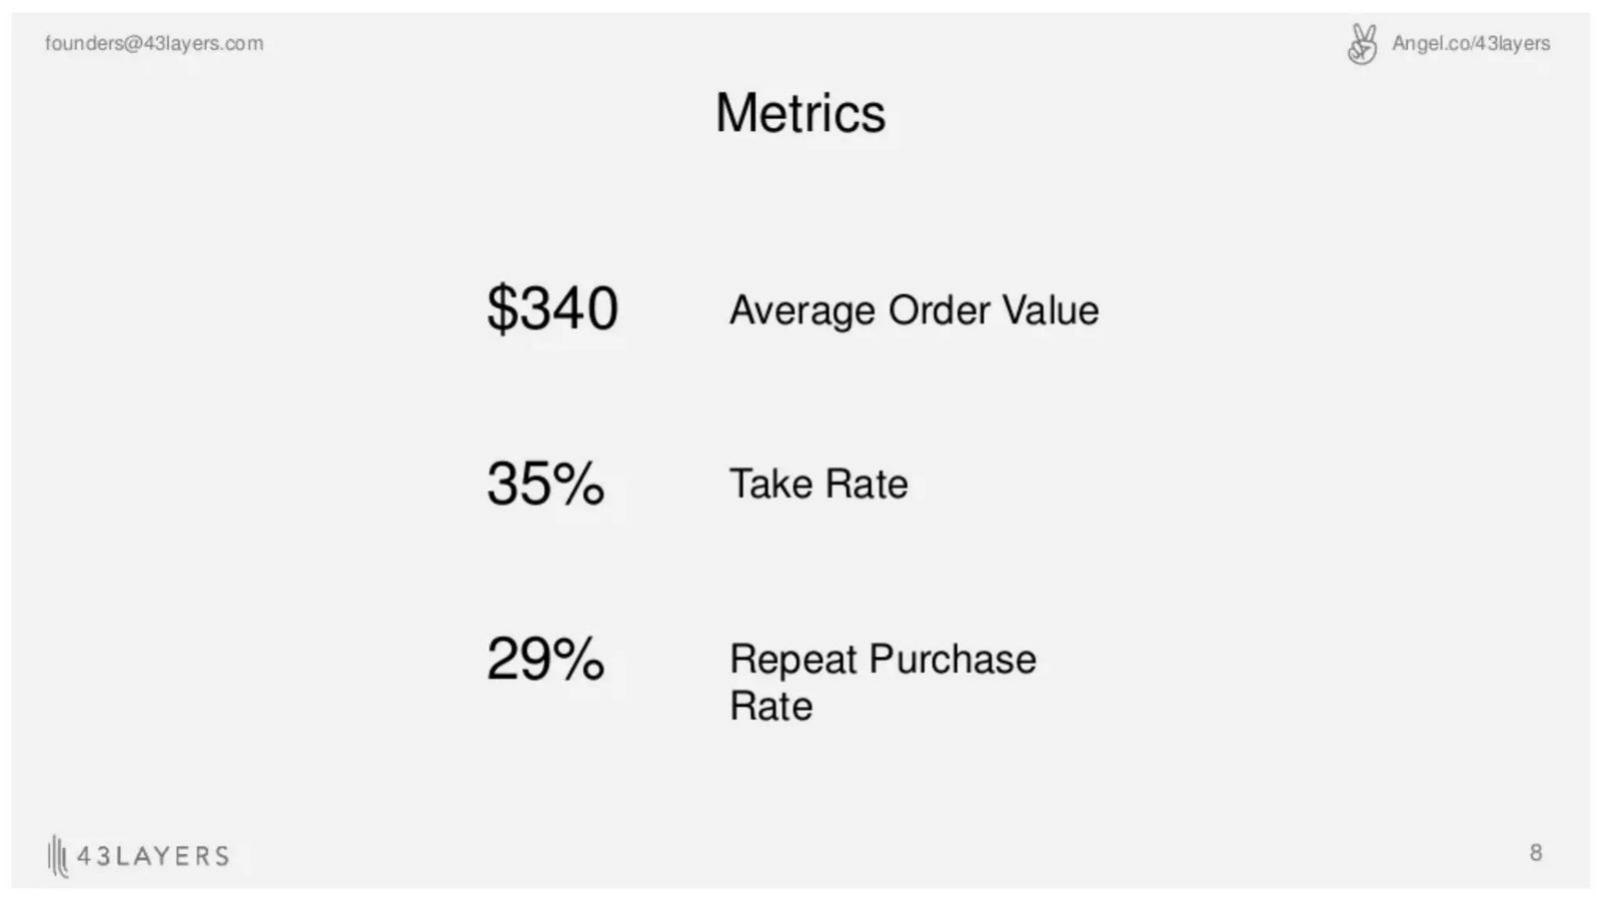
43 Layers deck, slide 8. Exact stored slide matched to this analysis.
Our analysis: Putting the repeat rate beside order value and take rate lets a reader start to estimate revenue per returning buyer, which is the right instinct.
Evidence and limitation: With no window, base or period, 29% cannot be compared with anything, including the company's own later figure.
What a founder can adapt: Add the window and whether 29% is a share of buyers or of orders.
Supporting analysis
What the deck claims: Three figures: "$340 Average Order Value", "35% Take Rate", "29% Repeat Purchase Rate".
Presentation choice: Putting the repeat rate beside order value and take rate lets a reader start to estimate revenue per returning buyer, which is the right instinct.
When it does not fit: With no window, base or period, 29% cannot be compared with anything, including the company's own later figure.
Online retailer. "Repeat" slide in a 10-page deck.
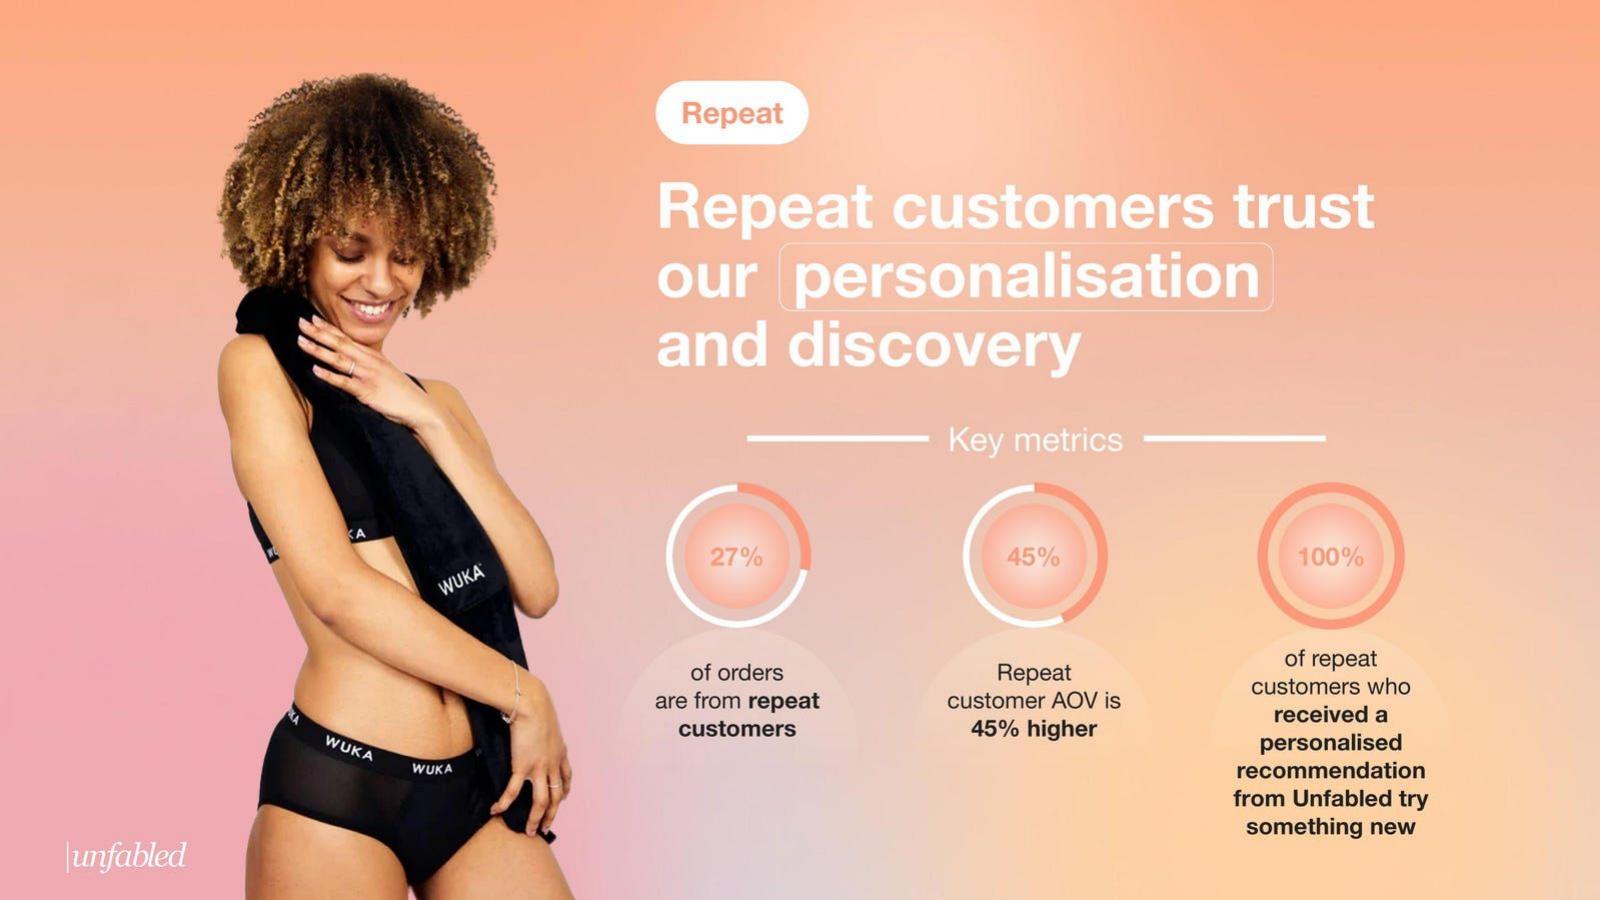
Unfabled deck, slide 6. Exact stored slide matched to this analysis.
Our analysis: It states the unit exactly: a share of orders, not of customers. That precision is rarer than it should be.
Evidence and limitation: The window is not stated, the 45% has no named baseline, and "100% of repeat customers who received a personalised recommendation" gives no count of how many received one.
What a founder can adapt: If you report a share of orders, give the share of customers who returned alongside it.
Supporting analysis
What the deck claims: "Repeat customers trust our personalisation and discovery." Key metrics: "27% of orders are from repeat customers"; "Repeat customer AOV is 45% higher"; "100% of repeat customers who received a personalised recommendation from Unfabled try something new".
Presentation choice: It states the unit exactly: a share of orders, not of customers. That precision is rarer than it should be.
When it does not fit: The window is not stated, the 45% has no named baseline, and "100% of repeat customers who received a personalised recommendation" gives no count of how many received one.
Indonesian buy-now-pay-later lender. Comparison table in a 50-page deck.
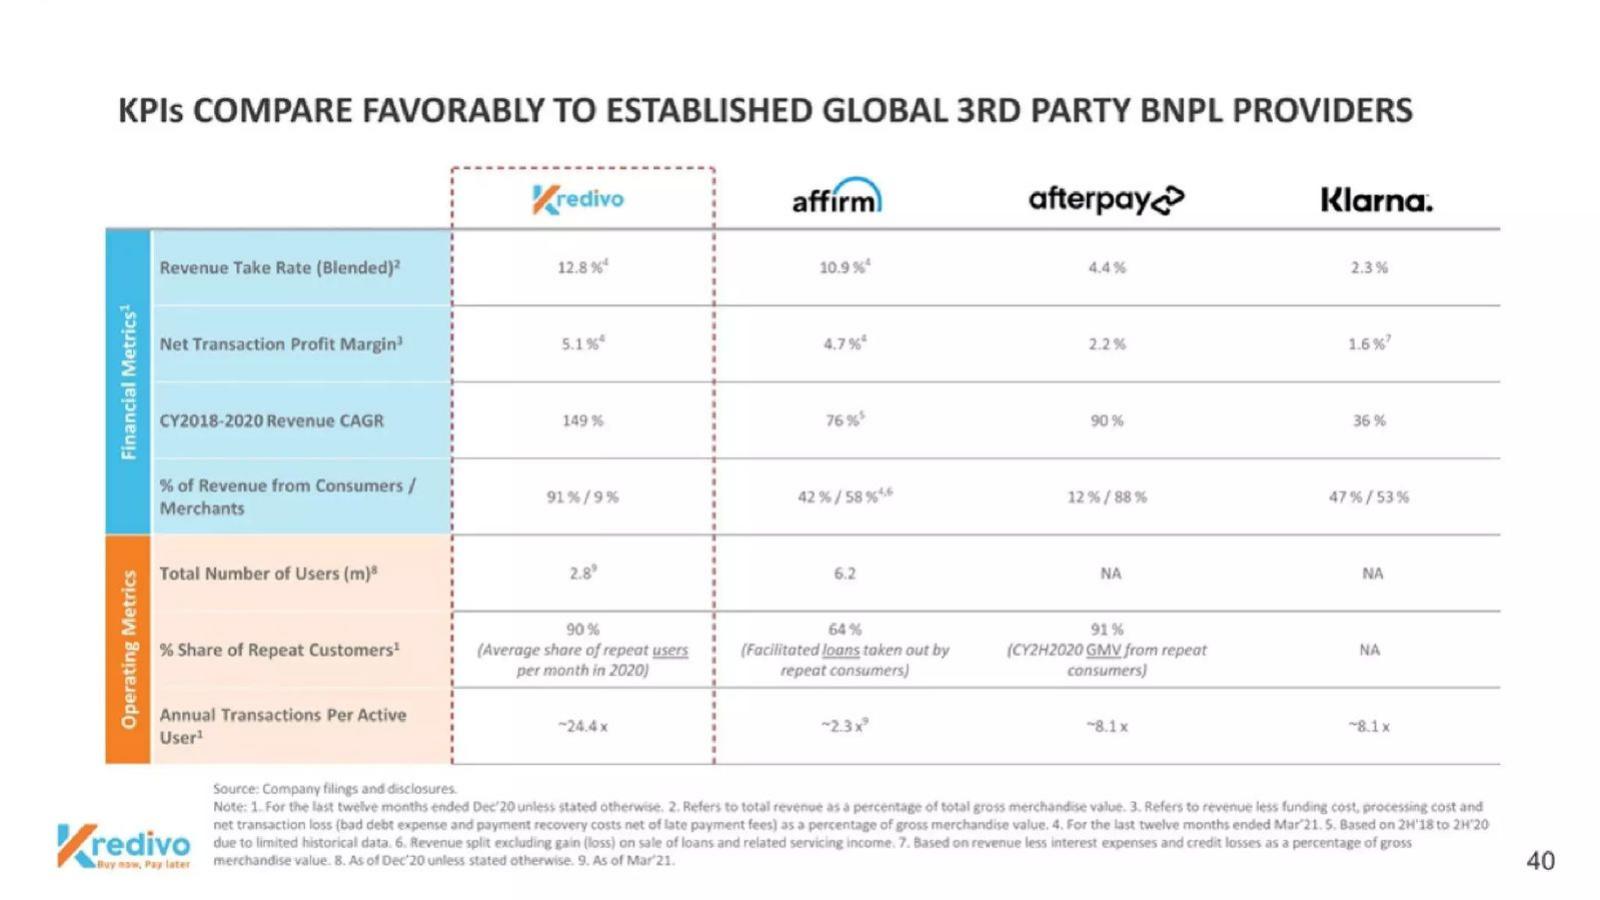
Kredivo deck, slide 40. Exact stored slide matched to this analysis.
Our analysis: The footnotes state each definition, so an attentive reader can see that the row mixes a share of users, a share of loans and a share of transaction value.
Evidence and limitation: Placing three different definitions in one row under one heading implies a comparison the numbers do not support.
What a founder can adapt: When comparing with peers, use only figures measured the same way, or say plainly that the definitions differ.
Supporting analysis
What the deck claims: "KPIs compare favorably to established global 3rd party BNPL providers." Row "% Share of Repeat Customers": Kredivo 90% ("average share of repeat users per month in 2020"), Affirm 64% ("facilitated loans taken out by repeat consumers"), Afterpay 91% ("CY2H2020 GMV from repeat consumers"), Klarna "NA". Sources: "Company filings and disclosures."
Presentation choice: The footnotes state each definition, so an attentive reader can see that the row mixes a share of users, a share of loans and a share of transaction value.
When it does not fit: Placing three different definitions in one row under one heading implies a comparison the numbers do not support.
Personal-care brand. Community slide in a 16-page deck.
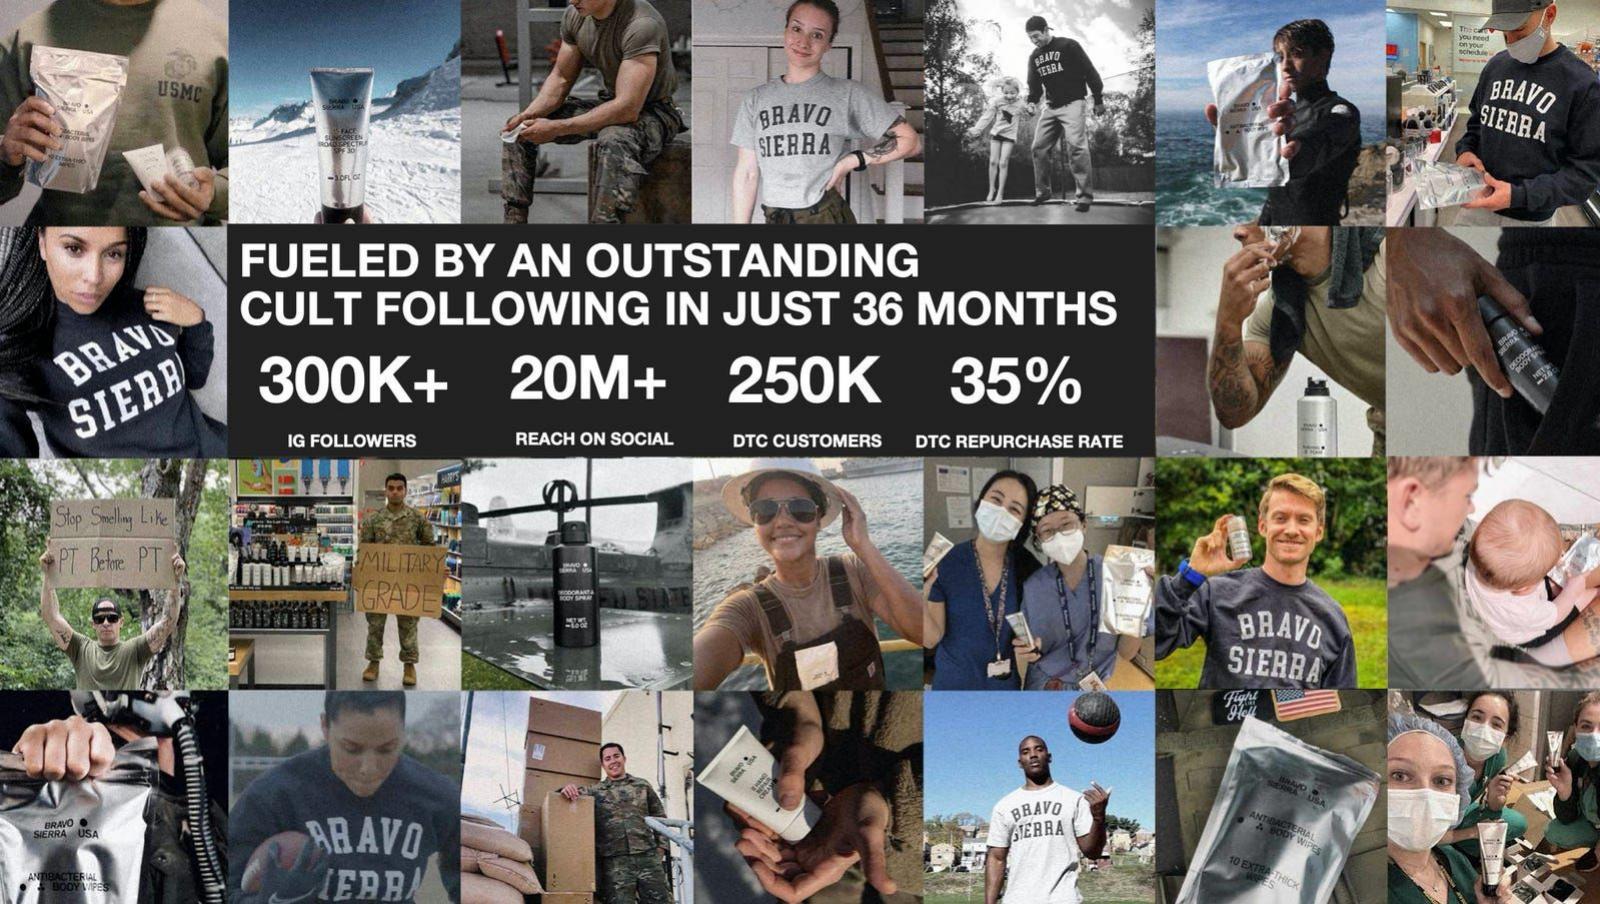
Bravo Sierra deck, slide 13. Exact stored slide matched to this analysis.
Our analysis: It names the channel measured (direct-to-consumer) and gives the customer count the rate applies to.
Evidence and limitation: The 35% has no window, and it sits among audience figures (followers, reach) that measure attention, not purchases.
What a founder can adapt: Keep the channel label and add the window: repurchase within what period of a first order?
Supporting analysis
What the deck claims: "Fueled by an outstanding cult following in just 36 months": "300K+ IG followers", "20M+ reach on social", "250K DTC customers", "35% DTC repurchase rate".
Presentation choice: It names the channel measured (direct-to-consumer) and gives the customer count the rate applies to.
When it does not fit: The 35% has no window, and it sits among audience figures (followers, reach) that measure attention, not purchases.
Ready-to-drink protein coffee. Loyalty slide in a 34-page deck.
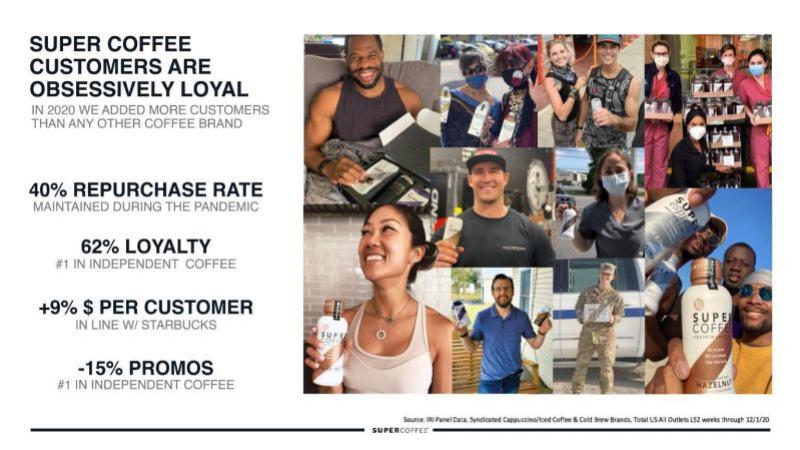
Kitu (Super Coffee) deck, slide 10. Exact stored slide matched to this analysis.
Our analysis: It names an outside data source, category and period, so a reader knows the figures are a retail panel's measure over 52 weeks rather than the company's own records.
Evidence and limitation: "62% loyalty" is not defined, and "maintained" implies an earlier figure the slide does not give.
What a founder can adapt: Cite outside data this precisely, and say which figure each part of the source supports.
Supporting analysis
What the deck claims: "Super Coffee customers are obsessively loyal. In 2020 we added more customers than any other coffee brand." "40% repurchase rate maintained during the pandemic"; "62% loyalty #1 in independent coffee"; "+9% $ per customer in line w/ Starbucks"; "-15% promos #1 in independent coffee". Footer: "Source: IRI Panel Data, Syndicated Cappuccino/Iced Coffee & Cold Brew Brands, Total US All Outlets L52 weeks through 12/1/20."
Presentation choice: It names an outside data source, category and period, so a reader knows the figures are a retail panel's measure over 52 weeks rather than the company's own records.
When it does not fit: "62% loyalty" is not defined, and "maintained" implies an earlier figure the slide does not give.
Stackable cookware with a removable handle. Growth and manufacturing slide in a 19-page deck.
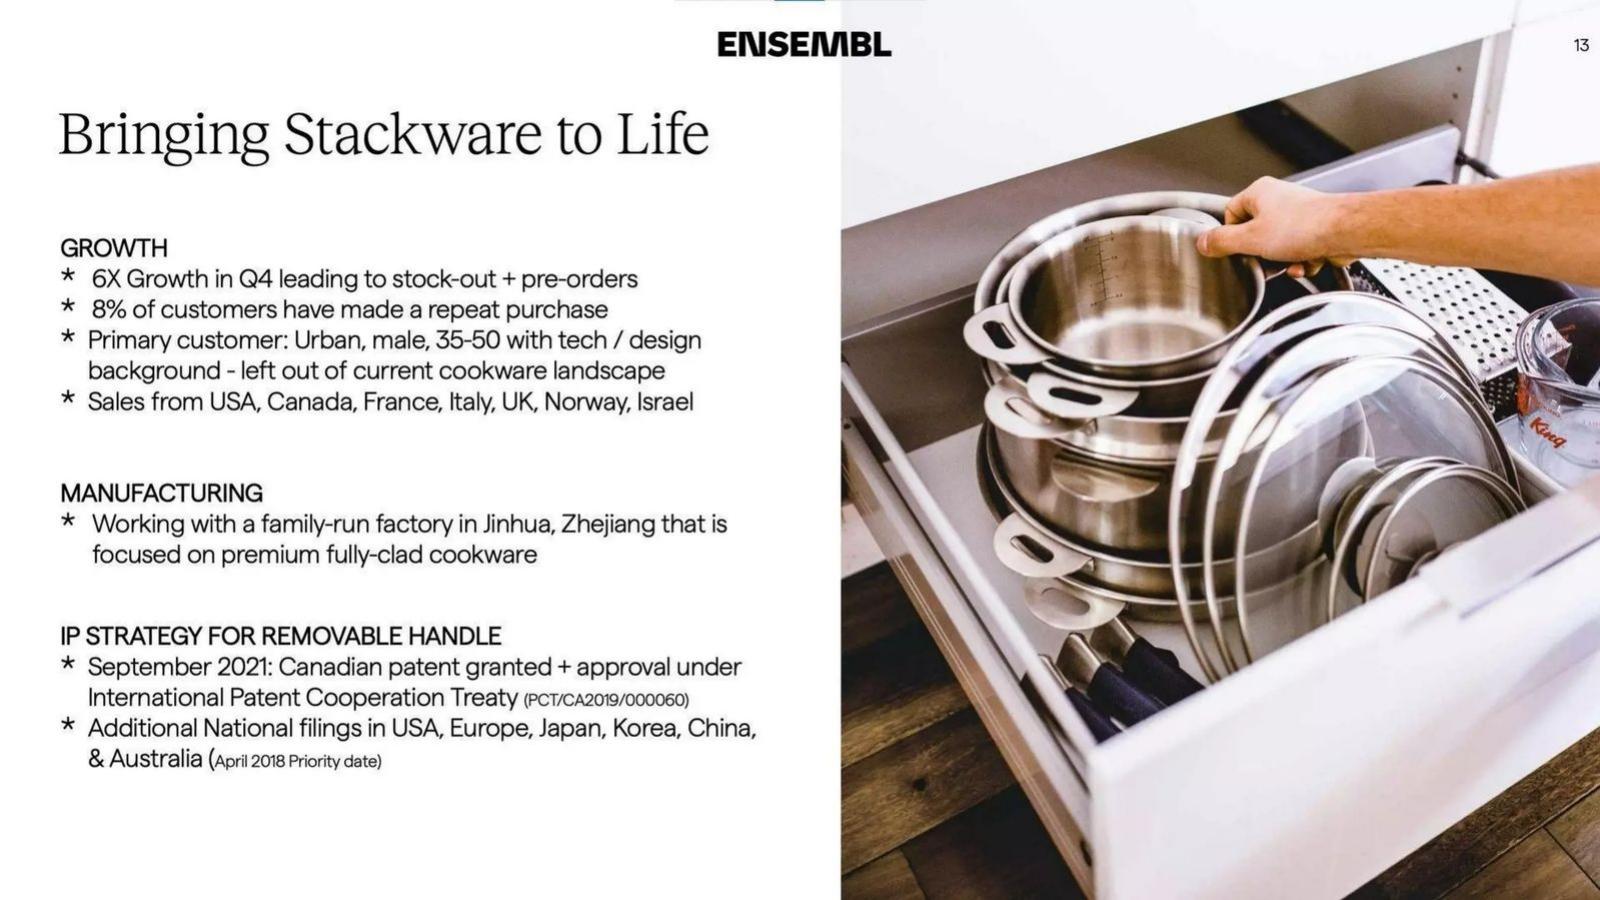
Ensembl deck, slide 13. Exact stored slide matched to this analysis.
Our analysis: It reports a low number plainly, for a product households buy rarely, and places it beside different evidence (a stock-out and pre-orders).
Evidence and limitation: The window and customer count are not stated, and "6X growth" has no base.
What a founder can adapt: For a durable product, explain what a repeat purchase is (a second set, an add-on piece) and what rate you expect.
Supporting analysis
What the deck claims: Growth: "6X Growth in Q4 leading to stock-out + pre-orders"; "8% of customers have made a repeat purchase"; primary customer "Urban, male, 35-50"; sales from seven named countries. Also manufacturing and patent details.
Presentation choice: It reports a low number plainly, for a product households buy rarely, and places it beside different evidence (a stock-out and pre-orders).
When it does not fit: The window and customer count are not stated, and "6X growth" has no base.
Skincare brand. "Proven Efficacy" slide in a 13-page deck.
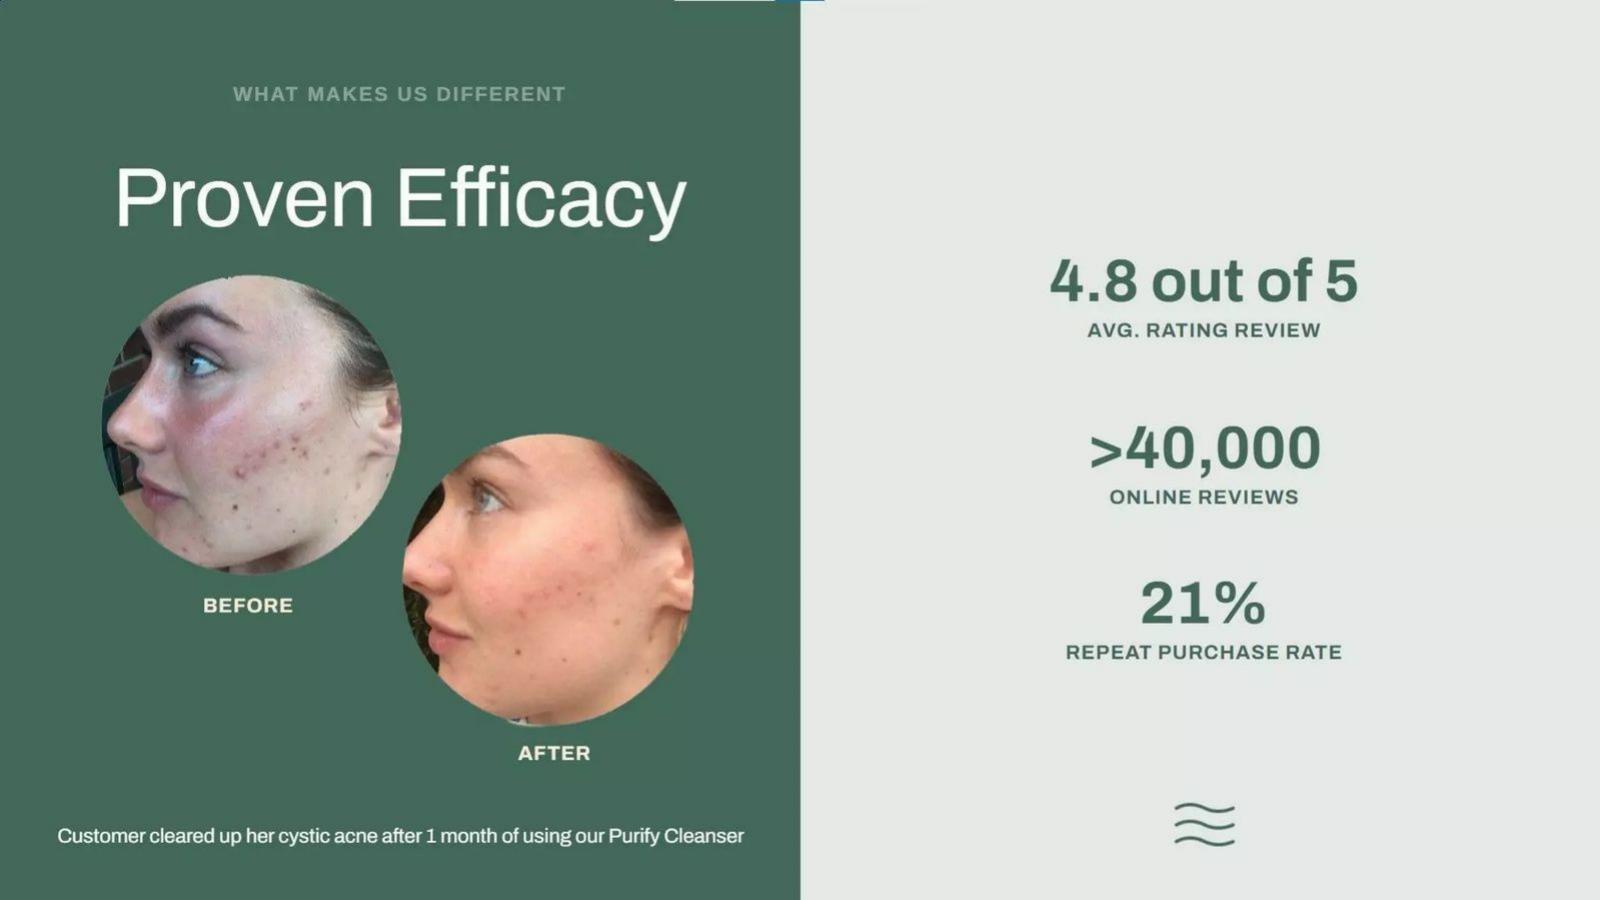
Three Ships deck, slide 7. Exact stored slide matched to this analysis.
Our analysis: Placing the repeat rate next to review volume gives two independent signals of satisfaction.
Evidence and limitation: The rate has no window or base, and a single before-and-after is a chosen example, not evidence of efficacy.
What a founder can adapt: Put the rate on a slide about customers rather than efficacy, with its window.
Supporting analysis
What the deck claims: Before-and-after photos ("Customer cleared up her cystic acne after 1 month of using our Purify Cleanser"); "4.8 out of 5 avg. rating review"; ">40,000 online reviews"; "21% repeat purchase rate".
Presentation choice: Placing the repeat rate next to review volume gives two independent signals of satisfaction.
When it does not fit: The rate has no window or base, and a single before-and-after is a chosen example, not evidence of efficacy.
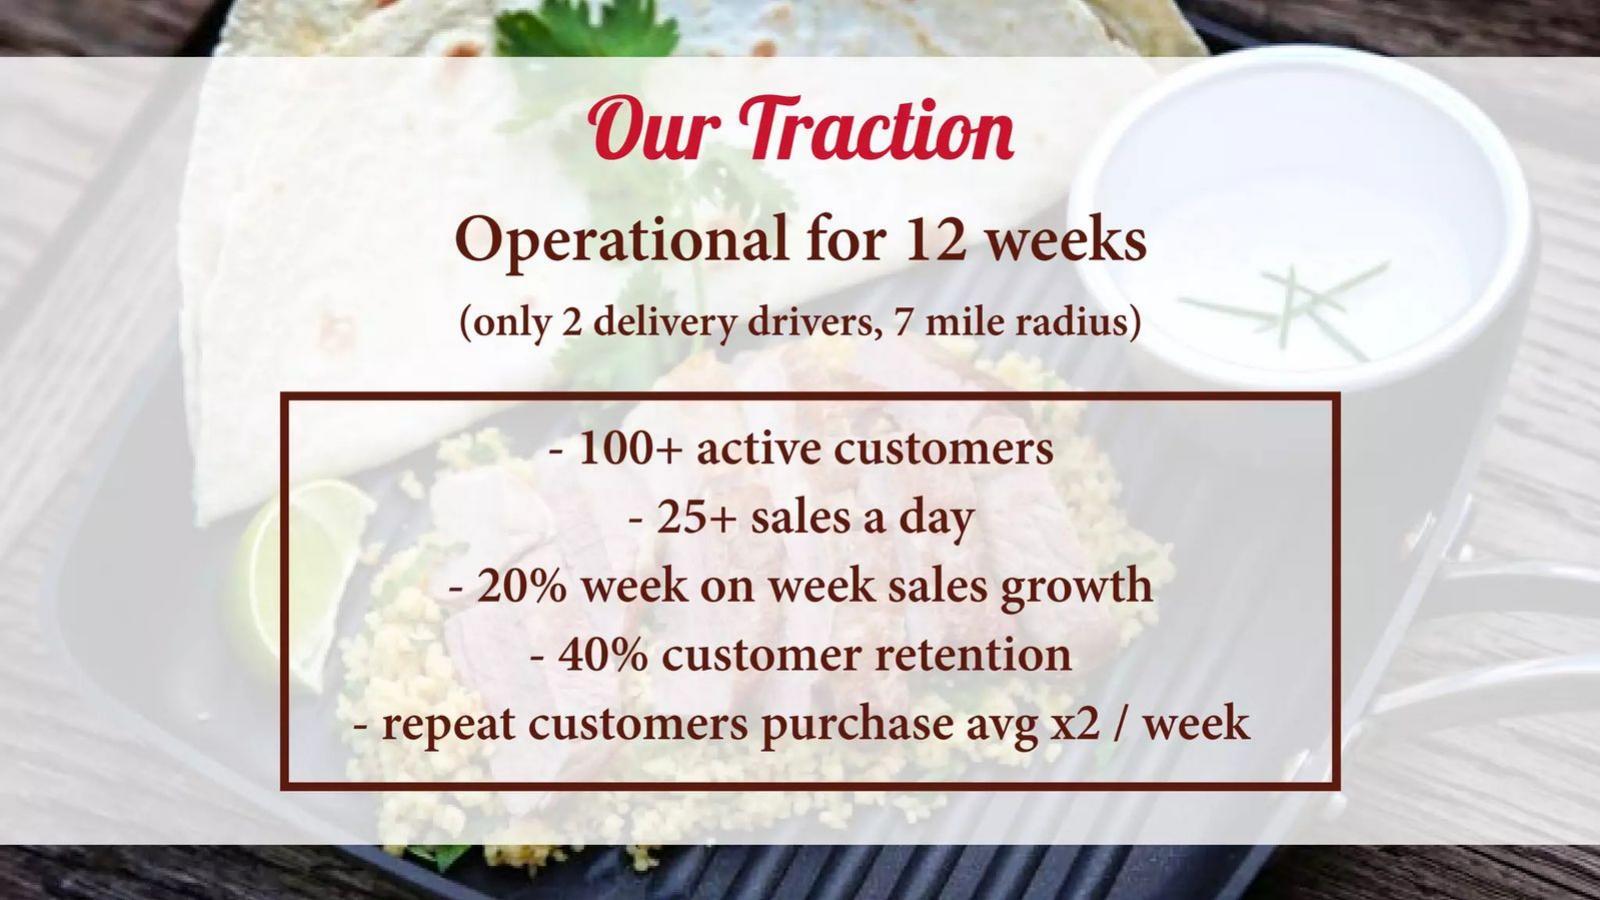
Meal-delivery start-up. "Our Traction" slide in an 18-page deck.
Lovethychef deck, slide 12. Exact stored slide matched to this analysis.
Our analysis: Stating the operating period bounds every figure: the retention measure cannot cover more than twelve weeks, and a reader knows the sample is small.
Evidence and limitation: "40% customer retention" and "x2 / week" are not tied to a base, and "active customer" is not defined.
What a founder can adapt: Define retention (bought again within how many weeks?) and give the number of customers behind it.
Supporting analysis
What the deck claims: "Operational for 12 weeks (only 2 delivery drivers, 7 mile radius)": "100+ active customers", "25+ sales a day", "20% week on week sales growth", "40% customer retention", "repeat customers purchase avg x2 / week".
Presentation choice: Stating the operating period bounds every figure: the retention measure cannot cover more than twelve weeks, and a reader knows the sample is small.
When it does not fit: "40% customer retention" and "x2 / week" are not tied to a base, and "active customer" is not defined.
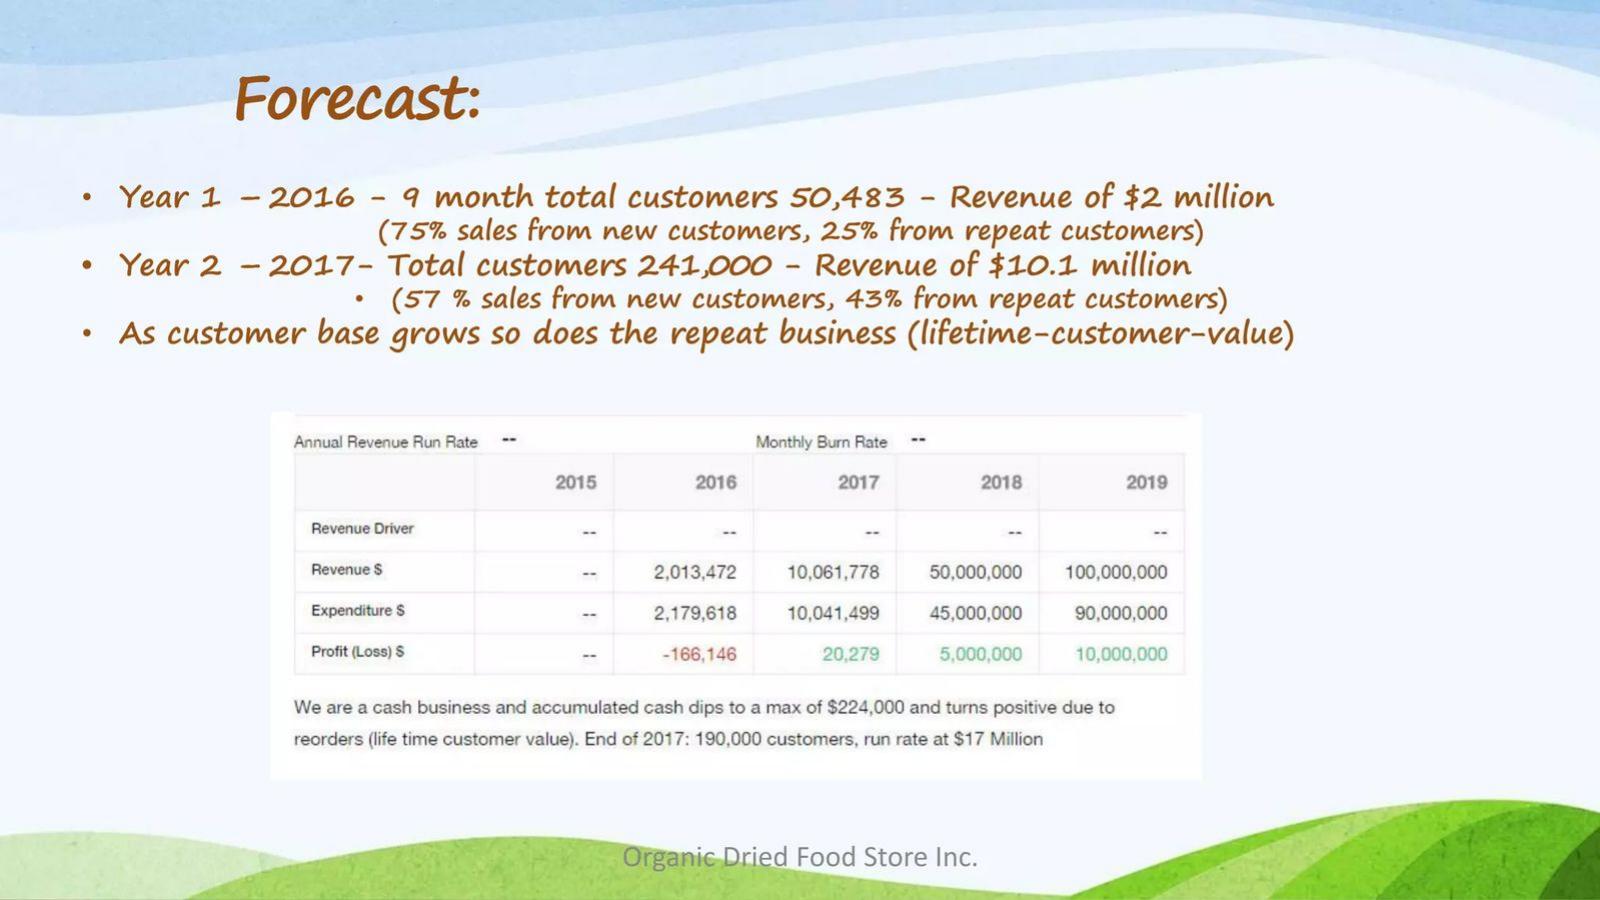
Organic dried-food retailer. "Forecast" slide in an 18-page deck.
Organic Dried Food deck, slide 13. Exact stored slide matched to this analysis.
Our analysis: It labels the page a forecast and splits revenue into new and repeat, which makes the dependence on returning customers visible.
Evidence and limitation: The repeat shares are projections with no stated assumptions; do not present them as evidence of loyalty.
What a founder can adapt: State the repeat rate and order value that produce the repeat share, and the measured figure they are based on.
Supporting analysis
What the deck claims: "Year 1 – 2016 – 9 month total customers 50,483 – Revenue of $2 million (75% sales from new customers, 25% from repeat customers)"; "Year 2 – 2017 – Total customers 241,000 – Revenue of $10.1 million (57% sales from new customers, 43% from repeat customers)". Table: revenue $2,013,472 (2016), $10,061,778 (2017). Note: cash "turns positive due to reorders (life time customer value)".
Presentation choice: It labels the page a forecast and splits revenue into new and repeat, which makes the dependence on returning customers visible.
When it does not fit: The repeat shares are projections with no stated assumptions; do not present them as evidence of loyalty.
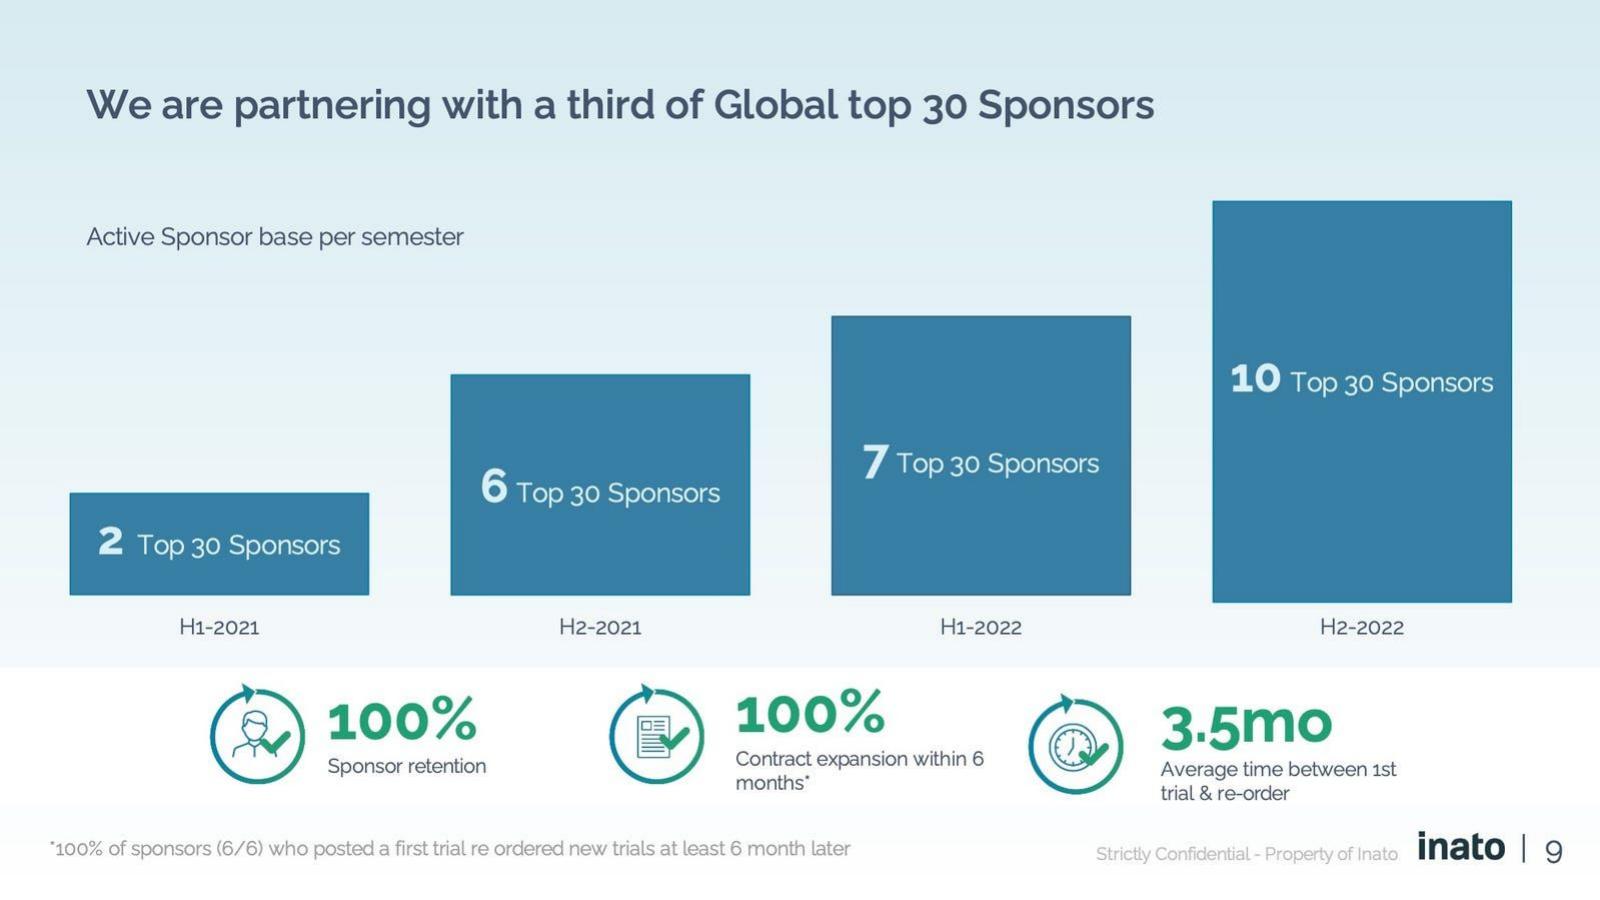
Clinical-trial recruitment marketplace for pharmaceutical sponsors. Sponsor slide in a 16-page deck.
Inato deck, slide 9. Exact stored slide matched to this analysis.
Our analysis: The footnote gives the count behind the percentage (6 of 6) and the window (at least six months later), so a reader can judge the small base for themselves.
Evidence and limitation: "100%" in large type overstates what six sponsors can show; lead with "6 of 6".
What a founder can adapt: For business customers, give re-orders as a count of clients with the window, as Inato's footnote does.
Supporting analysis
What the deck claims: "We are partnering with a third of Global top 30 Sponsors"; active top-30 sponsors per semester: 2 (H1 2021), 6 (H2 2021), 7 (H1 2022), 10 (H2 2022). "100% Sponsor retention", "100% Contract expansion within 6 months*", "3.5mo Average time between 1st trial & re-order". Footnote: "100% of sponsors (6/6) who posted a first trial re ordered new trials at least 6 month later."
Presentation choice: The footnote gives the count behind the percentage (6 of 6) and the window (at least six months later), so a reader can judge the small base for themselves.
When it does not fit: "100%" in large type overstates what six sponsors can show; lead with "6 of 6".
Each cell reports only what the slide itself states. "Not stated" means the page gives no figure.
Example
Figure
Unit (customers, orders, value)
Window
Customers measured
Order value
Abbeypost
60%
Repeat purchase (base not stated)
Within 30 days
Not stated
$120 first, $300 second
43 Layers
29%
Not stated
Not stated
Not stated
$340 average
Unfabled
27%
Share of orders
Not stated
Not stated
Repeat AOV 45% higher
Kredivo
90% / 64% / 91%
Users / loans / GMV
Monthly 2020 / not stated / 2H 2020
Not stated
Not stated
Bravo Sierra
35%
Repurchase rate
Not stated
250K DTC customers
Not stated
Kitu
40%
Repurchase rate (panel)
52 weeks to 1 Dec 2020
IRI retail panel
+9% $ per customer
Ensembl
8%
Share of customers
Not stated
Not stated
Not stated
Three Ships
21%
Not stated
Not stated
Not stated
Not stated
Lovethychef
40% retention
Not defined
At most 12 weeks
100+ active customers
Not stated (x2/week)
Organic Dried Food
25% / 43% of sales (forecast)
Share of revenue
2016 / 2017
Forecast
Not stated
Inato
100% (6 of 6)
Share of sponsors
At least 6 months
Sponsors with a first trial
Not stated
Kitterly
20%+
Not stated
Not stated
Not stated
Not stated
Key Takeaways
State the window. Abbeypost's "60% repeat purchase within 30 days" can be checked; 43 Layers' "29% Repeat Purchase Rate" cannot.
Say whether you count customers, orders or revenue. Unfabled's "27% of orders are from repeat customers" is a share of orders, which is always higher than the share of customers who returned when returners buy more than once.
Name the customers measured. Bravo Sierra limits its 35% to "DTC" customers, which excludes shoppers who buy through retailers.
Match the rate to how often the product is bought. Ensembl's 8% for cookware and Kitu's 40% for bottled coffee are not comparable; say what a normal rate is for your category and where that figure comes from.
Cite outside data precisely. Kitu names its source (IRI panel data, US all outlets, 52 weeks to 1 December 2020), which lets a reader see the 40% is a panel measure rather than the company's own records.
Keep forecasts apart from history. Organic Dried Food's 25% and 43% repeat shares sit under a "Forecast" heading and describe years that had not happened.
Write your repeat purchase line
Fill in what you know. Leave a field blank rather than guess, and label any forecast as a forecast.
Unit. Are you counting customers who returned, orders from returning customers, or revenue from them?
Cohort. Which first-time customers, acquired when, through which channel?
Window. Bought again within how many days of the first order?
Base. How many customers is the rate measured on?
Value. Average first order and average repeat order, with the number of orders behind each.
Comparison. An earlier cohort of yours, or a sourced category figure.
Copyable framework: [Rate]% of [n] customers who first bought in [period] via [channel] ordered again within [days] days; repeat orders averaged $[x] vs $[y] first orders. Earlier cohort: [rate]%.
Illustrative example 1 — written by us
Before: Customers love us: 35% repeat rate
After: 31% of 4,100 customers who first bought Jan–Mar 2024 on our site ordered again within 90 days (Q4 2023 cohort: 26%). Repeat orders averaged $58 vs $44 first orders.
What improved: Placeholder figures showing the format: the unit, cohort, window, base, order values and an earlier cohort replace an undefined percentage.
Three metrics that share one name
Founders use "repeat purchase rate" for at least three different numbers. The first is a customer rate: of the people who made a first purchase in a period, the share who made a second. The second is an order or revenue share: of all orders (or all revenue) in a period, the share that came from customers who had bought before. The third, common in finance and marketplaces, is an activity share: of the users active in a month, the share who had used the service before.
These give different numbers from the same data. Suppose 1,000 people buy for the first time in January and 250 of them buy again by June, each placing two more orders. The customer rate is 25%. Those 250 people placed 500 repeat orders, so repeat orders are 500 of 1,500 total orders from this group, a third. If the repeat orders are also larger, the revenue share is higher still. These figures are an illustration we constructed, not data from any deck.
Kredivo's slide 40 shows the problem in one table. Its row "% Share of Repeat Customers" gives Kredivo 90% ("average share of repeat users per month in 2020"), Affirm 64% ("facilitated loans taken out by repeat consumers") and Afterpay 91% ("CY2H2020 GMV from repeat consumers"). The first is a share of users, the second a share of loans, the third a share of transaction value, over different periods. The table invites a comparison the definitions do not support, although to its credit the footnotes state each definition so a reader can see that.
The window decides the number
A customer rate rises the longer you wait. The share of January's first-time buyers who have bought again by February is lower than the share who have bought again by December. A rate with no window cannot be compared with anything, including the company's own figure a year later.
Abbeypost is the only slide here to state a window on the rate itself: "60% repeat purchase within 30 days". Lovethychef gives a related clue: the business had been "operational for 12 weeks", so any repeat measure on that slide covers at most twelve weeks. Inato gives the gap between purchases instead: "3.5mo average time between 1st trial & re-order".
If your business is young, say so and use the window you have. A 30-day or 90-day rate from a six-month-old store is honest; an all-time rate from the same store mixes customers who have had five months to return with customers who have had five days.
Which customers are in the denominator
The same company can report very different repeat rates depending on whom it counts. Customers who buy through a retailer are usually invisible to the brand, so direct-to-consumer brands measure only the customers they can see. Bravo Sierra's "35% DTC repurchase rate" is explicit about this. Kitu's 40% comes from a retail panel instead, which counts shoppers buying in stores.
Other choices move the number too: whether gift purchases count, whether a customer who returned the first item counts, whether the base is all customers or only those acquired more than a set time ago, and whether subscription renewals count as repeat purchases. A slide cannot list all of these, but one line saying "customers who placed a first order Jan–Jun 2024; second order within 90 days; subscriptions excluded" answers most questions before they are asked.
What a rate means depends on the product
A good repeat rate for cookware and a good repeat rate for coffee are different numbers. Ensembl reports that "8% of customers have made a repeat purchase" for stackable cookware, a product most households buy rarely. Kitu reports a "40% repurchase rate" for bottled coffee, bought weekly. On its own, neither number says whether the business is doing well.
Founders can help by giving the comparison they believe is fair and its source. Kitu does something close: "+9% $ per customer in line w/ Starbucks" and "62% loyalty #1 in independent coffee", with the panel data named in the footer. None of the other slides in this set gives a category benchmark for its repeat figure. If you use one, name where it comes from; if you do not have a reliable one, a before-and-after comparison of your own cohorts is more persuasive than an unsourced industry average.
For durable goods, a low repeat rate is not necessarily a weakness, and some founders present referrals or accessory sales instead. Ensembl places its 8% beside "6X growth in Q4 leading to stock-out + pre-orders", which is a different kind of evidence. For a B2B product, re-orders from the same client are the equivalent measure, as Inato shows with trial sponsors.
Repeat order value: what a second order is worth
Several slides pair the rate with the size of repeat orders. Abbeypost gives "$120 average first order" and "$300 average second order"; by our calculation the second order is two and a half times the first. Unfabled states "repeat customer AOV is 45% higher". Lovethychef says "repeat customers purchase avg x2 / week".
These figures matter because investors use them to estimate what a customer is worth over time. They are also easy to misread. Abbeypost's $300 is the average for second orders, which are placed only by the customers who came back; it says nothing about customers who did not. Unfabled's 45% compares repeat customers' average order with a baseline the slide does not name (first orders? all orders?).
If you show repeat order value, state both averages and the number of orders behind each. Then a reader can combine rate and value into an expected second-period revenue per first-time buyer, and you can show that arithmetic yourself, labelled as your calculation.
History, forecast and claims of proof
Organic Dried Food's slide 13 is titled "Forecast". It states a 2016 figure of "9 month total customers 50,483 - Revenue of $2 million (75% sales from new customers, 25% from repeat customers)" and a 2017 figure of "Total customers 241,000 - Revenue of $10.1 million" with 57% from new and 43% from repeat customers. The table below gives revenue of $2,013,472 for 2016 and $10,061,778 for 2017. These are the company's projections of how repeat business will grow, not measured results; the slide does not say what repeat rate or order value the 43% assumes.
Abbeypost's slide 10 states "Our 60% repeat purchase rate proves that we nailed the product. We're making something people want." One rate, however good, is evidence, not proof: it does not show how many customers were measured, or whether the rate holds for customers acquired through paid channels. Present the number and let the reader draw the conclusion, or give the second piece of evidence (a later cohort, a larger sample) that supports it.
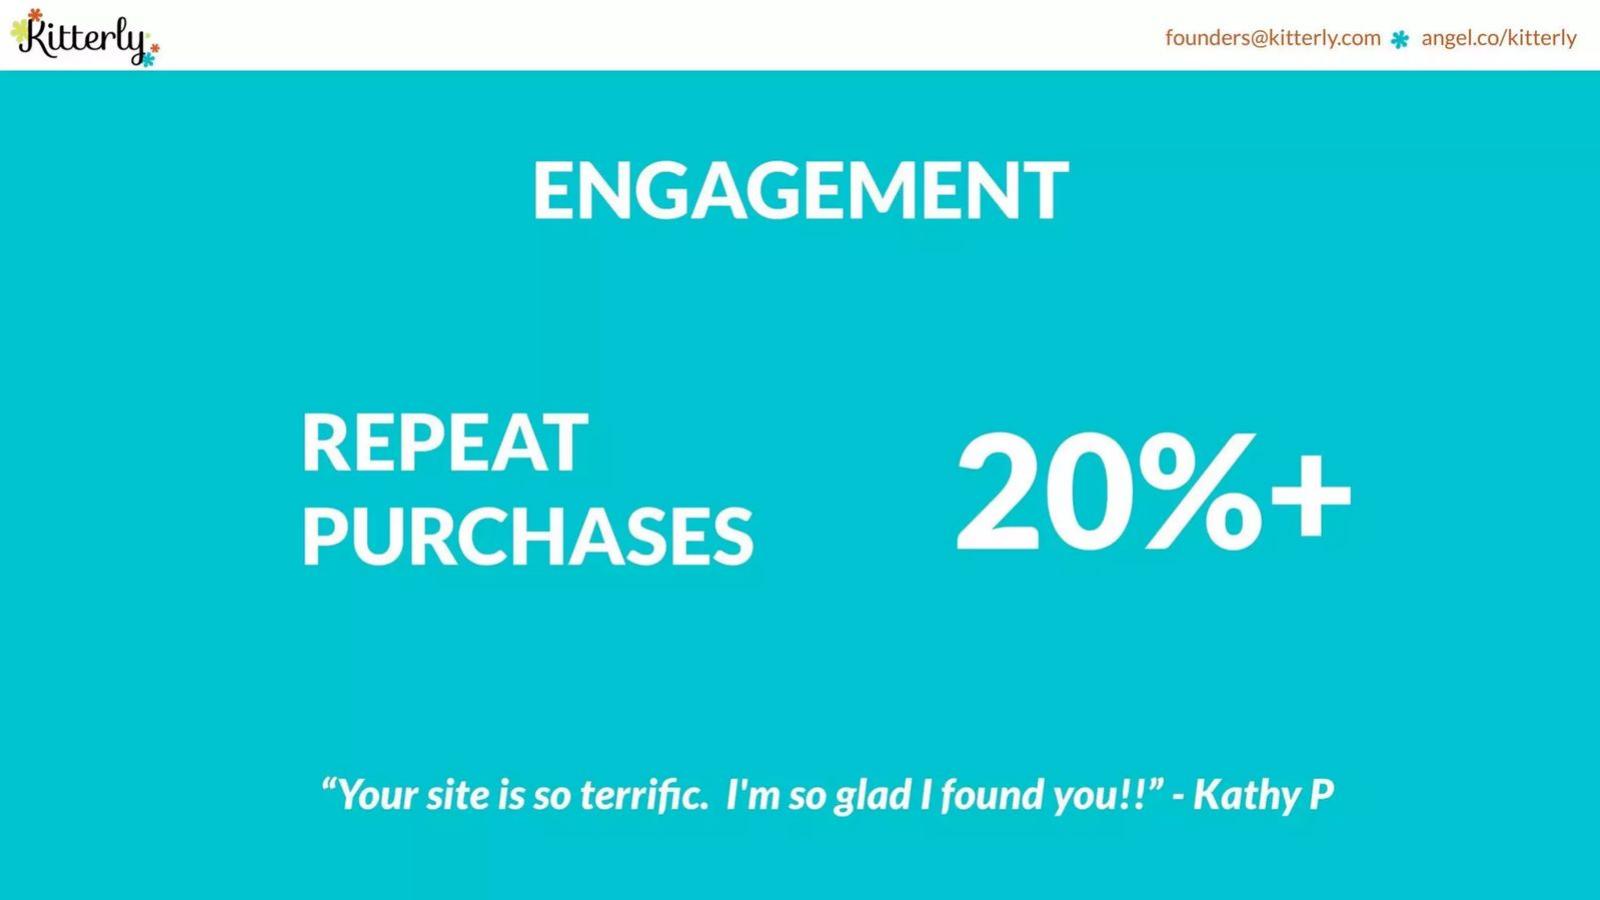
Kitterly shows the other extreme: "Repeat purchases 20%+" beside a single customer quote. Neither the window nor what the 20% is a share of is stated, and the quote tells a reader nothing about how many customers feel the same way.
Putting repeat purchases into your numbers
A repeat rate is most useful to an investor when it connects to the rest of the deck. If your financial model assumes that a third of next year's revenue comes from returning customers, the traction slide should show the measured rate that assumption rests on, and the model should use the same definition.
Organic Dried Food's footnote makes the link explicitly, though for a forecast: "accumulated cash dips to a max of $224,000 and turns positive due to reorders (life time customer value)". Whether that holds depends on a repeat assumption the slide never states. If you make a similar argument, show the assumed rate, window and order value, and point to the measured cohort it comes from.
Finally, report repeat purchases per cohort when you can. A single blended rate hides whether newer customers are returning as often as early ones. Two rows ("customers acquired Q1: 31% bought again within 90 days; Q2: 28%") tell a reader more than any headline percentage.
Common mistakes
No window. A repeat rate rises the longer you wait; without a window it cannot be compared.
Orders read as customers. A share of orders from returning customers is higher than the share of customers who returned.
Mixed definitions in a comparison. Comparing your share of users with a peer's share of transaction value compares different things.
No base. A percentage without the number of customers measured hides how small the sample may be.
Forecast shown as loyalty. A projected split between new and repeat revenue is an assumption, not a measured result.
One number called proof. A single rate is evidence; add a second cohort or channel before claiming product-market fit.
Diagnostic checklist
The slide says whether the figure counts customers, orders or revenue.
The window (days after first purchase) is stated.
The cohort and channel measured are named, with the number of customers.
Repeat order value, if shown, has a named baseline.
Any peer or category comparison uses the same definition and a named source.
Forecast repeat shares are labelled as forecasts with their assumptions.
Where possible, at least two cohorts are shown.
Frequently asked questions
What is a good repeat purchase rate for a pitch deck?
There is no single figure, because it depends on how often the product is bought and how the rate is defined. In this set Ensembl reports 8% for cookware and Kitu 40% for bottled coffee. Give your definition and window, and compare with an earlier cohort of your own or a sourced category figure rather than a general benchmark.
Should I show repeat purchase rate or share of revenue from repeat customers?
Both, labelled. The customer rate shows how many return; the revenue share shows how much the business depends on them. Unfabled's "27% of orders are from repeat customers" is the second kind and is easy to misread as the first.
Can I compare my repeat rate with a large competitor's?
Only if both are measured the same way. Kredivo's table compares a monthly share of users with Affirm's share of loans and Afterpay's share of transaction value; the footnotes show the definitions differ.
My business is only a few months old. Is a repeat rate worth showing?
Yes, if you state the period. Lovethychef says it had operated for 12 weeks; a 30-day rate from a young business, with its base, is more credible than an all-time figure that mixes old and new customers.
How we chose these examples
Search (2026-09-30): the durable corpus index (docs/seo/artifacts/corpus-search, 70,729 unique pages, deduplicated by deck-file sha256 + page) was searched for repeat purchase, repeat customers, reorder, repurchase and repeat rate (93 matching pages). Existing guides were read first: churn and retention (subscription cohorts, including DoorDash's repeat-rate curve), food traction, customer, unit economics and pre-order guides mention repeat purchases only in passing, so this guide asks a question none of them answers: how to define and present the metric.
Fifteen candidate pages were rendered from the original public deck files and read from the images; twelve are used: Abbeypost 7, 43 Layers 8, Unfabled 6, Kredivo 40, Bravo Sierra 13, Kitu 10, Ensembl 13, Three Ships 7, Lovethychef 12, Organic Dried Food 13, Inato 9, Kitterly 8. Twelve images were stored from the original PDFs on 2026-09-30. Abbeypost 10 is quoted in the Abbeypost example rather than shown separately, since it repeats the same figure.
Left out: TransferWise 4 ("70% volume from repeat customers"; source file unavailable), DoorDash 2 (already used in the churn and retention guide), Joey New York 10 and Suma Wealth 8 (a bare repeat percentage, a lesson 43 Layers and Kitterly already show), and pages where "return rate" means investment returns rather than customers. A search for refund and product-return rates found no founder slide stating one for its own products (18 matches, all investment returns, forecasts or third-party statistics), so that topic was set aside.
Worked numbers in the sections are labelled as our illustrations or our calculations. How we built this: drafted and checked with AI assistance (editorial model review against the original slide images); no human editor has reviewed this guide.