How food and beverage startups show traction: quarterly revenue with meals and orders per customer, points of distribution by quarter.
Food Traction Slides: Real Pitch Deck Examples
Seven traction slides from food and drink decks (a home-cooked meal marketplace, a coffee brand, a baby food brand, a frozen smoothie supplier to restaurants, a waffle brand, a craft brewery and a plant-based restaurant brand), shown in full. Food investors want to know whether people buy again: how much each customer or store sells over time, not only how many places carry the product. The stronger slides pair a count with a rate (orders per customer, units per store per week); the weaker ones give totals or follower counts with no time frame.
TL;DR
A food traction slide should show repeat buying: revenue over time plus a rate per customer or per store. HomeCooks charts quarterly revenue and adds orders per customer per month. Chamberlain Coffee charts points of distribution and door count by quarter. Once Upon a Farm gives units sold per store per SKU per week, with the data source. Barfresh lists its Subway rollout year by year with store counts. Belgian Boys gives six totals for 2020. Black Hops shows 14 pre-sold kegs at launch. Clean Kitchen Club shows only social following, the weakest example here.
Food traction slides
Each example shows the exact stored slide above its analysis and links to the full teardown. Stronger examples first. Claims and figures are as shown on the slides; we have not verified them.
HomeCooks traction slide — slide 6
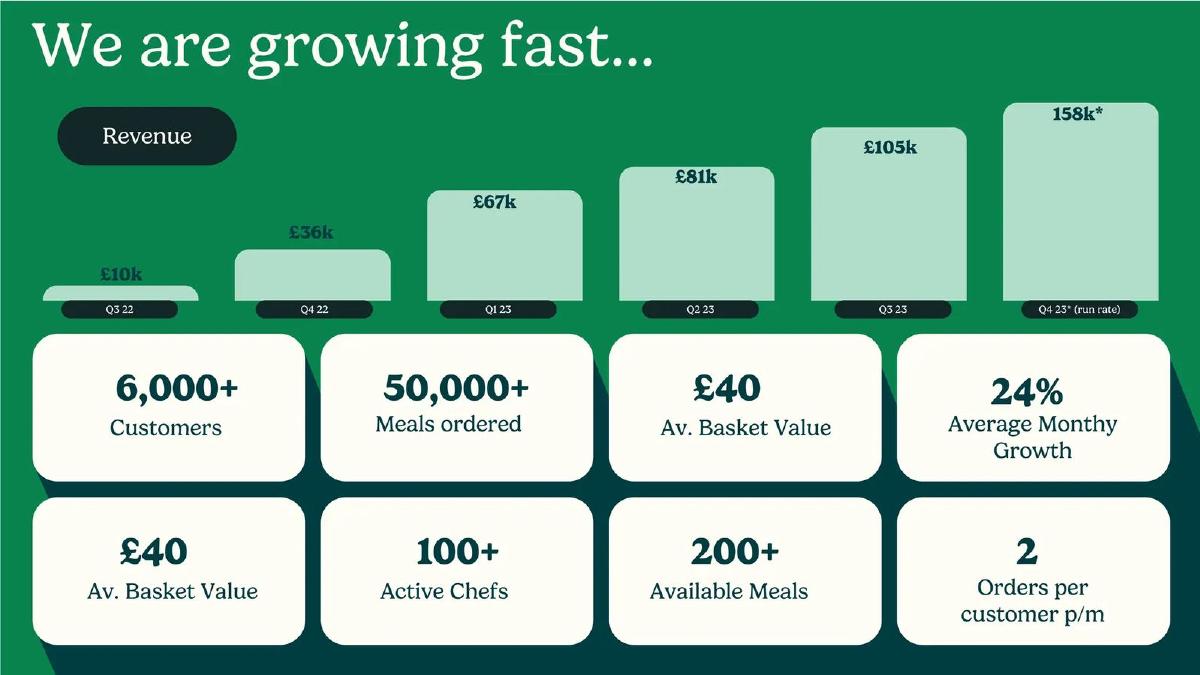
Stage not recorded. Marketplace for home-cooked meals in the UK. Quarterly revenue bars with eight number tiles below.
HomeCooks deck, slide 6. Exact stored slide matched to this analysis.
Our analysis: The most complete slide here: revenue over time plus a repeat rate. The duplicated basket value tile is a small slip.
Evidence and limitation: Six quarters of revenue with the latest marked as a run rate, customer and meal totals, basket value and orders per customer per month.
What a founder can adapt: Chart revenue by quarter, mark run rates, and add orders per customer per month.
Supporting analysis
What the deck claims: "We are growing fast..." "Revenue": "£10k" Q3 22, "£36k" Q4 22, "£67k" Q1 23, "£81k" Q2 23, "£105k" Q3 23, "158k*" "Q4 23* (run rate)". Tiles: "6,000+ Customers", "50,000+ Meals ordered", "£40 Av. Basket Value" (shown twice), "24% Average Monthy Growth", "100+ Active Chefs", "200+ Available Meals", "2 Orders per customer p/m".
Presentation choice: Orders per customer per month tells an investor people come back, which a customer total alone cannot.
When it does not fit: Repeating a tile; use the space for a cohort or repeat-rate figure.
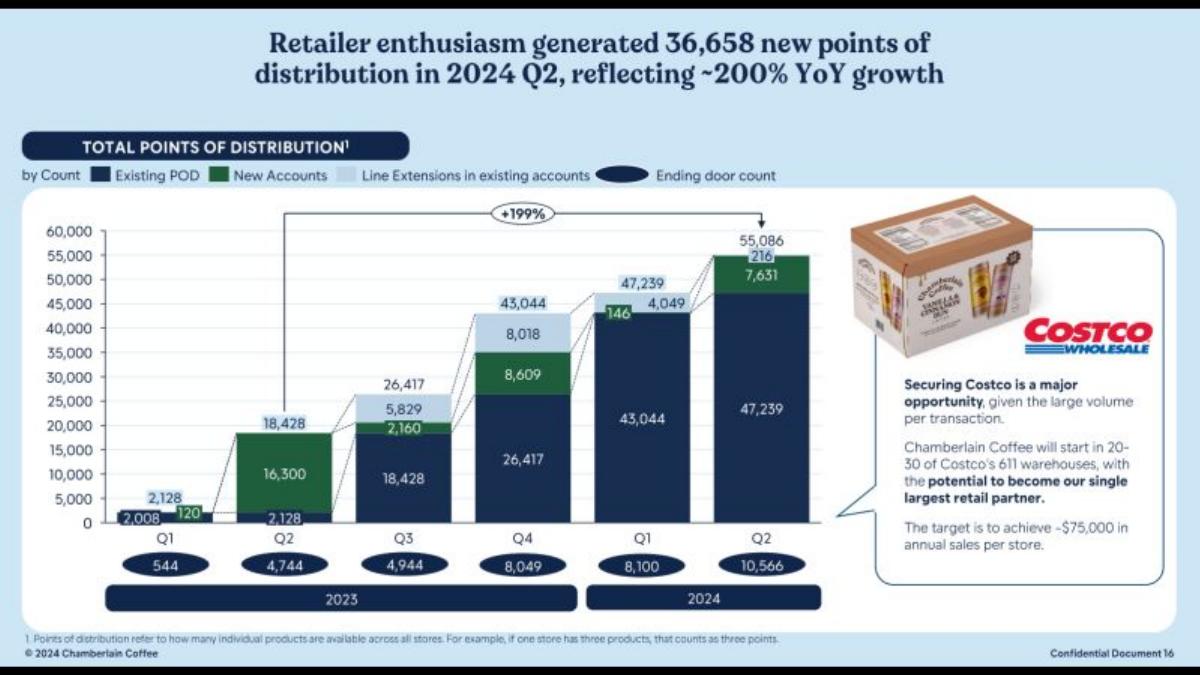
Series A (recorded). Coffee brand moving into retail. Stacked bars by quarter, Q1 2023 to Q2 2024, with a Costco callout.
Chamberlain Coffee deck, slide 4. Exact stored slide matched to this analysis.
Our analysis: Clear and well defined, but it shows where the product is stocked, not how fast it sells; the Costco sales figure is a goal, not a result.
Evidence and limitation: Six quarters of distribution, split by source, with door counts and a definition; no sales figures on this slide, and the Costco figure is a target.
What a founder can adapt: Chart doors and points of distribution by quarter, define them, and add sales per store.
Supporting analysis
What the deck claims: "Retailer enthusiasm generated 36,658 new points of distribution in 2024 Q2, reflecting ~200% YoY growth." "Total points of distribution" split into "Existing POD", "New Accounts" and "Line Extensions in existing accounts", from 2,128 in Q1 2023 to 55,086 in Q2 2024, with "Ending door count" from 544 to 10,566. "Chamberlain Coffee will start in 20-30 of Costco's 611 warehouses." "The target is to achieve ~$75,000 in annual sales per store." Footnote defines a point of distribution.
Presentation choice: Separating doors from points of distribution stops one store with many products from looking like many stores.
When it does not fit: Placing a sales target beside actuals without labelling it clearly as a target.
Stage not recorded. Refrigerated baby food. A store photo with text.
Once Upon a Farm deck, slide 5. Exact stored slide matched to this analysis.
Our analysis: Shows the measure grocery buyers use most, units per store per week, and backs it with a source. The base is small.
Evidence and limitation: Sales velocity in two store placements, with the unit defined and the retailers named as the data source; two retailers only, no store count or dates.
What a founder can adapt: Report units per store per SKU per week, name the data source and give the number of stores and weeks.
Supporting analysis
What the deck claims: "First To Market With Refrigerator in Baby Food Aisle." "We have seen a 30% increase in average velocity from our branded fridge." "Avg. Velocity in Dairy Section: 3.8 u/s/sku/w*." "Avg. Velocity in Baby Food Section: 5.0 u/s/sku/w*." Footnote: "Units sold per store per SKU (variety) per week based on sales report data obtained from Jimbo's Naturally! and Bristol Farms."
Presentation choice: Velocity shows whether shoppers pick the product up once it is on the shelf, which decides whether stores keep it.
When it does not fit: A percentage lift from two retailers presented without the store count.
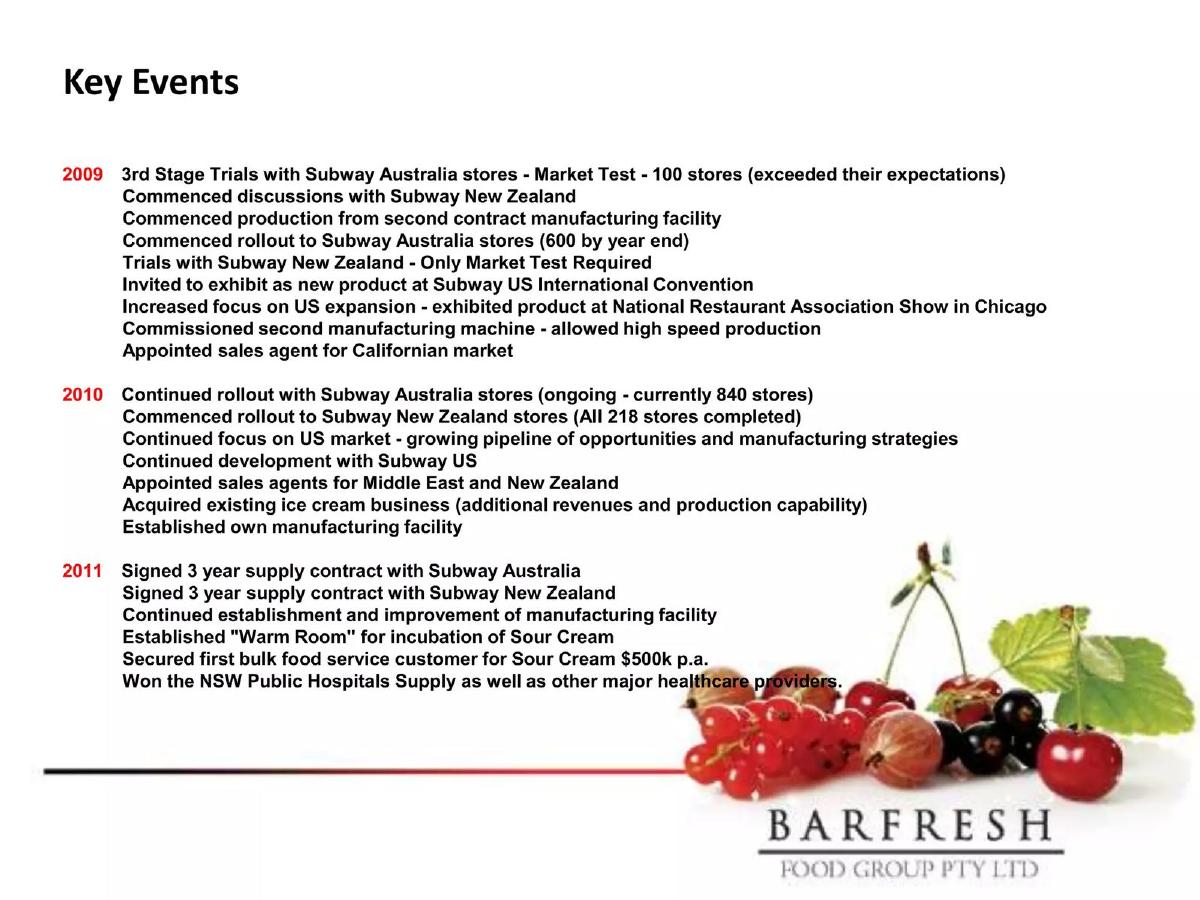
Series A (recorded). Frozen smoothie packs for restaurants. A year-by-year list, 2009 to 2011.
Barfresh deck, slide 6. Exact stored slide matched to this analysis.
Our analysis: Strong underlying story, trial to rollout to contract with one chain, but it is buried in a dense list of factory and trade-show events.
Evidence and limitation: Store counts for one named chain over three years, two multi-year contracts and one contract value; operational items are mixed in and there is no revenue total.
What a founder can adapt: Chart stores served by quarter, name the contracts and their length, and move factory events elsewhere.
Supporting analysis
What the deck claims: "Key Events." 2009: "3rd Stage Trials with Subway Australia stores - Market Test - 100 stores", "Commenced rollout to Subway Australia stores (600 by year end)". 2010: "Continued rollout with Subway Australia stores (ongoing - currently 840 stores)", "Commenced rollout to Subway New Zealand stores (All 218 stores completed)". 2011: "Signed 3 year supply contract with Subway Australia", "Signed 3 year supply contract with Subway New Zealand", "Secured first bulk food service customer for Sour Cream $500k p.a."
Presentation choice: For foodservice suppliers, moving from a store trial to a signed supply contract is the milestone investors look for.
When it does not fit: Twenty lines of text; keep the four or five events that show customers buying.
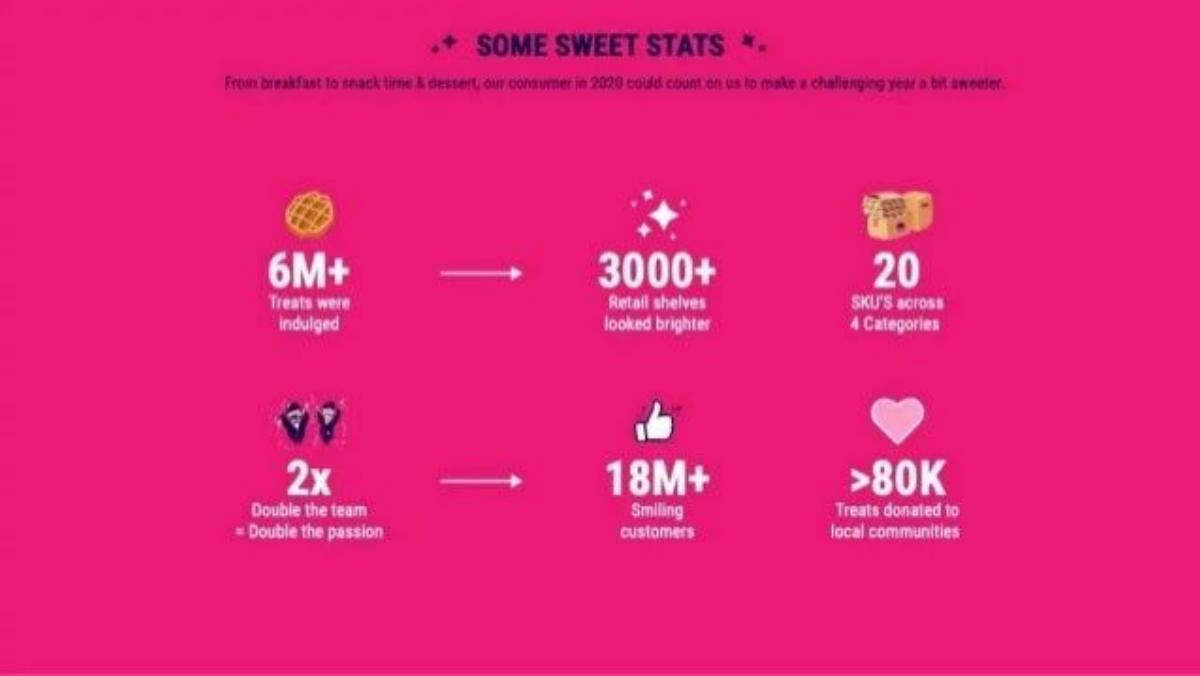
Series A (recorded). Packaged waffles and pastries. Six large numbers for 2020.
Belgian Boys deck, slide 4. Exact stored slide matched to this analysis.
Our analysis: Friendly and on brand, but only three of the six numbers are traction, and one is inconsistent with the others.
Evidence and limitation: Units, stores and SKUs for one year; no revenue, no prior year and no sales per store. "18M+ customers" is larger than the 6M units sold, so it cannot be buyers.
What a founder can adapt: Keep units, stores and SKUs, add the previous year and revenue, and drop the team and donation figures.
Supporting analysis
What the deck claims: "Some sweet stats." "From breakfast to snack time & dessert, our consumer in 2020 could count on us to make a challenging year a bit sweeter." "6M+ Treats were indulged." "3000+ Retail shelves looked brighter." "20 SKU'S across 4 Categories." "2x Double the team." "18M+ Smiling customers." ">80K Treats donated to local communities."
Presentation choice: Included to show that playful labels can hide which numbers matter; units and stores need a time comparison.
When it does not fit: A customer figure larger than units sold; define it or remove it.
Seed (recorded). Craft brewery in Brisbane. Four bullets and a photo.
Black Hops Brewing deck, slide 4. Exact stored slide matched to this analysis.
Our analysis: Honest early traction: pre-sold kegs to bars is real demand from buyers, but it is one batch.
Evidence and limitation: One pre-sale figure, a launch anecdote, a rating and festival invitations; no repeat orders or revenue.
What a founder can adapt: Name how many bars re-ordered after the first keg and the monthly kegs sold since.
Supporting analysis
What the deck claims: "Traction." "First commercial brew Eggnog stout pre-sold 14 kegs to top craft beer bars in Brisbane." "First keg sold out in 2 hours 20 minutes at our launch." "Eggnog Stout rates 4 stars on Untappd making it one of the highest rating Queensland beers." "Accepted into GABS 2015, asked to brew for Good Beer Week, Brewsvegas and others."
Presentation choice: Pre-sales to trade buyers show that someone other than the founders will pay before the product exists.
When it does not fit: Anecdotes such as sell-out time in place of re-order figures.
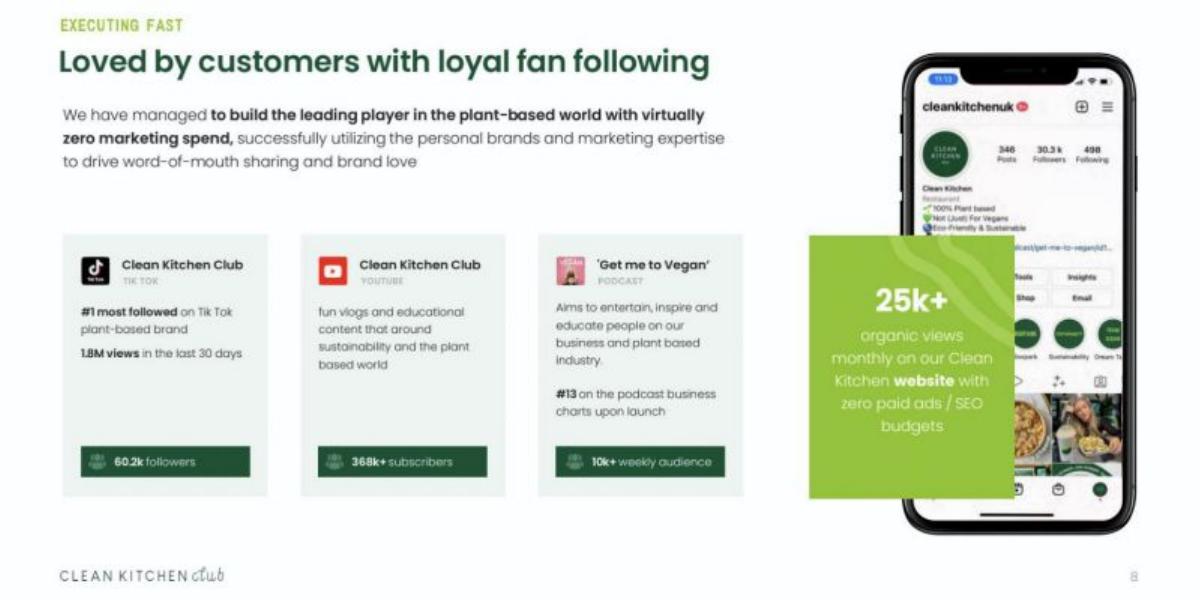
Seed (recorded). Plant-based restaurant brand in the UK. Four panels about social channels and a phone screenshot.
Clean Kitchen Club deck, slide 5. Exact stored slide matched to this analysis.
Our analysis: The weakest example: audience is useful for a restaurant brand, but the slide never shows that followers eat there.
Evidence and limitation: Followers, views and web traffic; no orders, covers, revenue or locations.
What a founder can adapt: Put orders or covers per week and revenue per site first, then show followers as the low-cost acquisition channel.
Supporting analysis
What the deck claims: "Executing fast." "Loved by customers with loyal fan following." "We have managed to build the leading player in the plant-based world with virtually zero marketing spend." "#1 most followed on Tik Tok plant-based brand", "1.8M views in the last 30 days", "60.2k followers"; YouTube "368k+ subscribers"; podcast "10k+ weekly audience"; "25k+ organic views monthly on our Clean Kitchen website with zero paid ads / SEO budgets."
Presentation choice: Included for contrast; the headline says "loved by customers" but every figure is about viewers.
When it does not fit: Calling followers customers.
Whether each slide gives revenue, a repeat or per-store rate, a time axis, and where the product is sold.
Example
Business
Revenue
Repeat or rate
Time axis
Where sold
HomeCooks
Meal marketplace
Quarterly
Orders per customer
Six quarters
Online
Chamberlain Coffee
Coffee brand
No (target only)
No
Six quarters
Doors and points of distribution
Once Upon a Farm
Baby food
No
Units per store per week
No
Two retailers
Barfresh
Restaurant supply
One contract value
No
2009 to 2011
Subway store counts
Belgian Boys
Packaged pastries
No
No
2020 only
3,000+ shelves
Black Hops
Craft beer
No
No
Launch
14 kegs to bars
Clean Kitchen Club
Restaurant brand
No
No
Last 30 days
Not shown
Key Takeaways
Show revenue by month or quarter, not just a total.
Add a repeat measure: orders per customer, or units per store per week.
Count stores or doors separately from points of distribution, and define them.
Keep follower counts as support, not the headline.
Build your food traction slide
Show revenue over time and prove that customers or stores buy again.
Revenue. Revenue by month or quarter, with run rates marked.
Repeat. Orders per customer per month, or re-order rate from trade buyers.
Per store. Doors, and units per store per SKU per week, with the data source.
Accounts. Named restaurant, retail or bar accounts and how many sites each took.
Copyable framework: Revenue [amount] in [quarter], up from [amount] in [quarter]. [n] customers ordering [n] times a month; [n] doors selling [n] units per store per week.
Illustrative example 1 — written by us
Before: Loved by customers with loyal fan following. 60.2k followers. 368k+ subscribers.
After: [n] orders a week across [n] sites in [month], revenue [amount] per site. Audience of 60.2k TikTok followers and 368k YouTube subscribers brings customers at almost no marketing cost.
What improved: Our illustrative rewrite; not Clean Kitchen Club's wording. Bracketed parts are placeholders to fill with real facts. It leads with orders and revenue and keeps the audience as the reason acquisition is cheap.
What this guide adds
The library has food problem, solution, market and product guides and a consumer product traction guide about retail shelves, but no food traction guide. This page covers food and drink more widely: meal delivery, restaurant supply, bars and retail, and how each shows that customers come back.
Sector labels come from the sector recorded for each published teardown (high confidence for all except Clean Kitchen Club, medium). The consumer product traction guide uses a different Chamberlain Coffee slide; none of these seven slides appears in another guide.
Four ways food decks show traction
Revenue with a repeat rate (HomeCooks): quarterly revenue and orders per customer.
Distribution and sales rate (Chamberlain Coffee, Once Upon a Farm): how many places stock the product, and how fast it sells there.
Account rollouts (Barfresh, Black Hops): named buyers and how many locations or kegs they took.
Totals and following (Belgian Boys, Clean Kitchen Club): big numbers with no time axis, weaker on their own.
Common mistakes
Totals with no time axis. Show the same figure for an earlier period so growth is visible.
Distribution without sales. Stores stocking the product matter less than how fast it sells there.
Followers as customers. Keep audience figures separate from people who bought.
Targets beside actuals. Label goals clearly so they are not read as results.
Diagnostic checklist
Revenue by month or quarter.
Orders per customer or units per store per week.
Doors and points of distribution defined.
Named accounts with site counts.
Frequently asked questions
How we chose these examples
Corpus: published pitch deck teardowns on StartupFundraising.com. Founder-uploaded private decks are excluded.
Selection (2026-09-27): we took teardowns whose recorded sector is food and beverage, with a stored slide image and slide text about traction, growth, customers, stores, sales, meals or orders. We read the candidates and viewed nine slide images, left out market-size slides, slides already used in other guides (Grom, Loeb's Crunch and a second Chamberlain Coffee slide), a slide with no stored image (Karma) and public-company decks, and kept seven. Clean Kitchen Club is included as the weakest example for contrast.
Sector is the category recorded for each teardown (high confidence for six; medium for Clean Kitchen Club). Stages as recorded: Chamberlain Coffee, Barfresh and Belgian Boys, Series A; Black Hops and Clean Kitchen Club, seed; HomeCooks and Once Upon a Farm, not recorded.
Review: stored slide images were checked on 2026-09-27 and matched to company, deck and slide number, and quoted text was read from the images (editorial model review). No person has yet completed an editorial review of this page.
Claims and figures are as shown on the slides; we have not verified them. We make no claim that any slide caused a fundraising outcome.