Chamberlain Coffee’s 15-slide deck for its 2024 Series A extension is a masterclass in transitioning an influencer-led brand into a legitimate CPG contender. The deck moves quickly past the 'celebrity' aspect of founder Emma Chamberlain to focus on hard retail metrics: 36,658 new points of distribution in Q2 2024 and a 5.3% social engagement rate that dwarfs established competitors like Blue Bottle and La Colombe. While the company faced 'growing pains' in 2024 due to supply chain issues, the deck transparently addresses these hurdles while projecting a path to $33.4M in total gross revenue b…
Key takeaways
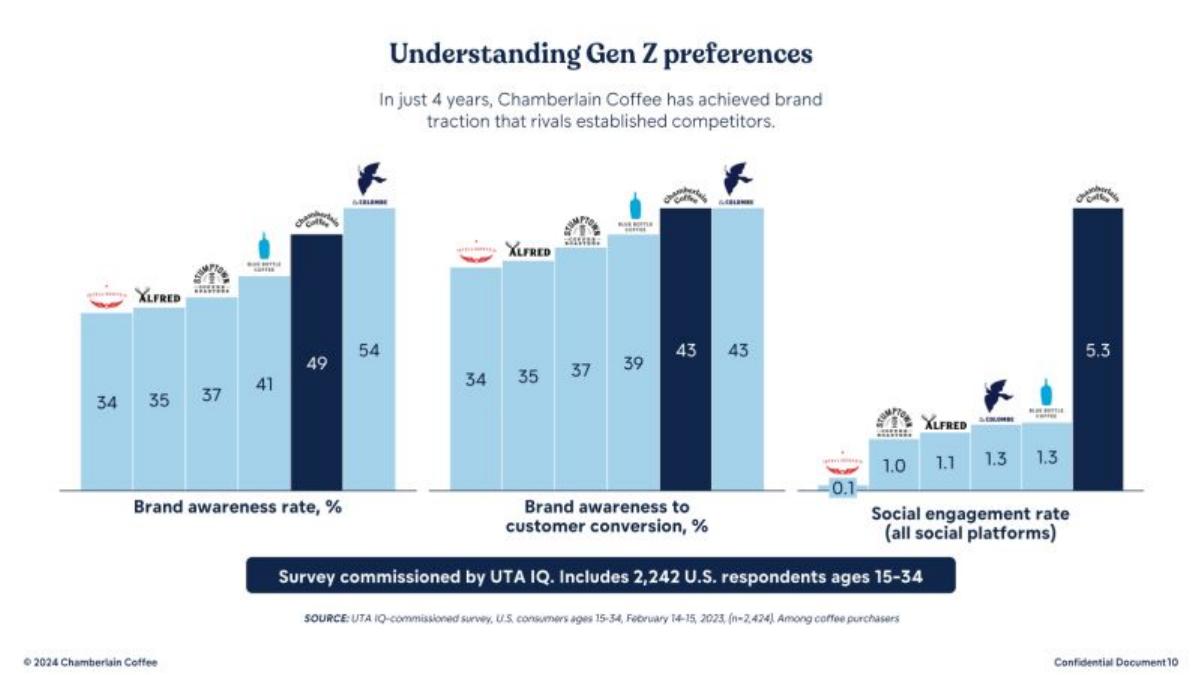
- The brand claims a 5.3% social engagement rate, significantly higher than competitors like Blue Bottle (1.3%) and La Colombe (1.3%) on slide 2.
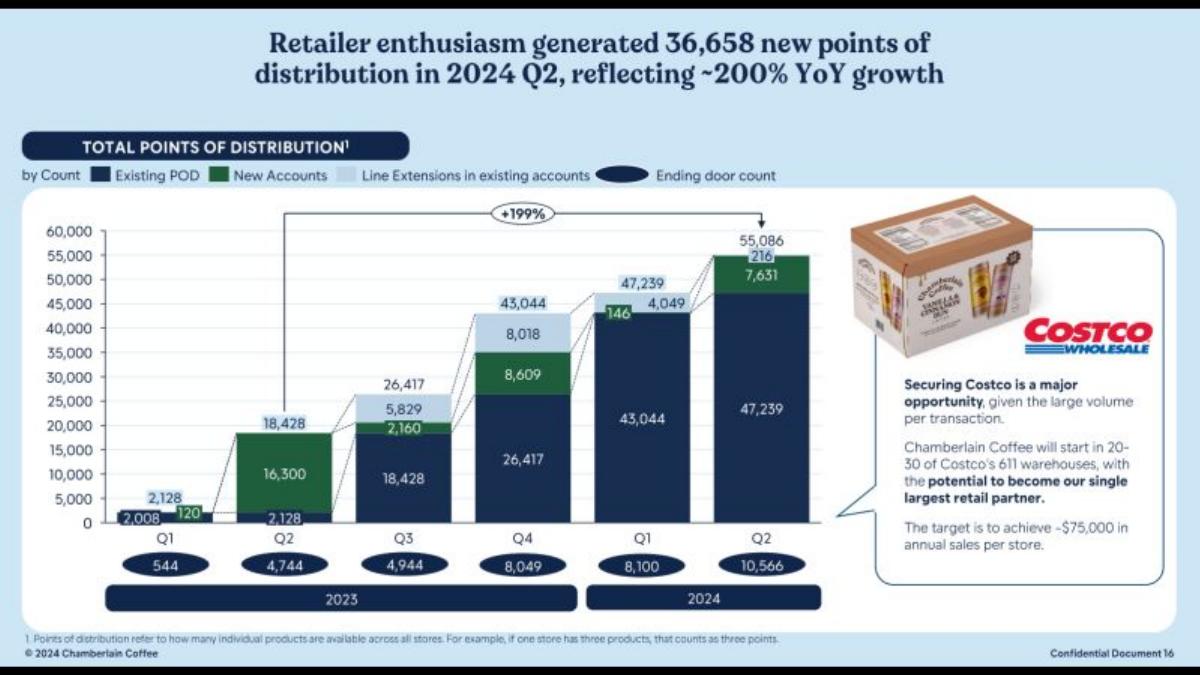
- Retailer enthusiasm led to 36,658 new points of distribution in Q2 2024, representing approximately 200% YoY growth as shown on slide 4.
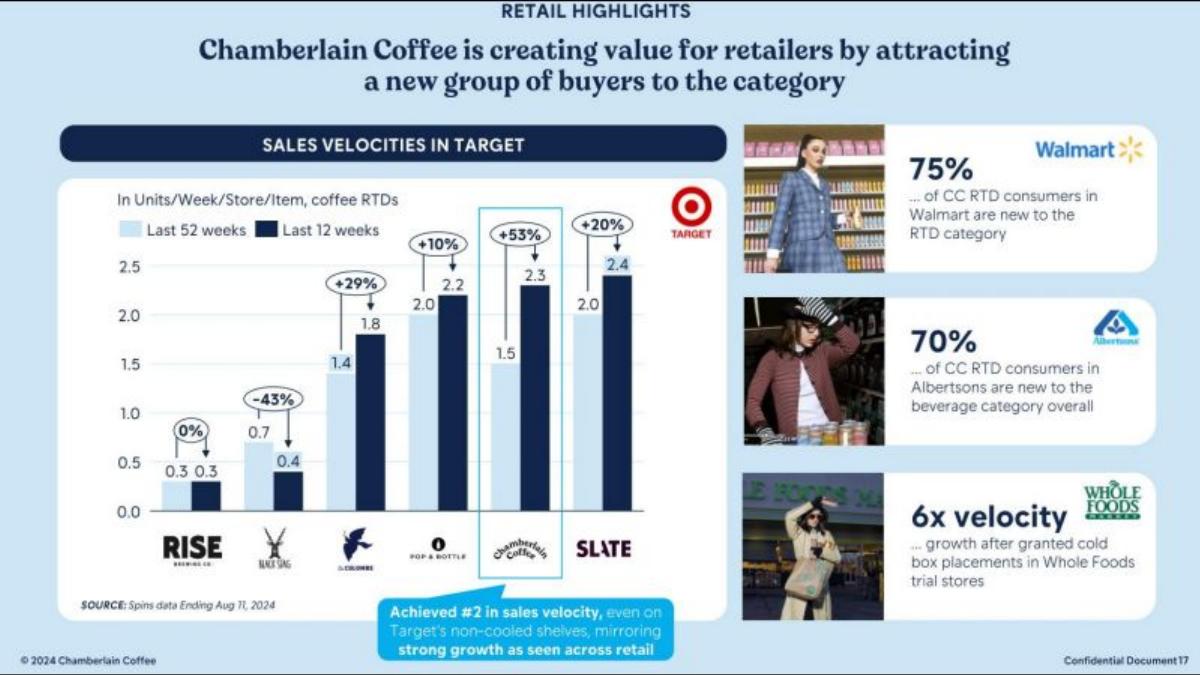
- The company achieved the #2 spot in sales velocity for coffee RTDs in Target, even on non-cooled shelves, according to slide 5.
- Total gross revenue is projected to grow from $19.2M in 2023 to $33.4M in 2025, a 53% increase from 2024 estimates on slide 7.
- Retail is now the primary growth driver, projected to account for 60% of total gross sales ($19.9M) by 2025 on slide 9.
- The matcha category is a significant secondary driver, with sales growing from $311k in 2021 to nearly $4M in 2023 on slide 10.
- A new café initiative aims for $1.8M revenue per location with a 17% EBITDA margin and zero CAPEX for the company via a JV partner on slide 11.
- The $5-10M raise is allocated primarily to promotional spend (44%) and working capital (30%) to fuel retail momentum on slide 14.
Chamberlain Coffee: From Influencer Experiment to Retail Powerhouse
Chamberlain Coffee represents a specific breed of modern CPG: the creator-led brand that successfully survives the transition to professional management and mass-market retail. This 2024 Series A extension deck, totaling 15 slides, focuses heavily on the company's '2.0' phase—moving from a purely online, DTC focus to an omnichannel strategy where retail is the dominant revenue driver. The deck is notable for its transparency regarding supply chain failures and its aggressive focus on Gen Z market data.
Slide 1: The Gen Z Opportunity
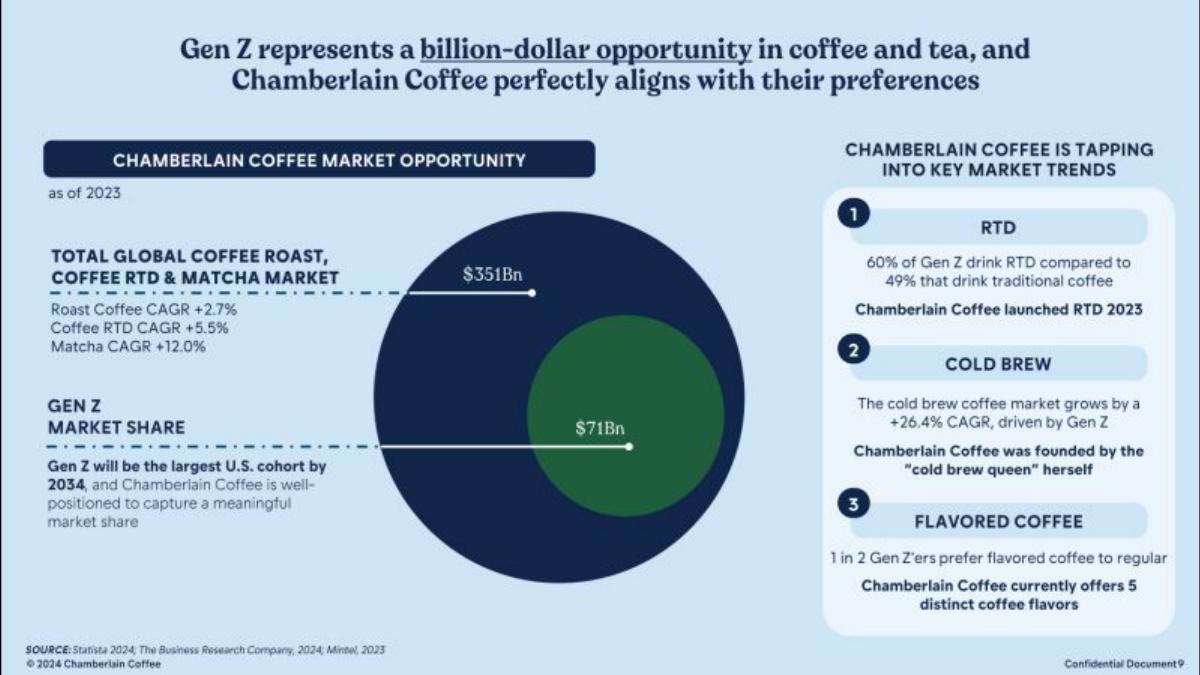
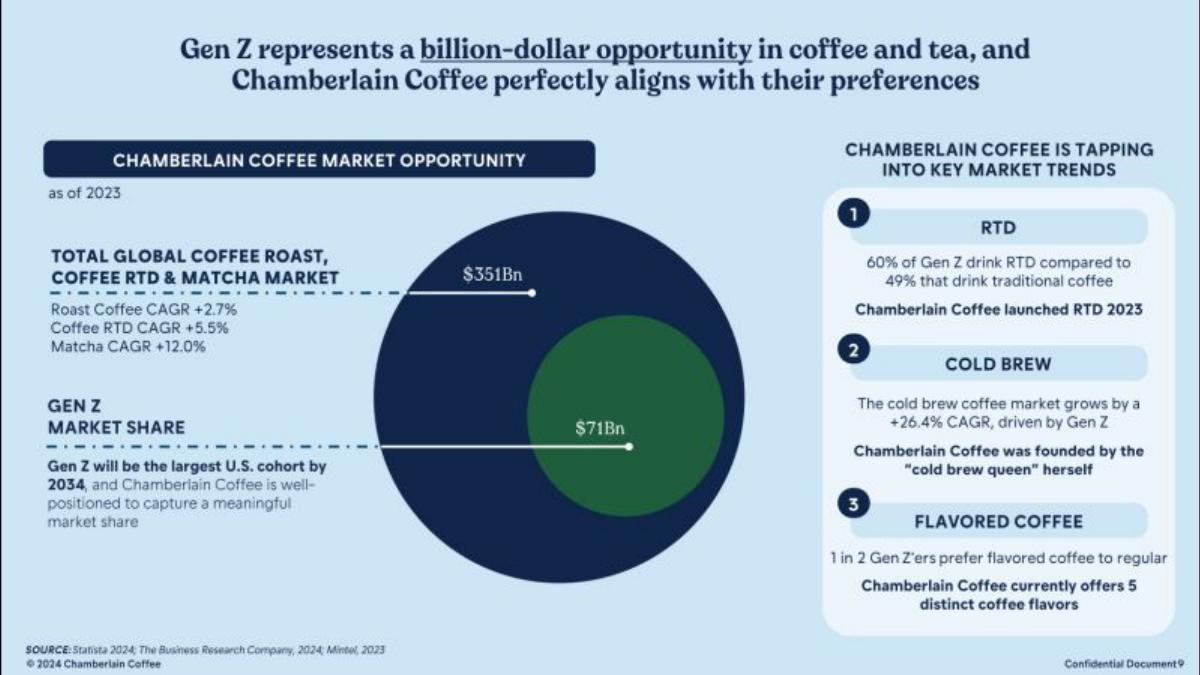
The deck opens with a market opportunity slide that defines the target demographic. It identifies a $351Bn total global coffee and matcha market, with a specific $71Bn Gen Z market share. The slide highlights three key trends: Ready-to-Drink (RTD) coffee, which 60% of Gen Z consumes; Cold Brew, growing at a 26.4% CAGR; and Flavored Coffee, preferred by 1 in 2 Gen Z consumers. This slide establishes that the brand isn't just following a founder's whim but is aligned with high-growth sub-sectors of the beverage industry.
Slide 2: Brand Traction and Engagement
This is arguably the strongest slide for a creator-led brand. It uses a survey commissioned by UTA IQ (n=2,242) to compare Chamberlain Coffee against 'third-wave' coffee giants like Blue Bottle, Stumptown, and La Colombe. While its brand awareness (49%) is slightly lower than La Colombe (54%), its social engagement rate is 5.3%, dwarfing the 1.3% seen by its competitors. This metric is crucial for investors as it proves the brand can acquire customers at a much lower cost than traditional competitors.
Slide 3: The Omnichannel Transition
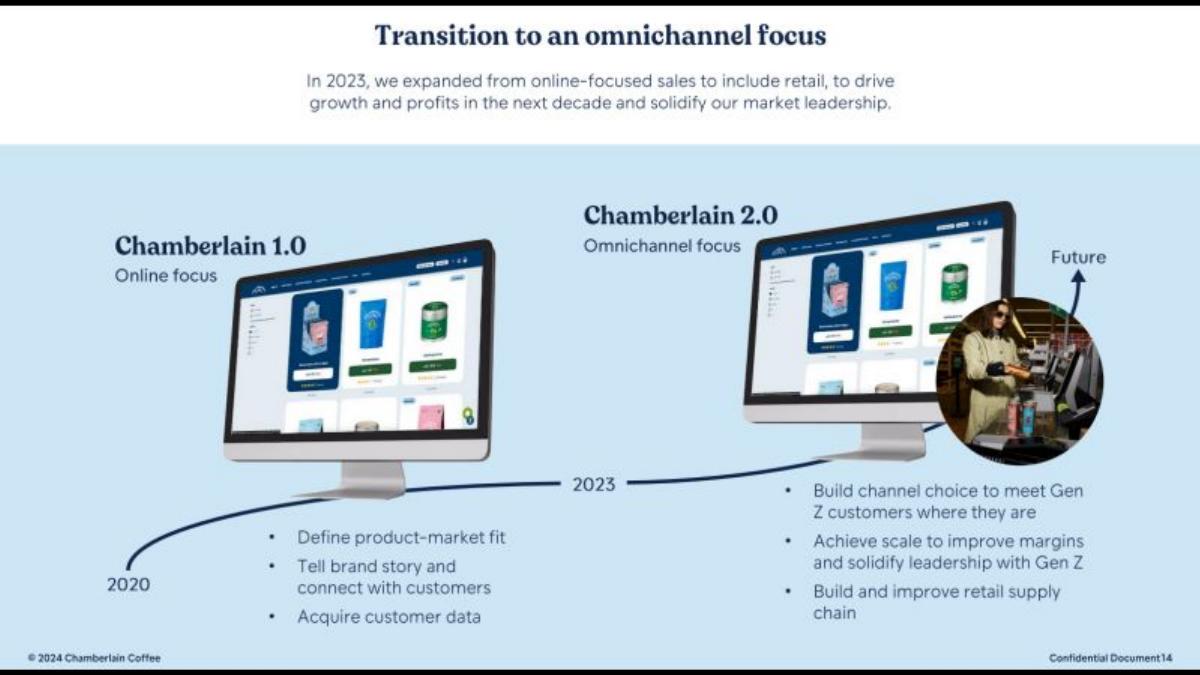
Slide 3 visualizes the evolution from 'Chamberlain 1.0' (2020-2022) to 'Chamberlain 2.0' (2023-Present). The 1.0 phase was about product-market fit and customer data. The 2.0 phase is defined by an omnichannel focus, aiming to improve margins through scale and building a robust retail supply chain. This slide signals to investors that the company has moved past the 'experimental' phase and is now focused on operational maturity.
Slide 4: Points of Distribution Growth
The data on slide 4 shows a massive expansion in physical availability. The company grew from 2,128 points of distribution (POD) in Q1 2023 to 55,086 POD in Q2 2024. A significant portion of this growth in Q2 2024 (36,658 new POD) came from new accounts and line extensions. The slide also highlights a strategic partnership with Costco, targeting $75,000 in annual sales per store across an initial 20-30 warehouses.
Slide 5: Retail Velocity and Category Incrementalism
For CPG investors, velocity (how fast a product moves off the shelf) is more important than total sales. Slide 5 shows that Chamberlain Coffee achieved the #2 sales velocity in Target for coffee RTDs, with a 53% growth in velocity over the last 12 weeks. More importantly, it claims to bring new buyers to the category: 75% of its Walmart customers and 70% of its Albertsons customers were new to the RTD or beverage categories, respectively. This 'incremental growth' is a powerful selling point for retailers.
Slide 6: 2024 Learnings
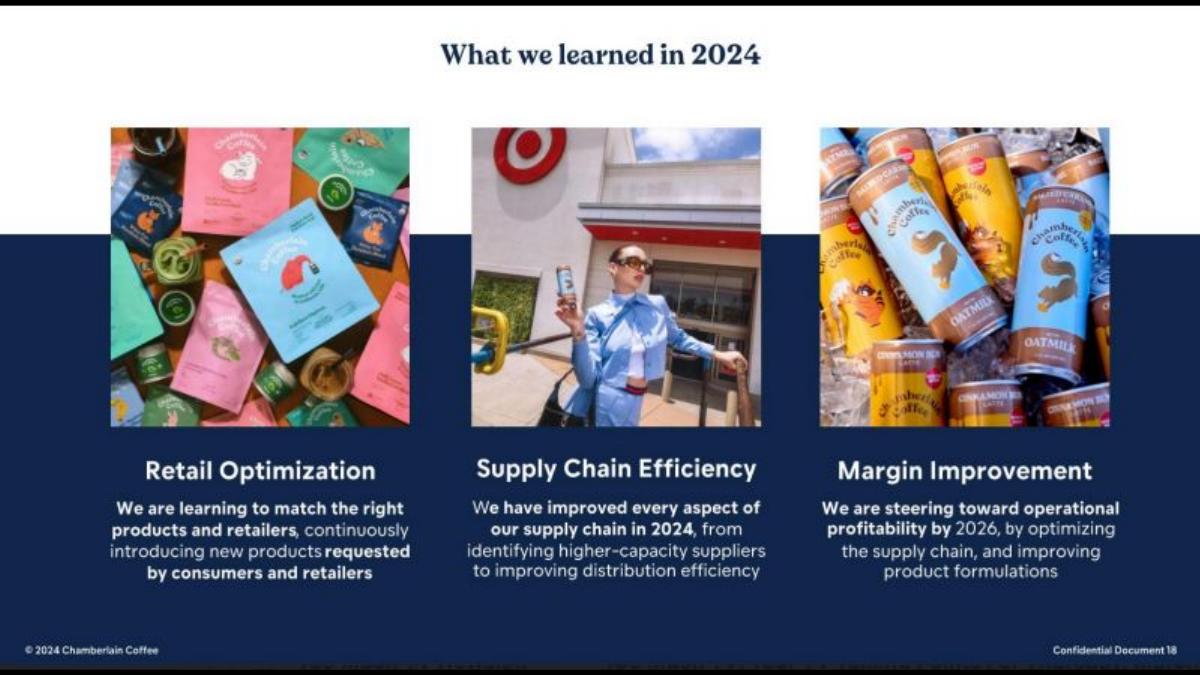
This slide serves as a transition into the operational section of the deck. It focuses on retail optimization, supply chain efficiency, and margin improvement. The company explicitly states it is steering toward operational profitability by 2026, a necessary pivot in a high-interest-rate environment where 'growth at all costs' is no longer the standard for Series A extensions.
Slide 7: Revenue Growth and Growing Pains
Slide 7 provides a transparent look at the company's financial trajectory. Revenue grew from $2.6M in 2020 to $19.2M in 2023. However, the 2024 forecast ($21.9M) shows a significant slowdown (14% growth). The deck attributes this to 'growing pains'—specifically, supply issues caused by former co-packers that led to retail stockouts. By addressing this head-on, the company builds credibility before showing a projected jump to $33.4M in 2025.
Slide 8: Supply Chain Upgrades
To solve the issues mentioned on the previous slide, the company partnered with larger-scale suppliers. Slide 8 lists their new dry co-packer and RTD co-packer, noting that these facilities also serve major brands like Starbucks, Peet's Coffee, and Black Rifle Coffee. This move is intended to reassure investors that the 'stockout' issues of 2024 are a thing of the past and that the infrastructure is ready for the 2025 growth spurt.
Slide 9: Retail Gross Revenue
This slide breaks out retail-specific revenue, showing it grew from 11% of total sales in 2021 to a projected 60% ($19.9M) in 2025. The 175% CAGR in retail revenue from 2021 to 2023 underscores the success of the omnichannel pivot. It also mentions that manufacturing margins are improving as they optimize formulations and scale up.
Slide 10: The Matcha Wave
Matcha is presented as a high-growth adjacent category. Sales grew from $311k in 2021 to nearly $4M in 2023. The company plans to launch a Matcha Latte RTD in Q1 2025, tapping into a $1.1Bn Gen Z market share for matcha. This diversification reduces the brand's reliance on coffee and leverages its existing brand equity in the 'wellness' and 'aesthetic' spaces Gen Z frequents.
Slide 11: Chamberlain Coffee Cafés
The deck introduces a physical café model as a 'low-risk, healthy ROI opportunity.' The strategy is to use cafés as marketing hubs. Crucially, the slide states there will be no CAPEX for Chamberlain Coffee, as a JV partner will fund the first five cafés. This allows the brand to have a physical 'flagship' presence without the heavy balance sheet burden usually associated with retail storefronts.
Slide 12: The Team and Investors
The team slide balances the founder's influence with CPG experience. Emma Chamberlain is listed as CEO and Founder, but the slide also features Gustav Hossy (CEO), Teri Steinbronn (VP of Sales with experience at Vital Proteins), and Jeumana Jaber (VP of Brand). The investor list includes UTA, Blazar, Volition Capital, and Agthia, showing a mix of talent agency, venture capital, and strategic CPG investment.
Slide 13: Exit Strategy
Slide 13 is a clear signal to investors about the endgame. It lists recent acquisitions in the coffee space, such as Blue Bottle (Nestlé, $625M) and La Colombe (Chobani, $900M). It explicitly states that the company is already 'on the radar' of major players like Coca-Cola, PepsiCo, and Nestlé, framing the current investment as a path toward a high-value exit.
Slide 14: Use of Funds
The final content slide outlines a $5-10M raise. The allocation is heavily weighted toward growth: 44% for promotional spend (trade spend and marketing) and 30% for working capital (inventory). Only 26% is allocated to OPEX. This is a standard 'fuel on the fire' allocation for a brand that has already established retail distribution and needs to ensure the product turns over on the shelves.
What Works in This Deck
Transparency on Failures: The admission of supply chain issues in 2024 (Slide 7) is a sophisticated move. It explains the revenue plateau and provides a logical reason for why the 2025 projection is a return to form rather than an unrealistic hockey stick.
Data-Driven Brand Power: Instead of just saying 'Emma Chamberlain is famous,' the deck uses Slide 2 to show that her brand's engagement and conversion rates actually outperform the most respected names in the coffee industry. This translates 'clout' into 'customer acquisition cost (CAC) efficiency.'
Incremental Growth Story: Proving to retailers that you aren't just stealing sales from other coffee brands but bringing new customers into the store (Slide 5) is the most effective way to secure and keep shelf space.
What Is Missing
Unit Economics Detail: While the deck mentions improving margins, it lacks a specific breakdown of Gross Margin or Contribution Margin per unit for the RTD vs. Dry Coffee lines. Investors in this stage usually want to see the 'bridge' from current margins to the 'operational profitability' promised for 2026.
DTC Performance: Since the brand started as a DTC powerhouse, the lack of data on current DTC retention rates or Lifetime Value (LTV) is a notable omission. The deck focuses so heavily on the retail pivot that it almost ignores the existing online business that built the brand.
What a Founder Should Copy
The 'Learnings' Slide: Including a slide on what you learned (Slide 6) shows maturity. It tells investors that the management team is capable of self-correction and isn't just following a static plan.
The JV Model for Expansion: The café strategy (Slide 11) is a brilliant way to show 'physical presence' without scaring off investors with high CAPEX requirements. Founders in CPG should look for similar 'asset-light' ways to build brand experience.
Visualizing the 'Points of Distribution' Growth: Slide 4 is a perfect example of how to show retail momentum. Breaking it down by 'New Accounts' vs. 'Existing POD' helps investors understand exactly where the growth is coming from.
Frequently asked questions
- How does Chamberlain Coffee compare to traditional coffee brands in terms of marketing?
- According to slide 2, Chamberlain Coffee maintains a social engagement rate of 5.3%, which is over four times higher than established brands like Blue Bottle and La Colombe (both at 1.3%). This organic reach allows the brand to achieve a 43% brand awareness-to-customer conversion rate among Gen Z purchasers, rivaling the most prominent names in the industry.
- What is the company's strategy for physical retail locations?
- As detailed on slide 11, the company is launching Chamberlain Coffee Cafés through a joint venture. This model requires zero CAPEX from Chamberlain Coffee, as the first five cafés are fully funded by a JV partner. The goal is to use these as marketing hubs to boost brand awareness while generating a projected $1.8M in revenue per café with a 17% EBITDA margin.
- What caused the revenue growth to slow in 2024?
- Slide 7 honestly addresses 'growing pains' in 2024. Despite adding 10,000 doors since early 2023, growth slowed to a projected 14% for the year due to supply chain issues caused by former co-packers. This resulted in retail stockouts, which the company claims to have resolved by partnering with larger-scale suppliers like those used by Starbucks and Peet's Coffee (slide 8).
- Which retail channels are most successful for the brand?
- Slide 5 highlights that 75% of Chamberlain Coffee RTD consumers in Walmart and 70% in Albertsons are new to those respective beverage categories. In Target, the brand achieved the #2 sales velocity for coffee RTDs. Slide 4 also notes a major opportunity with Costco, starting in 20-30 warehouses with the potential to become their largest retail partner.
- What is the long-term exit strategy for the investors?
- Slide 13 explicitly outlines an acquisition-focused exit strategy. It lists recent coffee exits like Blue Bottle ($625M) and La Colombe ($900M) as benchmarks. The deck names potential acquirers including Coca-Cola, PepsiCo, Nestlé, and Kraft Heinz, stating the company is already on the radar of several industry players.