Chartmetric’s 2021 pitch deck is a masterclass in demonstrating product-market fit through exhaustive documentation. Raising $2M in a Seed round, the company positioned itself as the essential analytical layer for a music industry drowning in 60,000+ daily song uploads. The deck leans heavily on high-fidelity app screenshots and a sophisticated TAM analysis that segments the market from major labels down to individual artists. While the version analyzed contains several redacted financial slides, the narrative remains clear: Chartmetric isn't just a tool; it's the infrastructure for A&R, mark…
Key takeaways
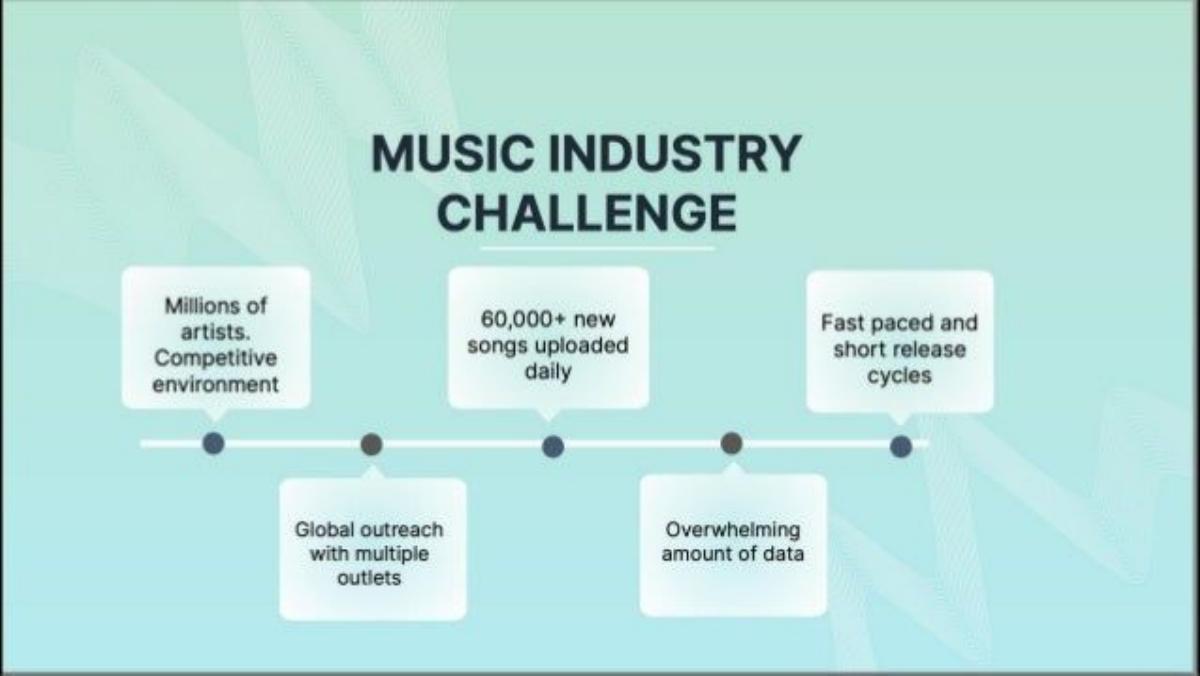
- The 'Challenge' slide identifies a massive volume problem: over 60,000 new songs are uploaded to streaming platforms daily (Slide 3).
- Chartmetric uses a three-tier pricing model—Free, Artist, and Premium—to capture the entire spectrum of industry participants (Slide 6).
- The Total Addressable Market (TAM) is calculated at $1.5 - $3 billion, specifically targeting data and analytics budgets within a larger $5 billion sector (Slide 10).
- A detailed 'Risks & Mitigants' slide addresses potential threats like data source risk and major label competition with specific counter-arguments (Slide 11).
- The product section is heavily visual, featuring seven distinct slides of app images covering artist pages, cross-platform rankings, and A&R tools (Slides 17-23).
- The company positions its 'CPP Ranking' as a proprietary solution for tracking popularity across more than 20 digital platforms (Slide 19).
- Market capture projections suggest a 1,000x growth potential in the 'Artists' segment compared to a 5x growth potential in 'Major Labels' (Slide 14).
- The deck highlights the 'recession-resistant' nature of digital streaming as a primary defense against economic volatility (Slide 11).
Introduction: The Data Layer of the Music Industry
Chartmetric’s 2021 Seed deck arrived at a pivotal moment for the music industry. With the explosion of TikTok and the continued dominance of Spotify, the industry moved from a scarcity model to an abundance model. This teardown examines how Chartmetric positioned itself as the indispensable filter for that abundance. The deck is structured logically, moving from the macro 'dilemma' of the industry to the micro 'features' of the platform.
Slides 1-4: The Challenge and The Solution
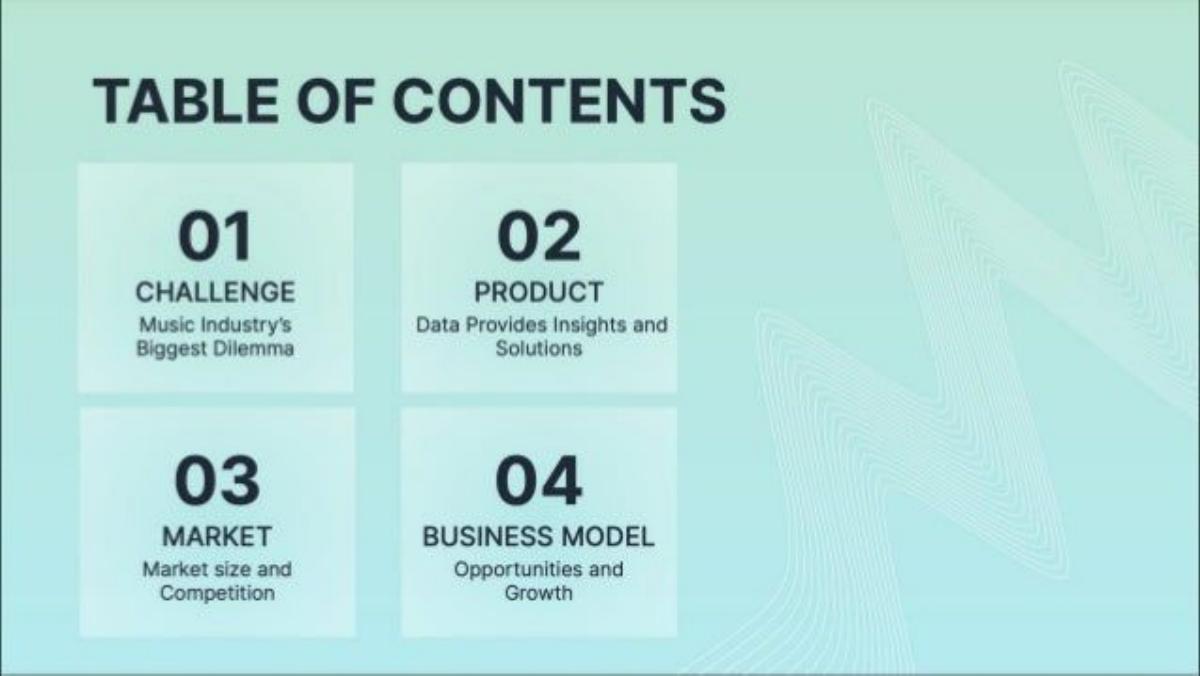
The deck opens with a clean, minimalist aesthetic. Slide 2 introduces the 'Music Industry’s Biggest Dilemma,' which is quantified on Slide 3 . The company identifies five core pressures: millions of artists, 60,000+ new songs uploaded daily, global outreach across multiple outlets, overwhelming data, and short release cycles. This 'overwhelming amount of data' is the hook. Slide 4 presents the solution in simple terms: analyzing and presenting information to provide a 'tremendous advantage' for career development. It is a classic 'pain point and aspirin' setup.
Slides 5-7: Product and Case Study
Slide 5 transitions into the product, which is immediately followed by a pricing breakdown on Slide 6 . The 'Plans' slide is crucial because it shows a diversified revenue strategy: a 'Free' tier for lead generation, an 'Artist' tier for individual creators, and a 'Premium' tier for power users. Slide 7 provides a 'Global Marketing Impact Measurement' case study. It uses a Challenge/Solution/Results framework, showing how the platform helps optimize ad spend and audience targeting by comparing similar artists. This slide is the first time we see actual data visualizations from the app, albeit in small thumbnails.
Slides 8-11: Market Size and Competitive Risks
The market section begins on Slide 8 . Slide 9 breaks down the market by 'Configuration,' noting that Digital (Streaming and Downloads) accounts for 68% of the industry. Slide 10 is one of the most effective slides in the deck. It provides a granular breakdown of the Total Addressable Market (TAM). Instead of claiming the entire music industry as their TAM, they estimate the specific 'Budget for data & analytics services' (typically 5-15% of total budgets). This results in a realistic TAM of $1.5 - $3 billion. Slide 11 is a rare 'Risks & Mitigants' slide. It addresses head-on the fear that major labels might build their own tools, arguing that labels are 'more likely to acquire an existing data analytics company than to develop a competing product from scratch.'
Slides 12-16: Business Model and Redacted Traction
Slide 12 outlines the business model through six pillars: Growth, Positioning, Talent, Promotion, and A&R Development. It frames the software as a tool for every stage of the artist lifecycle. However, the deck hits a wall for external analysts on Slides 13, 15, and 16 . These slides—covering 'Traction to Date,' 'Projected Annual Revenue,' and 'Complements'—are almost entirely redacted. We can see the labels for 'YoR ARR Growth' and 'Users in LTM' on Slide 13 , but the figures are hidden. Slide 14 , 'Market Capture,' remains visible, showing aggressive 1,000x growth projections for the 'Artists' segment, suggesting that Chartmetric sees its future in the democratization of data for independent creators.
Slides 17-23: The App Image Deep Dive
The final third of the deck is an exhaustive gallery of the platform’s interface. This is a high-conviction move; the founders are betting that the UI/UX speaks for itself. Slide 17 shows the 'Artist Page,' described as the 'most visited pages on Chartmetric.' Slide 18 highlights 'Platform Charts' from all major services in one place. Slide 19 introduces the 'CPP Rank' (Cross-Platform Performance), a proprietary metric that simplifies tracking across 20+ platforms. Slide 20 focuses on 'Artist Filters' for shortlisting by country and genre, while Slide 21 showcases 'A&R tools' for finding emerging talent based on growth patterns. Slide 22 emphasizes 'Timely Notifications' via email, and Slide 23 concludes with 'Mobile App Images' for iOS and Android, emphasizing that the tool is available 'on the go.'
What Chartmetric Does Well
The deck excels at market education . By breaking down the specific percentage of label budgets dedicated to data (Slide 10), they move away from 'hand-wavy' billion-dollar estimates and into the realm of credible financial modeling. The use of a 'Risks & Mitigants' slide (Slide 11) also builds significant trust with investors, as it shows the founders have a sober view of the competitive landscape, particularly regarding 'Data source risk.'
What is Missing from the Deck
The most glaring omission in this 23-slide sequence is a Team Slide . In a Seed round, the pedigree of the founders is often as important as the product itself. Also missing is a clear 'The Ask' slide , detailing how much they are raising and what the milestones for that capital will be. While the catalogue facts state they raised $2M, the deck itself (in this version) does not explicitly state the terms or the use of proceeds. Finally, the Unit Economics (CAC, LTV, Churn) are absent, which is surprising for a SaaS business, though these may have been in the 22 slides not included in this set.
What Other Founders Should Copy
Granular TAM: Don't just list the size of your industry. List the size of the specific budget line item you are attacking (Slide 10). · Proprietary Metrics: Chartmetric created the 'CPP Rank' (Slide 19). Creating your own 'standard' for measurement makes your tool stickier and harder to replace. · Feature-to-Value Mapping: Each app image (Slides 17-23) isn't just a screenshot; it's accompanied by a brief explanation of the specific problem that feature solves (e.g., 'Simplify popularity by using our CPP ranking system'). · Risk Transparency: Including a slide on what could go wrong—and why you are prepared for it—is a sign of maturity that appeals to institutional VCs (Slide 11).
Frequently asked questions
- What is Chartmetric's core value proposition?
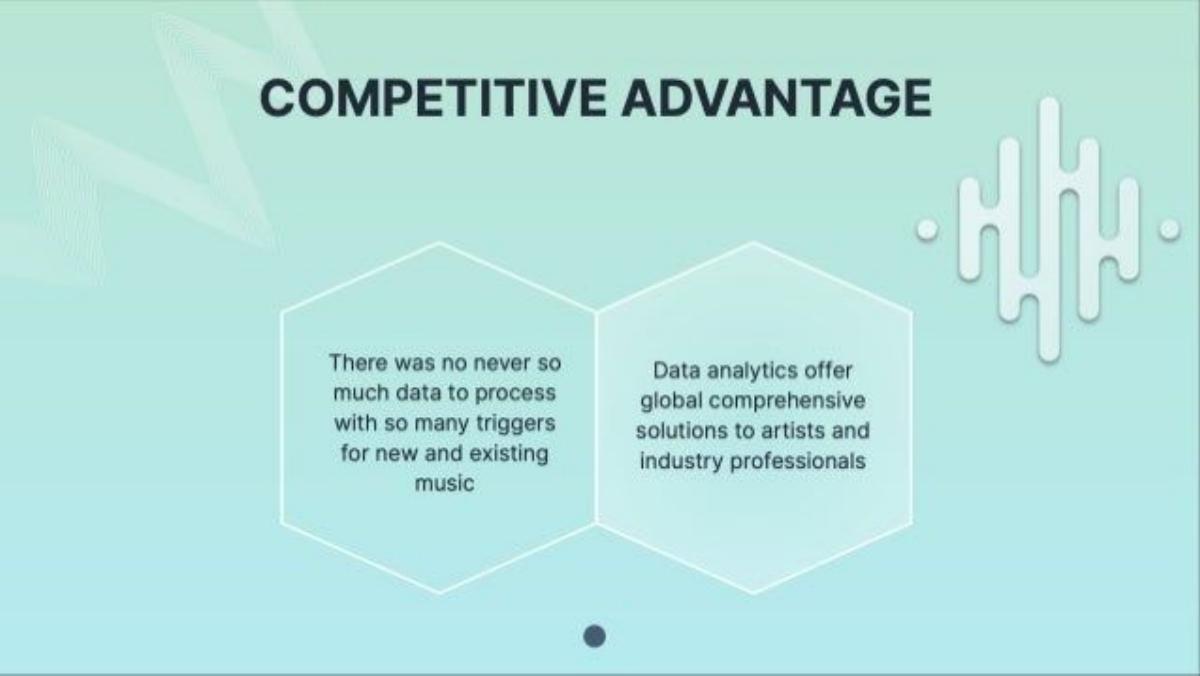
- Chartmetric positions itself as an analytical advantage for the music industry by aggregating and presenting data from over 20 digital platforms. According to Slide 4, they analyze and present information to help develop artist careers, solving the 'overwhelming amount of data' problem caused by 60,000+ daily song uploads.
- How does Chartmetric segment its market?
- The deck breaks the market into five distinct segments: Global major labels, Global indie labels, Artists and managers, Global live music, and the Non-music sector. Slide 10 estimates the total budget for data and analytics services across these segments to be between $1.5 billion and $3 billion.
- What are the main risks identified in the deck?
- Slide 11 outlines six key risks, including slower streaming growth, industry apathy, piracy, COVID-19, competition from major labels, and data source risk. They mitigate the latter by stating that data suppliers rely on Chartmetric's comprehensive mix of industry data for their own market analysis.
- What does the 'CPP Ranking' refer to?
- CPP stands for Cross-Platform Performance. As shown on Slide 19, it is a proprietary ranking system that simplifies popularity tracking across 20+ digital platforms, updating daily to provide a unified view of an artist's global footprint.
- Is there a team slide or financial data in this deck?
- The provided 23-slide sequence omits a team slide. Additionally, several key financial slides, including 'Traction to Date' (Slide 13), 'Projected Annual Revenue' (Slide 15), and 'Complements' (Slide 16), have their primary data visualizations redacted with black boxes.