The ChangeforCause deck is a real 11-slide investor deck from January 2016 raising $200,000 for a round-up charitable donation app. Its solution and technology slides are genuinely strong — real transactions on screen, Plaid and Finxera named as the rails. It fails on arithmetic: the business model slide calls one million Americans 0.003% of the population, projects $3M of revenue from a 10% fee on $50M of volume, and never shows the per-transfer cost that decides whether 13-cent round-ups can carry an ACH pull.
Key takeaways
- The ChangeforCause deck is a real 11-slide investor pitch deck built in PowerPoint 2013 on 13 January 2016, asking for exactly $200,000.
- Its business model slide states that one million donors is 0.003% of Americans; the correct figure is roughly 0.31%, an error of one hundred times in the flattering direction.
- A 10% fee on $50 million of first-year transaction volume is $5 million, but the deck's chart labels expected first-year revenue as $3 million and never explains the gap.
- The deck's own sample round-ups average 13.5 cents, so $50 million of volume implies roughly 370 million transactions in year one — an assumption the deck never states.
- The 10% fee is charged to the receiving charity, contradicting the problem slide's argument that small charities are already under-resourced.
- The market slide leads with $2.7 trillion in card volume, which the company cannot monetize, while burying the $358.4 million of proven checkout round-up giving.
- Naming Plaid and Finxera on the technology slide is a real credibility signal for a 2016 deck, but no per-transfer cost is ever attached to that architecture.
- The $200,000 ask is itemized into four line items that sum exactly, yet states no instrument, valuation, runway or milestone.
What this deck actually is
This is a real investor pitch deck, built in Microsoft PowerPoint 2013 and stamped 13 January 2016. It runs 11 slides in 16:9, weighs 330KB, and it is asking for exactly $200,000. The first slide says so out loud: "Investor Pitch Deck Presentation — Investment Opportunity."
ChangeforCause was a round-up donation app. You connect a debit card, every purchase gets rounded up to the next dollar, and the spare change goes to charities you pick. Costco for $133.73 becomes $134.00 and 27 cents goes to a cause. It is the Acorns mechanic pointed at philanthropy instead of a brokerage account, and in early 2016 that was a genuinely well-timed idea — Acorns had raised $31.96M and Digit $13.8M, both facts the deck puts on the page.
So this is not a template and not a design exercise. It is a two-person team raising a small pre-seed round on a real product concept, and the deck is short, clean and legible. That makes it a useful teardown, because the things that go wrong here are not amateur formatting mistakes. They are the specific arithmetic and diligence failures that kill small fintech rounds — a market-size slide that quotes the wrong number, a revenue chart that contradicts its own inputs, a percentage that is off by a factor of one hundred, and a payments business with no slide about payments economics or payments regulation.
Slide-by-slide walkthrough
Slide 1 — Title
"INVESTOR PITCH DECK PRESENTATION / Investment Opportunity / ChangeforCause™." Clean, dark, one mark, a trademark symbol that reappears on every subsequent slide.
What is missing is what is missing from most title slides: a one-line description of the company. A reader who receives this file cold learns the company name and that money is being asked for, but not what ChangeforCause does. The fix is one sentence under the logo — "Round up your card purchases and donate the change to any US charity" — and it costs nothing.
Slide 2 — Problem
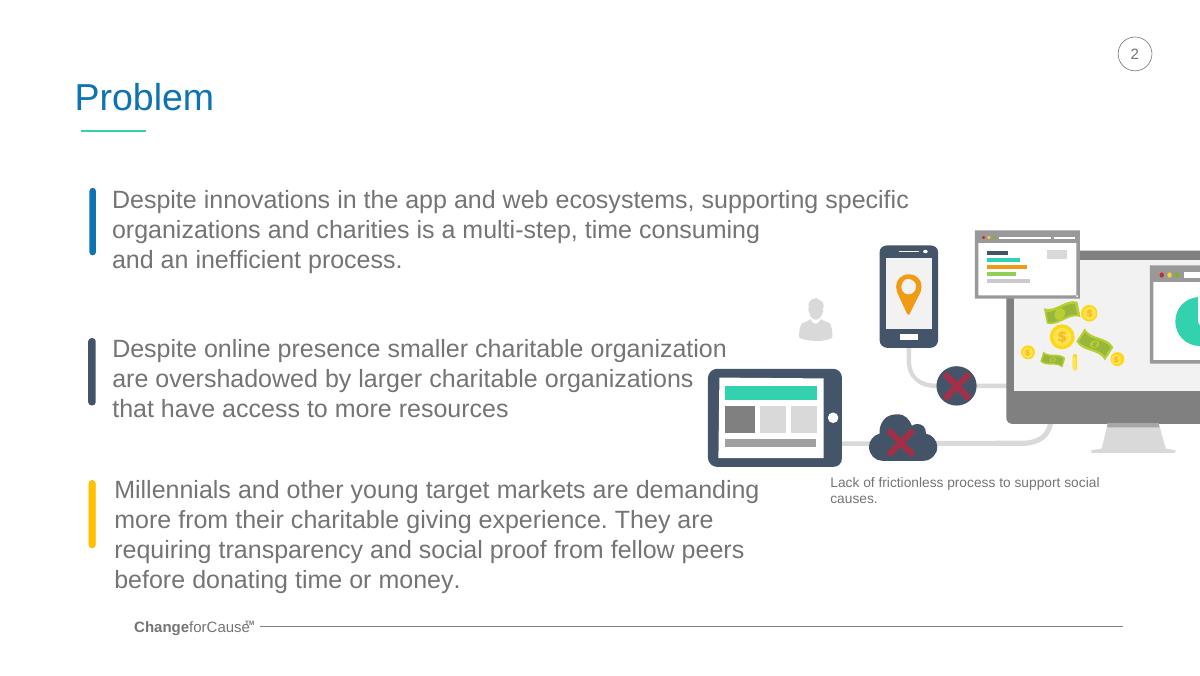
Four claims: supporting specific organizations and charities is a multi-step, time-consuming and inefficient process; smaller charitable organizations are overshadowed by larger ones with more resources; there is no frictionless process to support social causes; and millennials and other young target markets demand more from their giving experience, requiring transparency and social proof from peers before donating time or money.
The first and third claims are the same claim written twice. The second claim — small charities lose to big charities on distribution — is the most interesting one on the slide and the deck never returns to it. The fourth is a demographic assertion with no source under it.
The bigger structural issue: none of these are quantified. "Multi-step" is not a number. A problem slide in a donations business has obvious numbers available — average online donation abandonment, the share of giving that goes to the top 1% of nonprofits, the processing fee a small charity pays today. None appear.
Slide 3 — Solution
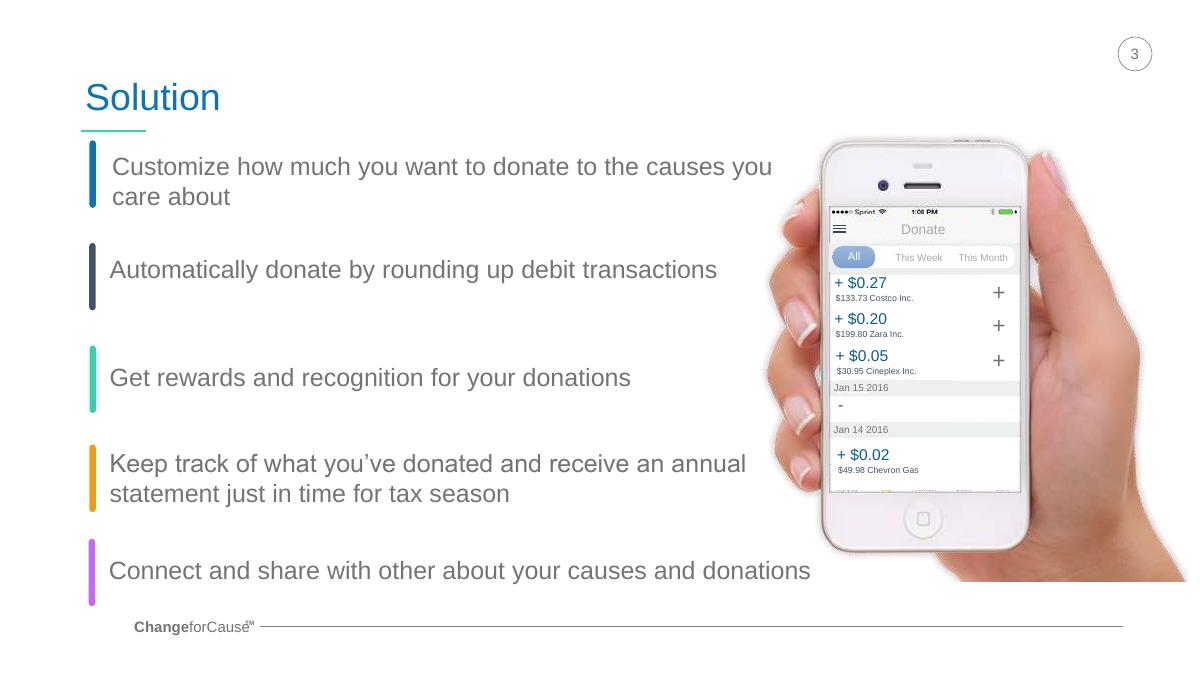
This is the best slide in the deck. Five capability lines run down the left — customize how much you go to the causes you care about, automatically donate by rounding up debit transactions, get rewards and recognition for your donations, keep track of what you have donated and receive an annual statement in time for tax season, connect and share with others about your causes — and on the right there is an actual product screen with actual transactions.
The screen shows a Donate view with All / This Week / This Month tabs and a real ledger: Costco Inc. $133.73 rounding up $0.27, Zara Inc. $199.80 rounding up $0.20, Cineplex Inc. $30.95 rounding up $0.05, Chevron Gas $49.98 rounding up $0.02, dated 14 and 15 January 2016.
Concrete beats abstract every time. An investor reading this understands the product in four seconds without a demo. And the annual tax statement line is a genuinely sharp insight — the tax receipt is the retention mechanic in charitable giving, and most round-up competitors of that era treated it as an afterthought.
One thing the ledger quietly reveals, though: the four sample round-ups total $0.54 across four transactions, an average of 13.5 cents. Hold that number. It becomes the deck's central unsolved problem three slides later.
Slide 4 — Technology
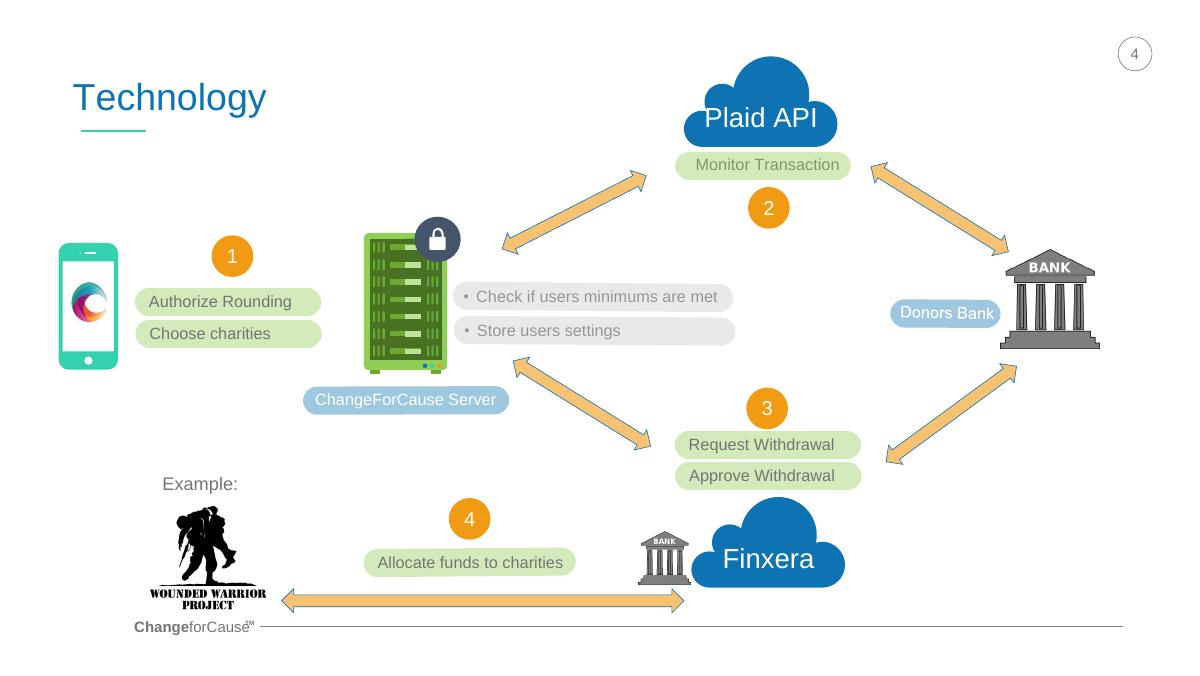
A four-step architecture diagram, and it is more credible than anything most pre-seed decks put on a technology slide. Step 1: authorize rounding and choose charities. Step 2: Plaid API monitors transactions. Step 3: the ChangeForCause server checks whether the user's minimum is met and stores user settings, then requests withdrawal. Step 4: Finxera approves the withdrawal and allocates funds to charities.
Naming Plaid and Finxera does real work. It tells an investor the founders have researched how money actually moves, that they are not planning to build bank connectivity themselves, and that there is a licensed money-movement partner in the loop rather than a founder holding donor funds in a personal account. In January 2016 Plaid was still a relatively inside-baseball reference; using it correctly signals that someone did the homework.
What the slide does not do is cost anything out. Plaid charges per connected item. Finxera charges per transfer. Every ACH pull has a floor cost measured in tens of cents. The architecture is right and the economics of that architecture are absent, which becomes fatal on slide 8.
Slide 5 — Market size
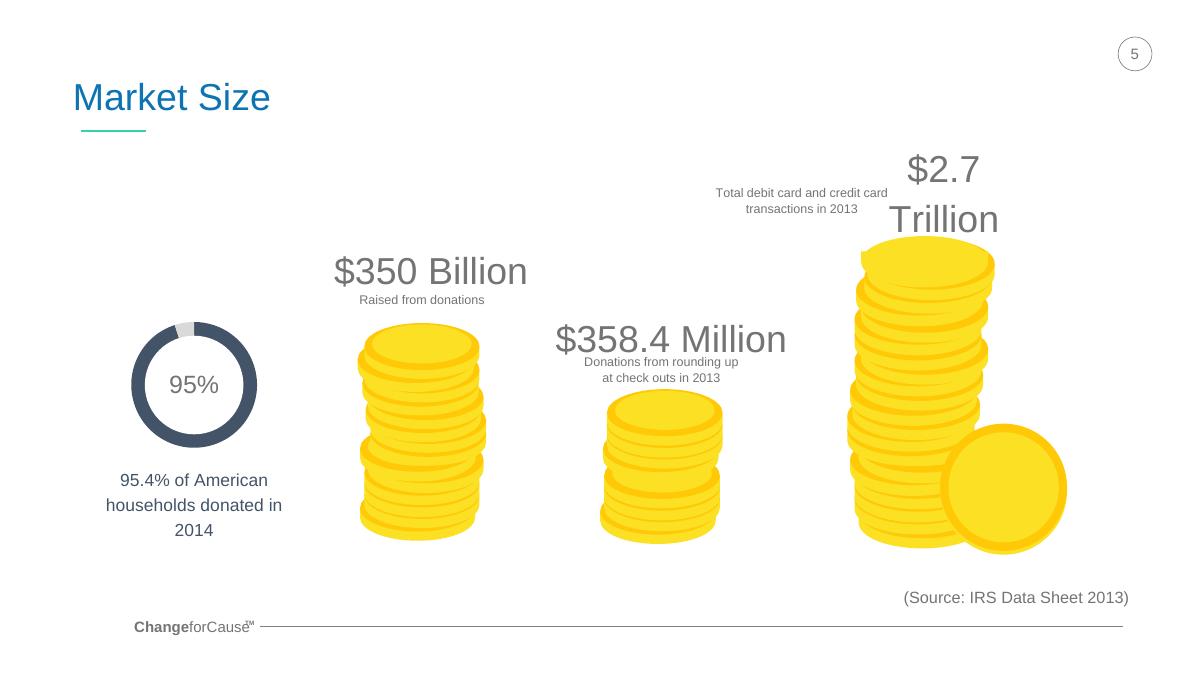
Four numbers, sized by visual prominence rather than relevance: $2.7 trillion in total US debit and credit card transactions in 2013; $350 billion raised from donations; $358.4 million donated from rounding up at checkouts in 2013; and 95.4% of American households donated in 2014. The source line reads "IRS Data Sheet 2013."
First, the citation does not match the claim. A 2013 IRS data sheet cannot be the source for a 2014 household-giving figure, and the single source line is attached to four numbers from what must be at least three different places.
Second, the numbers are stale in a deck dated 2016 — 2013 card volume presented in January 2016 is two reporting years behind, and card volume was growing fast enough that the gap was noticeable.
Third and worst, the biggest number is the least relevant one. $2.7 trillion in card volume is not ChangeforCause's market; the company earns nothing on the purchase, only on the round-up. The genuinely useful number on this slide is the small one: $358.4 million already donated through checkout round-ups in a single year. That is proof the behavior exists at scale, which is exactly what an investor needs to believe. It is printed smaller than a number the company cannot monetize.
Slide 6 — Competition
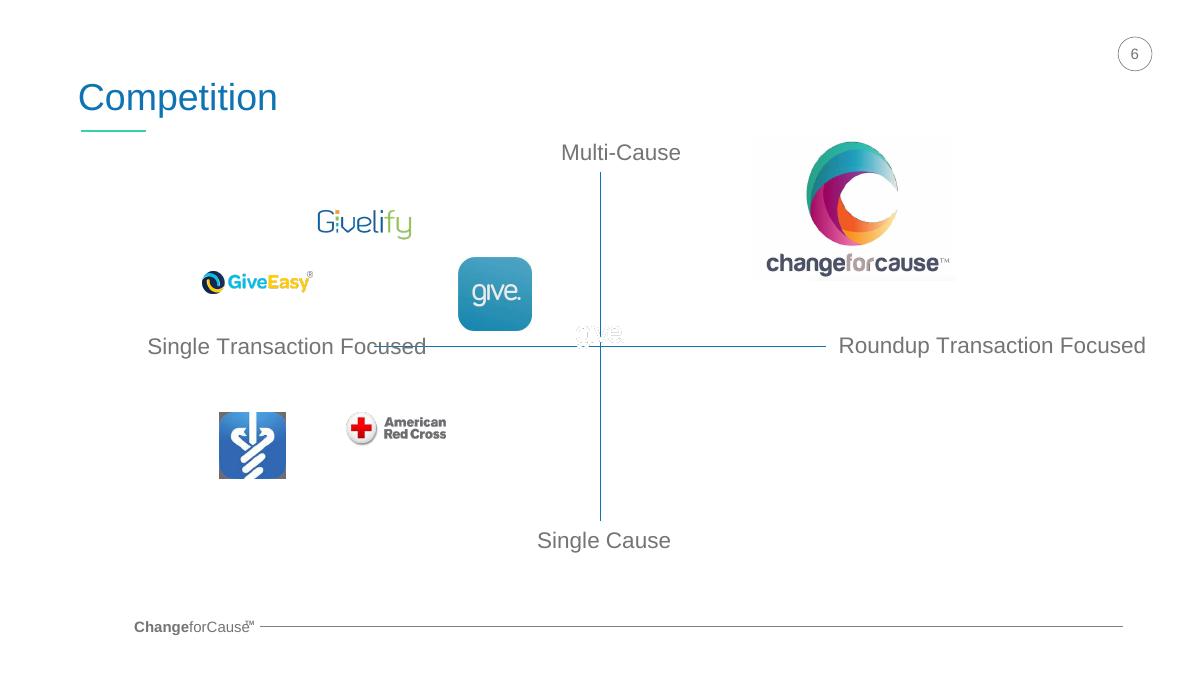
A 2x2 with the axes labelled Multi-Cause to Single Cause on one dimension and Single Transaction Focused to Round-up Transaction Focused on the other. Three logos are placed on it: Givelify, GiveEasy, and ChangeforCause in the upper-right quadrant.
The quadrant is honestly constructed — the axes are real product dimensions rather than the usual "innovative vs. legacy" — but the field is nearly empty. Two competitors is not a competitive landscape for donation apps in 2016. Missing from the chart: the round-up mechanic's actual originator, Bank of America's Keep the Change, which launched in 2005 and had already trained tens of millions of Americans to round up; every donate-button processor a charity was already paying, from Network for Good to Blackbaud; PayPal Giving Fund; and the other round-up-for-charity apps that existed at the time.
An empty quadrant chart reads as insufficient research, not as open field. And the omission of the bank round-up products is the dangerous one, because the first question a fintech investor asks about a round-up app is "why doesn't the bank just do this," and the deck never raises the question, let alone answers it.
Slide 7 — Competitive advantage
Four bullets: the convenient round-up process makes setting aside money hassle-free; tailored for all budgets to be philanthropic; earn real rewards from major brands for your donations; choose from 1.9 million different charitable organizations.
Two of these are restatements of the solution slide, not advantages — convenience and budget accessibility are features every competitor on the previous slide also claims. The third, rewards from major brands, is the only genuine differentiator on the page, and it is a single line with no named brand, no signed partner, and no explanation of who funds the reward. If a brand is subsidizing donor rewards, that is a second business model and it deserves its own slide.
The fourth bullet — 1.9 million charities — is a coverage claim that is really a data claim. There were roughly that many registered US nonprofits; being able to route to any of them means having their EIN data and a disbursement path, not having relationships. Stated as an advantage, it invites the question of whether any charity had actually signed up. The deck never says one had.
Slide 8 — Business model
This is where the deck loses the room. The headline model: a 10% fee on all transactions, charged to the organization receiving the funds. Around it sit a vision paragraph about democratizing philanthropic giving, a note about corporate accounts and a white-label option so charitable fundraisers can create their own round-up experience, and a revenue chart.
The chart's inputs, as printed: "1 million donors or 0.003% of Americans," expected transactions of $50 million in the first year, an axis running to $9,000,000, a "$3,000,000" callout labelled expected first-year revenue, and a line for estimated active donors at 1,000,000 users per month.
The percentage is wrong by a factor of one hundred. One million people is about 0.31% of the roughly 320 million Americans alive in 2016, not 0.003%. The error runs in the flattering direction — it makes the target look a hundred times more modest than it is. An investor who catches this, and a fintech investor will catch it in seconds, stops trusting every other number in the file.
The revenue does not reconcile. Ten percent of $50 million is $5 million. The chart says $3 million. Either the fee is not 10%, or the transaction volume is not $50 million, or the first year is partial. The deck does not say which, and no reader should have to guess.
The volume is arithmetically enormous. Slide 3's own sample round-ups average 13.5 cents. Fifty million dollars of donation volume at roughly 13 cents a round-up is something on the order of 370 million individual transactions in year one. Across a million donors, that is a card swipe every day per person, every day of the year, with every single one rounding up and every user staying active for twelve months. Nothing on the slide acknowledges this.
The take rate points at the wrong payer. Charging the receiving charity 10% is well above what nonprofits were used to paying for online donation processing, and small charities — the constituency slide 2 said were being overshadowed — are exactly the ones least able to absorb it. Meanwhile the donor, who is the one getting the convenience and the rewards, pays nothing. This is the model that needed the most defending and it gets one line.
And the cost side is entirely absent. Plaid connections, Finxera transfers and ACH pulls all cost real money per event. On a 13-cent round-up, a 10% fee is 1.3 cents of revenue against a transfer cost measured in tens of cents. The only way this business works is batching — accumulating round-ups until a user's threshold is met and pulling once. Slide 4 actually shows that logic ("check if users minimums are met"), which means the founders understood it. Slide 8 never connects the two, so the deck never proves it has positive unit economics.
Slide 9 — Validation
A survey of 100 respondents who demoed the app on iOS and watched the marketing video. Four results: 95% ease of use of the iOS app; 65% enjoyed the ease of donating; 64% preferred the digital trace, receipt and monthly statement of donations; 52% would use it and donate. Underneath: "The general public is demanding/wanting round up features for areas in their lives that require setting aside money," with the Acorns and Digit logos and their raise totals, $31.96M and $13.8M.
Having any validation slide at pre-seed is above average, and the comparable-raise anchoring is a smart way to argue the behavior thesis without owning the data yourself.
But the presentation order inverts the importance. The number that matters is the last and smallest: 52% would use and donate. The other three measure whether people liked a demo, which is close to free. And 52% intent from a self-selected group of 100 people who just watched a marketing video is, in practice, a low number — stated intent in giving surveys converts at a fraction of what respondents claim. A stronger version of this slide reports the 52% first, states how respondents were recruited, and then shows one real behavioral data point, even a tiny one: how many of the demo group actually connected a card.
There is also an unexplained tension between this slide and the next. Respondents demoed a working iOS app in the survey, but the ask funds "development for public beta." Prototype and beta are different things and the deck should say which existed.
Slide 10 — Investment opportunity
$200,000, itemized: $115,000 development for public beta, $40,000 licensing and legal fees, $35,000 marketing costs, $10,000 reserve. The four lines sum to exactly $200,000, which is more discipline than most decks manage.
What is not here is everything that makes an ask investable. No instrument — equity, SAFE, convertible note. No valuation or cap. No equity percentage on offer. No runway length, so a reader cannot tell whether $200,000 buys six months or eighteen. And no milestone: what is true about the company when this money is spent, and what does that unlock in the next round?
The $40,000 licensing and legal line is the most revealing item on the slide, because it is the only acknowledgment anywhere in the deck that this business has a regulatory surface — money transmission, ACH authorization, state charitable-solicitation rules, 501(c)(3) verification, donor tax receipting. That surface deserved its own slide. Instead it is a budget line with no explanation of which licences, in which states, on what timeline.
And the marketing figure fights slide 8. Thirty-five thousand dollars of marketing against a plan for one million donors implies a fully loaded acquisition cost of 3.5 cents per donor. The deck presents both numbers and never notices they cannot both be true.
Slide 11 — Team
Two people. Teddy Stanowski, CEO and Founder, an entrepreneur since 2009 across internet marketing, alcohol beverage, restaurant and pet industries, described as bringing experience across marketing, finances, system efficiencies and sales, with a stated desire to make an impact on the world. Calvin Mann, CTO and Business Development, primarily a software developer and business developer, lead developer of a software team for over six years, a mentor to new hires, and previously co-founder of PupCrate.com.
The bios are honest and specific about what these two have actually done, which is better than the usual vague seniority claims. But read as an answer to "why this team for this business," they do not land. This is a payments company touching bank data, ACH rails and charitable-giving compliance, and neither bio mentions payments, banking, fintech or the nonprofit sector. The prior ventures are consumer and hospitality.
The fix is not to invent experience. It is to name the gap and close it visibly: an advisor from payments compliance, a named counsel for the licensing work the ask already budgets for, or one line explaining what the six-year lead developer built that maps to financial infrastructure.
What this deck does better than most startup pitch decks
Eleven slides. The whole argument fits in eleven pages with no filler, no table of contents, no SWOT grid and no thank-you slide padding. Most decks this early run twenty-five. · The solution slide shows the product, not adjectives. Four real transactions with real merchants and real round-up amounts explain the entire company faster than any paragraph could. · The technology slide names its vendors. Plaid and Finxera in a January 2016 deck is a credibility signal — it says the founders know how money actually moves and are not planning to rebuild the rails. · The ask is itemized and it sums correctly. Four line items, exactly $200,000, no rounding fudge. That basic arithmetic discipline is rarer than it should be. · There is a validation slide at all. Most pre-product decks have zero primary research; this one at least ran a hundred demos and reported the results. · The comparable-raise anchoring is well chosen. Acorns and Digit with their raise totals argue the round-up behavior thesis using other people's proven capital, which is the right move when you have none of your own.
Where this deck would fail in an investor meeting
A 100x arithmetic error on the headline projection slide. One million Americans is 0.31%, not 0.003%. Once a reader finds one, they audit everything. · Revenue that does not reconcile with its own inputs. 10% of $50 million is $5 million; the chart shows $3 million; nothing explains the gap. · No unit economics. A 13-cent round-up carrying a 10% fee produces 1.3 cents of revenue against per-transfer costs an order of magnitude higher. Batching solves it; the deck never shows the batching math. · The take rate is charged to the party least able to pay it. Ten percent to the receiving charity contradicts the deck's own stated mission of helping small organizations. · Market size leads with the number the company cannot monetize. $2.7 trillion in card volume is prominent; the $358.4 million of proven round-up giving is small type. · A source line that does not support its claims. One "IRS Data Sheet 2013" citation under four figures including a 2014 statistic. · Two competitors on a 2x2, with bank round-up programs and every incumbent donation processor missing. The obvious "why won't a bank do this" question is never raised. · No regulatory slide. Money transmission, ACH authorization, state charitable-solicitation registration and tax receipting are reduced to a $40,000 budget line. · An ask with no instrument, no valuation, no runway and no milestone. The number is precise; the terms are absent. · $35,000 of marketing against a one-million-donor plan. Three and a half cents per acquired donor, unremarked. · No traction slide. No signed charities, no waitlist, no beta users, no letters of intent — only survey intent. · A team with no payments or nonprofit background, in a payments-and-nonprofit business, and no advisors named to cover the gap.
2016 pre-seed fintech deck vs. what the same raise needs today
Problem Four unsourced assertions about friction and millennials One quantified problem with a cited source and a named victim
Solution Real product screen with real transactions Unchanged — this still works
Market $2.7T card volume as the hero number Bottom-up: donors reachable x average annual round-up x take rate
Competition 2x2 with two named competitors Named incumbents including the bank and processor options, plus why they will not do it
Business model "10% fee" and a chart Revenue per active donor per month, cost per transfer, contribution margin, break-even donor count
Regulation A $40,000 legal budget line Its own slide: licensing path, partner bank or MTL strategy, charity verification, tax receipting
Traction 100-person survey, 52% stated intent Any behavioral number — cards connected, dollars moved, charities signed
Ask $200,000 in four line items Same four line items plus instrument, cap, runway in months, and the milestone it buys
Team Two generalist founders Same two, plus a named payments or nonprofit advisor and the founder-market-fit sentence
How you would rebuild this deck in eleven slides
Title, with one sentence of description. "Round up your card purchases and give the change to any of 1.9 million US charities." The reader should never have to reach slide 3 to learn what you do. · Problem, with one number. Pick the strongest of the four claims — small charities lose on distribution — and put a cited figure behind it. Delete the other three. · Solution. Keep this slide exactly as it is. It is the best page in the file. · Behavior proof, promoted from the market slide. $358.4 million already given through checkout round-ups in one year, plus Acorns and Digit as evidence the mechanic scales. Lead with proof of behavior, not with the size of a market you do not touch. · Market, rebuilt bottom-up. Reachable donors times average annual round-up dollars times your take rate. One line of arithmetic the reader can check. Cite each input separately. · Business model with unit economics. Revenue per active donor per month, cost per ACH pull, how batching gets the cost per dollar moved below the fee, and the number of active donors at which the company breaks even. Fix the 10%-of-$50M-is-$5M contradiction, and explain why the charity pays rather than the donor — or change who pays. · Technology. Keep the Plaid and Finxera architecture, and add the per-event cost of each hop so it doubles as evidence for slide 6. · Regulation and trust. Which licences, which states, which partner holds funds, how a 501(c)(3) is verified, how the donor gets a valid tax receipt. In a business that moves other people's money to charities, this slide converts skeptics. · Competition. The same 2x2 with the bank round-up programs and the incumbent donation processors placed on it, and one line on why each will not or cannot do this well. · Traction and validation. Lead with the 52% intent figure and the recruitment method, then any behavioral number you have, however small. · Ask. The same four line items, plus instrument, cap, runway in months, and the single milestone $200,000 buys.
Team moves onto the ask slide or into an appendix. Eleven slides in, eleven slides out — the changes are all substitutions, not additions.
The transferable lesson
Nothing on the list above required more capital, a better designer or a longer deck. Every one of ChangeforCause's fatal problems was findable with a calculator and twenty minutes.
One million is 0.31% of 320 million. Ten percent of fifty million is five million, not three. Thirty-five thousand dollars divided by a million donors is three and a half cents. A thirteen-cent round-up at a 10% fee earns 1.3 cents, and an ACH pull costs more than that. Four numbers, four contradictions, all of them printed on the founders' own slides — and all of them checkable before the file was ever sent.
That is what most investor rejections actually are. Not a disagreement about the vision, but a reader finding an internal contradiction on page eight and quietly deciding that if this number is wrong, the others probably are too. The deck stops being an argument and becomes an audit.
So the question worth asking about your own deck is not whether it looks good. It is whether every number on it survives contact with the number three slides earlier. Do your market size, your pricing, your volume assumption and your marketing budget all describe the same company? If any two of them disagree, an investor will find it — and they will find it faster than you think.
Frequently asked questions
- What was ChangeforCause?
- ChangeforCause was a round-up charitable donation app pitched in January 2016. Users connected a debit card, each purchase was rounded up to the next dollar, and the spare change was donated to charities they selected. The deck describes rewards from brands, an annual tax statement, and social sharing, with Plaid monitoring transactions and Finxera moving funds to charities.
- Is the ChangeforCause pitch deck a real investor deck?
- Yes. The file is titled Investor Pitch Deck Presentation, was created in Microsoft PowerPoint 2013 and stamped 13 January 2016, runs 11 slides, and asks for $200,000 broken into $115,000 for development of a public beta, $40,000 for licensing and legal fees, $35,000 for marketing and a $10,000 reserve.
- How much was ChangeforCause raising and on what terms?
- The ask is $200,000, itemized across four line items that sum exactly to that figure. The deck states no instrument, no valuation or cap, no equity percentage, no runway length and no milestone the money buys, which are the four things that make a small pre-seed ask investable.
- What is the biggest mistake in the ChangeforCause deck?
- The business model slide describes one million donors as 0.003% of Americans. One million people is about 0.31% of the roughly 320 million US population in 2016, so the figure is wrong by a factor of one hundred, in the direction that makes the target look easier. The same slide projects $3 million of revenue from a 10% fee on $50 million of volume, which should be $5 million.
- Which slides in the ChangeforCause deck should founders copy?
- Two of them. The solution slide shows an actual product screen with real transactions — Costco $133.73 rounding up 27 cents, Zara $199.80 rounding up 20 cents — which explains the company in four seconds. The technology slide names Plaid and Finxera and shows the four-step flow, which signals the founders understood how money actually moves.
- Why do round-up donation apps struggle on unit economics?
- Because the individual amounts are tiny and the transfers are not free. The deck's own examples average about 13.5 cents per round-up, so a 10% fee earns roughly 1.3 cents while an ACH pull costs far more. The only way the model works is batching round-ups until a user threshold is met and pulling once, and the ChangeforCause deck never shows that math.