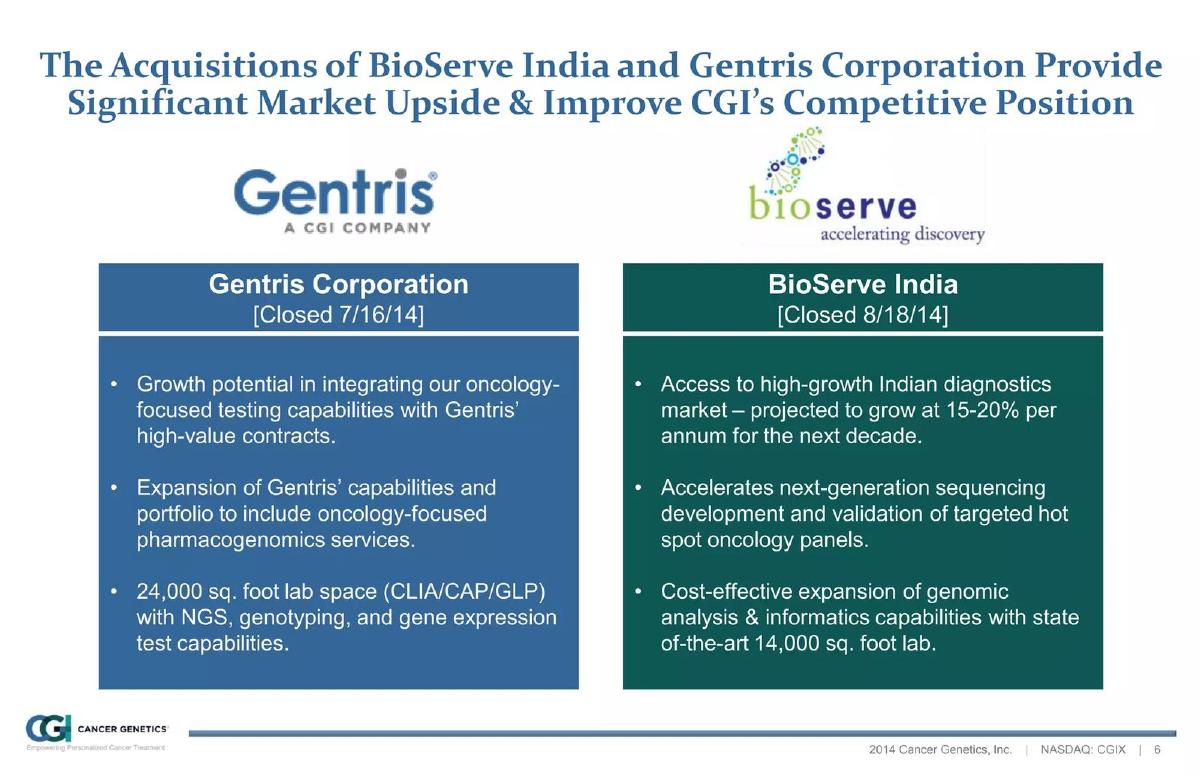
The October 2014 investor presentation for Cancer Genetics (NASDAQ: CGIX) serves as a comprehensive overview of a publicly traded biotech company scaling its clinical impact. With a focus on hematological, urogenital, and gynecological cancers, the company reported a 54% full-year revenue growth in 2013, reaching $6.61 million. The deck emphasizes the shift from traditional pathology to genomic-based personalized medicine, claiming a target success rate of 100% compared to the current 25%. Key growth drivers identified include the acquisition of Gentris and Select One, which expanded their cl…
Key takeaways
- The company targets three primary oncology segments representing over 615,000 new U.S. cases annually (Slide 9).
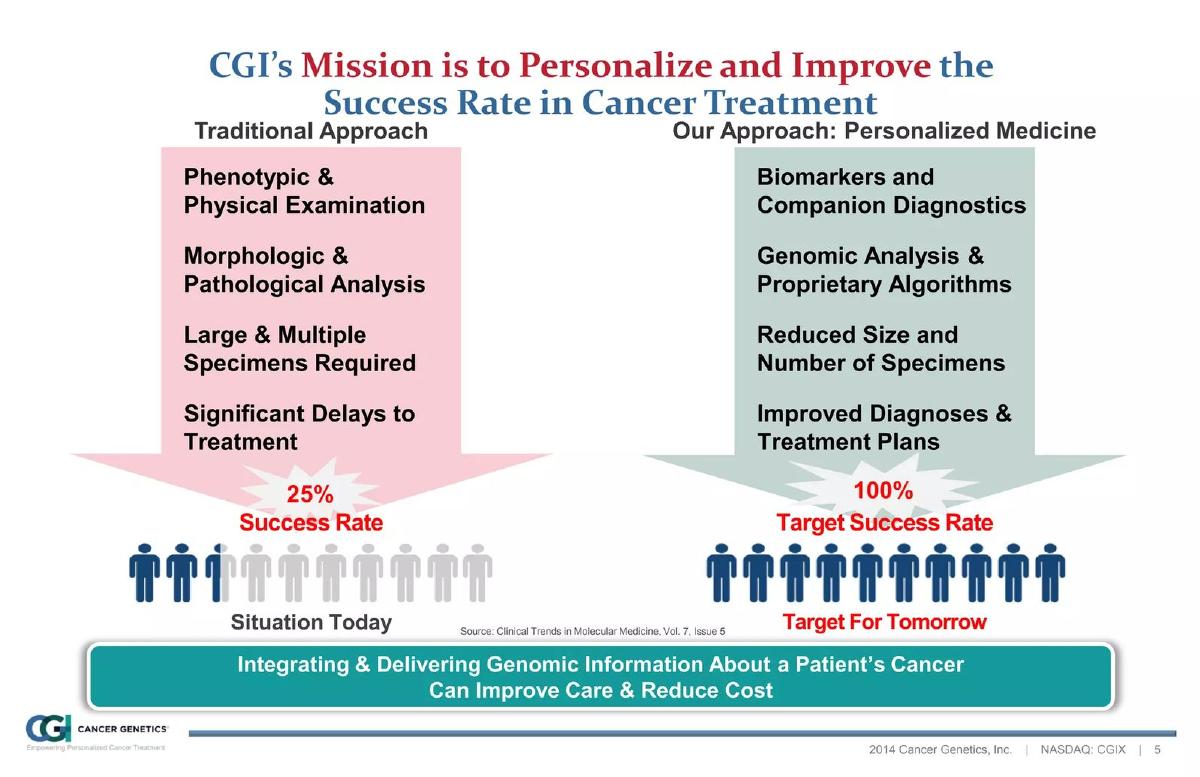
- CGI claims their personalized medicine approach can improve cancer treatment success rates from 25% to a target of 100% (Slide 5).
- Clinical validation for the MatBA-CLL/SLL product involved 2 datasets and 322 specimens in collaboration with North Shore LIJ (Slide 13).
- M&A activity through Gentris and Select One drove contract values from $300k in 2011 to $18 million in 2014 (Slide 21).
- Revenue grew from $1.67 million in 2009 to $6.61 million in 2013, representing a 54% growth rate in the final year (Slide 29).
- The company maintains a diversified revenue mix with 58% coming from direct-bill companies, hospitals, and care facilities (Slide 33).
- A strategic partnership with AstraZeneca focuses on biomarker and molecular testing in Central America and the Caribbean (Slide 25).
- The FHACT product is marketed as the only 4-color FISH probe usable for cervical cancer screening before colposcopy (Slide 17).
Executive Summary
The October 2014 investor presentation for Cancer Genetics (CGIX) represents a company at a critical inflection point. Having established a foothold in the genomic testing market, CGIX used this deck to communicate its transition from a niche diagnostic provider to a comprehensive oncology partner for both clinicians and pharmaceutical companies. The deck is heavily weighted toward clinical validation and market sizing, reflecting the high-stakes nature of the biotech sector where scientific proof is the primary currency of trust.
Slide 1: Title and Positioning
The cover slide establishes the company's core mission: "Empowering Personalized Cancer Treatment." It prominently features the NASDAQ ticker (CGIX), signaling its status as a publicly traded entity. The visual use of a DNA double helix reinforces the focus on genomics. This is a standard but effective entry point that immediately categorizes the company within the life sciences and personalized medicine sectors.
Slide 5: The Mission and Paradigm Shift
This slide sets the stage for the company's "Why." It contrasts the "Traditional Approach" (phenotypic exams, significant delays, 25% success rate) with "Our Approach" (genomic analysis, proprietary algorithms, 100% target success rate). While a 100% success rate is an aspirational target rather than a current metric, the slide effectively communicates the inefficiency of the status quo. By highlighting "Reduced Size and Number of Specimens," CGIX appeals to the clinical need for less invasive and faster diagnostics.
Slide 9: Target Markets and Opportunity
CGIX defines its Total Addressable Market (TAM) with specificity. They break down the U.S. oncology testing market into three pillars: Hematological, Urogenital, and Gynecological. The slide quotes a combined "Over 615,000 New Lives Annually" and a death rate ranging from 16% to 35% across these categories. Crucially, it identifies a $6 billion annual U.S. spend on lab testing in these segments, providing a clear financial scale for the opportunity. The mention of "6 Products Launched" indicates that the company is past the R&D phase and into commercialization.
Slide 13: Clinical Validation - MatBA-CLL/SLL
This is a technical slide intended for sophisticated investors and clinicians. It compares the current "FISH" method to the "MatBA" (CGI Method). The data shows that while FISH leaves 85% of cases in a non-distinct "Favorable/Intermediate" category, MatBA provides a much more granular risk stratification (38% Favorable, 39% Intermediate, 23% Unfavorable). The most compelling stat here is that 8% of cases with an unfavorable prognosis were missed by FISH but caught by MatBA. The slide lists high-tier validation partners like Dana-Farber and North Shore LIJ, which adds significant institutional credibility.
Slide 17: FHACT Product Deep Dive
Focusing on the gynecological segment, this slide introduces FHACT, a FISH-based HPV-associated cancer test. The slide includes four charts showing genomic amplification by disease category, citing a study from Gynecologic Oncology (2013) . The key takeaway is positioned at the bottom: FHACT is the "Only 4 Color FISH Probe" that can be used for screening before a colposcopy. This highlights a unique competitive advantage and a specific point of entry into the clinical workflow.
Slide 21: M&A and Clinical Trial Services
This slide demonstrates the company's growth through acquisition. By combining Select One and Gentris, CGIX expanded its reach into the pharmaceutical pipeline. The bar chart is impressive, showing contract values growing from $300,000 in 2011 to $18,000,000 in 2014 . It also lists blue-chip pharma clients including Merck, Novartis, and Bristol-Myers Squibb. This shift toward serving the pharma industry provides a more stable, B2B revenue stream compared to individual clinical testing.
Slide 25: Strategic Partnership - AstraZeneca
Partnerships are a key validator for biotech companies. This slide focuses entirely on a deal with AstraZeneca to provide biomarker and molecular testing in Central America and the Caribbean. The inclusion of a quote from the Country President of AstraZeneca CAMCAR, S.A., serves as a testimonial. This slide is less about immediate revenue and more about global brand awareness and geographic expansion.
Slide 29: Revenue and Volume Trends
The financial traction slide shows consistent year-over-year growth. Total revenue increased from $1.67 million in 2009 to $6.61 million in 2013 . Parallel to this, clinical volume (tests processed) grew from 2,321 to 10,771 in the same period. The 54% full-year revenue growth in 2013 is the headline metric here, suggesting that the company's commercial engine is accelerating.
Slide 33: Revenue Mix and Payer Coverage
The final slide in this set addresses the "Who pays?" question. The revenue mix is healthy, with 58% coming from direct-bill customers (hospitals and biotechs), which typically involves less administrative friction than insurance reimbursement. However, the company also shows progress in the reimbursement space, claiming 72+ million covered lives through major payers like Aetna, UnitedHealthcare, and Cigna. This diversification reduces the risk associated with any single payer or reimbursement policy change.
What Works Well
Institutional Validation: The deck consistently cites top-tier partners like the National Cancer Institute and Dana-Farber. For a biotech company, these names are essential for building investor confidence. · Clear Market Segmentation: Instead of claiming to solve "all cancer," the deck focuses on three specific, high-volume segments (Hematological, Urogenital, Gynecological). · Commercial Traction: The transition from $300k to $18M in clinical trial contracts is a powerful growth story that proves the M&A strategy is working. · Competitive Differentiation: Slide 17 explicitly states a unique competitive advantage (the only 4-color FISH probe), which is rare in generic biotech decks.
What Is Missing
Burn Rate and Cash Runway: As a 2014 deck for a NASDAQ-listed company, the provided slides do not show the current cash position or how long the current capital will last. · Management Team: The provided slides omit the leadership and scientific advisory board. In biotech, the pedigree of the scientists is often as important as the data. · Future Financial Projections: While historical growth is shown, there are no specific revenue targets for 2015 or 2016 in the provided slides. · Unit Economics: There is no mention of the cost per test or the gross margins for the different diagnostic products.
Founder Takeaways
Use Data to Displace the Incumbent: Slide 13 is a masterclass in showing why a new product is better than the "Current Method." By showing exactly what the old method misses (8% of unfavorable cases), CGIX makes a logical argument for adoption that goes beyond marketing fluff.
Diversify Your Revenue Streams: CGIX didn't just rely on insurance reimbursements. By building a clinical trials service for big pharma, they created a high-value B2B revenue stream that complements their clinical diagnostic business. Founders should look for secondary markets where their core technology adds value.
Quantify the "Covered Lives": In healthcare, having a great product is useless if no one pays for it. CGIX's mention of 72 million covered lives (Slide 33) is a critical metric for any medical device or diagnostic startup. It proves that the "plumbing" for payment is already in place.
Anchor Your TAM in Reality: Rather than using a vague "trillion-dollar healthcare market" slide, CGIX used American Cancer Society data to pinpoint exactly how many new cases exist in their specific sub-sectors. This makes the $6 billion market opportunity feel attainable rather than imaginary.
Frequently asked questions
- What is the primary value proposition of Cancer Genetics according to the deck?
- The primary value proposition is the transition from 'Traditional' phenotypic and physical examinations to 'Personalized Medicine' using genomic analysis and proprietary algorithms. Slide 5 argues that this shift reduces the number of specimens required and significantly improves diagnostic accuracy and treatment plans, aiming for a 100% target success rate in treatment outcomes.
- How has the company used acquisitions to fuel its growth?
- Cancer Genetics acquired Select One and Gentris to bolster its clinical trial services. According to Slide 21, this strategy led to a massive increase in contract value, rising from just $300,000 in 2011 to $18,000,000 in 2014. These acquisitions allowed them to serve major pharmaceutical clients like Merck, Novartis, and Bristol-Myers Squibb.
- What specific cancer types does the company target?
- Slide 9 identifies three core markets: Hematological (Lymphoma, Leukemia, M. Myeloma) with 156,420 annual cases; Urogenital (Kidney, Bladder, Prostate) with 371,610 cases; and Gynecological (Cervical, Endometrial, Ovarian) with 86,970 cases. Combined, these segments represent a $6 billion annual U.S. spend on laboratory testing.
- What clinical evidence is provided for their diagnostic products?
- The deck provides specific validation data for two products. Slide 13 shows that MatBA-CLL/SLL caught 8% of unfavorable prognosis cases missed by the current FISH method. Slide 17 presents genomic amplification data for FHACT, validated by partners including the National Cancer Institute and Georgia Health Sciences University, showing its efficacy in detecting HPV-related cervical cell changes.
- Who are the primary payers for Cancer Genetics' services?
- As of the first half of 2014, the revenue mix was diversified. Slide 33 shows that 58% of revenue comes from direct-bill customers (Biotechs, Pharmas, and Hospitals), while the remainder is reimbursement-based: 21% from 3rd party insurance, 18% from Medicare, and 3% from probes. They claim access to over 72 million covered lives through payers like Aetna and UnitedHealthcare.