Manufacturing and Supply on a Pitch Deck: Who Makes It, How
How physical-product startups show manufacturing and supply on a pitch deck: co-packers, contract manufacturers, in-house plants and capacity.
How to Show Manufacturing and Supply on a Pitch Deck
Eight slides from real pitch decks that explain how a physical product gets made: co-packers, contract manufacturers, partner factories, the company's own production line, or an existing industry supply chain. For each, we record who makes the product, whether capacity is stated in units, how that capacity compares with current sales, and what the slide says about the risk of a supplier failing.
TL;DR
A manufacturing slide answers three questions an investor will ask about any physical product: who makes it, how much can they make, and what happens if they stop. The useful slide names the producer (or says the company makes it itself), states capacity in units per day or year, compares that capacity with current and planned sales, and says what the backup is. Claims such as "robust supply chain" or "very low supply chain risk" are not answers until they carry one of those facts.
In this set, Moteefe is the clearest: current sales of 5,000 units a day against capacity of 50,000, rising to 150,000 and a long-term 800,000. Infused Foundry states 180 pieces a minute and converts it into hours and days correctly. Chamberlain Coffee names its role split between a dry and a ready-to-drink co-packer and shows their other clients. Barfresh explains why it moved production in-house after contract manufacturers failed. The weaker slides assert scalability without a number: Bramble Energy's "manufacturable anywhere", Circ's "produce with partners", Suometry's "very low supply chain risks" and Cowboy's "robust manufacturing and supply chain".
Manufacturing and supply slides from real pitch decks
Each example shows the exact stored slide beside its analysis and links to the full teardown. Figures are the companies' own claims unless marked as our calculation. Stage and year are given only where the slide states them.
Moteefe product slide — slide 10
Print-on-demand platform for retailers. The slide refers to 2021 as a future year.
Moteefe deck, slide 10. Exact stored slide matched to this analysis.
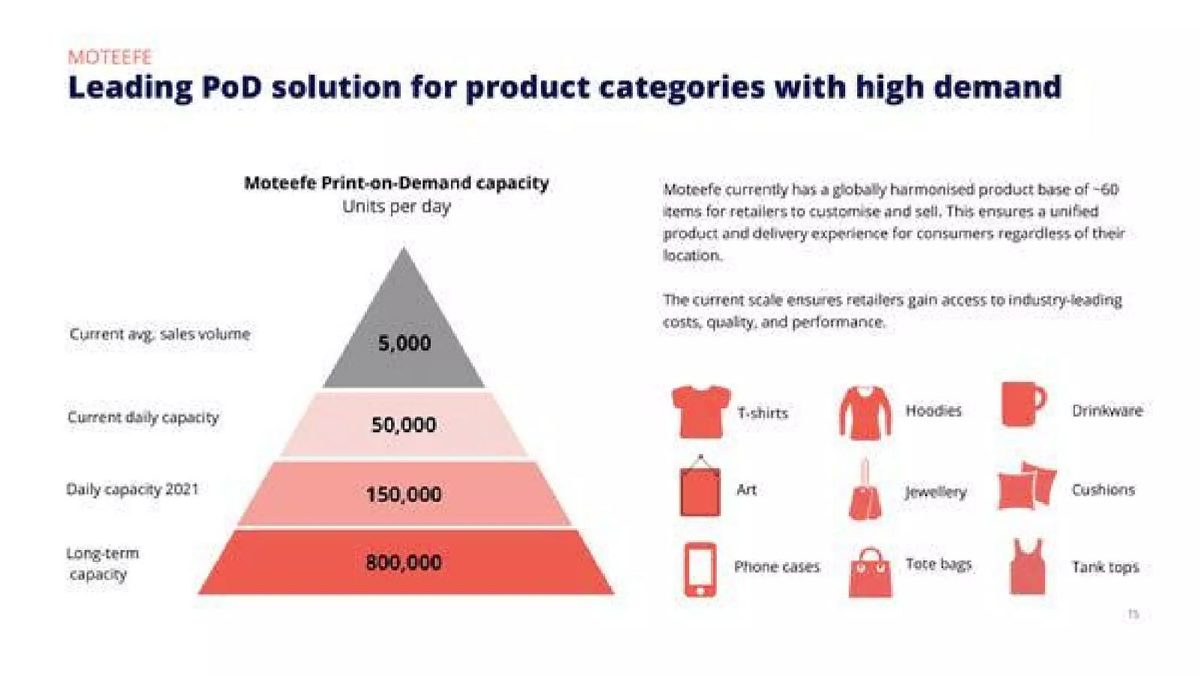
Our analysis: Sales, current capacity and planned capacity are in the same unit, so the reader can see that production is not the constraint. What the slide doesn't say is who operates the capacity (own sites or print partners) or what the step to 150,000 costs.
Evidence and limitation: Our calculation: 5,000 ÷ 50,000 is 10% utilisation today; 2021 capacity would be 30 times current sales, and long-term capacity 160 times.
What a founder can adapt: Add who runs the capacity and what adding the next tier requires.
Supporting analysis
What the deck claims: "Leading PoD solution for product categories with high demand". A pyramid of "Moteefe Print-on-Demand capacity, units per day": current average sales volume 5,000; current daily capacity 50,000; daily capacity 2021 150,000; long-term capacity 800,000. Text: a "globally harmonised product base of ~60 items" and nine product categories (T-shirts, hoodies, drinkware, art, jewellery, cushions, phone cases, tote bags, tank tops).
Presentation choice: It is the only slide in this set that puts sales and capacity side by side.
When it does not fit: Don't show long-term capacity without saying what it depends on.
Infused confectionery contract manufacturing facility, Colorado. The facility is described in the future tense.
Infused Foundry deck, slide 6. Exact stored slide matched to this analysis.
Our analysis: A planned machine rate, correctly converted. It is capacity, not output: "will be able to" means the facility was not yet running, and the market comparison depends on an unstated number.
Evidence and limitation: Our checks: 180 × 60 is 10,800; 10,800 × 8 is 86,400. Our calculation: 442 × 86,400 is about 38.2 million pieces, the implied Colorado figure, which the slide does not print or source.
What a founder can adapt: Print the market figure and source, and say how many shifts the plan assumes.
Supporting analysis
What the deck claims: "Standardizing creates efficiency": "Our production facility will be able to produce up to 180 uniform pieces per minute. With that capacity, we could satisfy the 2016* candy sales for the entire state of Colorado in 442 days, operating a single, 8 hour, shift per day. That's 10,800 pieces/hour and 86,400 pieces/day." Footnote: "*First 10 months of 2016, Colorado".
Presentation choice: It turns a machine specification into a unit a non-engineer can use.
When it does not fit: Don't compare capacity with a market total you don't show.
Chamberlain Coffee deck, slide 8. Exact stored slide matched to this analysis.
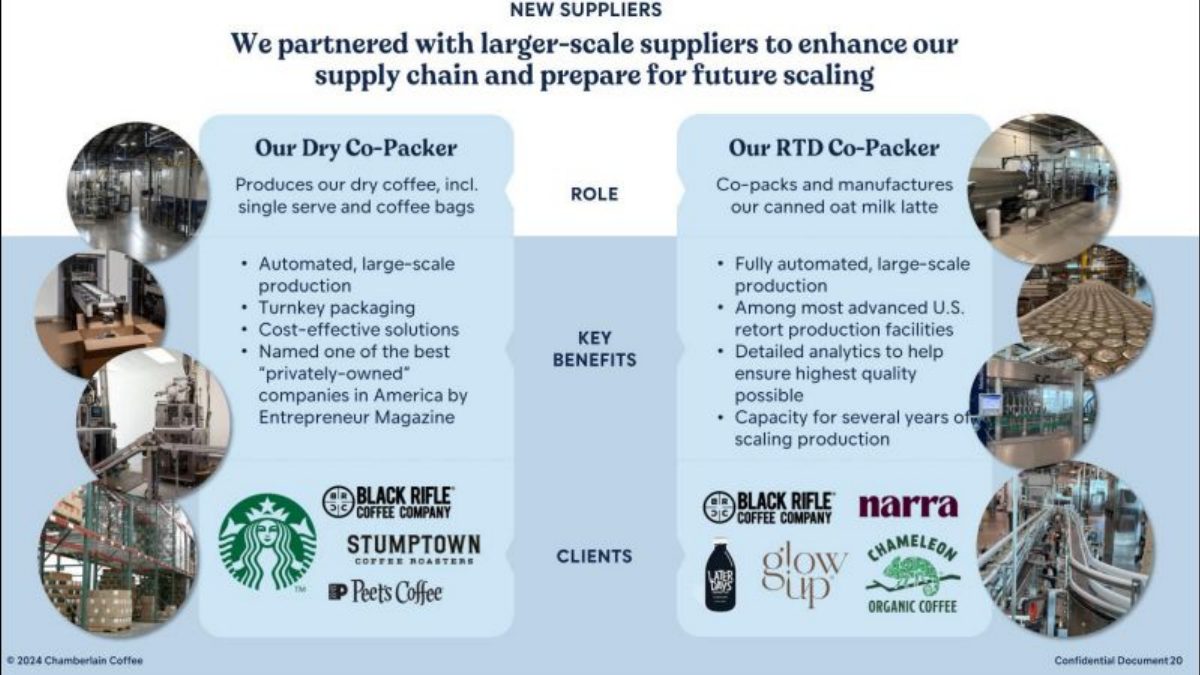
Our analysis: The client logos are indirect evidence that each partner can produce at scale. The split by product line shows the brand knows which partner owns which risk.
Evidence and limitation: No capacity figure; "several years of scaling" is not quantified. The partners themselves are not named, only their clients.
What a founder can adapt: Add capacity in units a year and how much of it Chamberlain's plan uses.
Supporting analysis
What the deck claims: "New suppliers": "We partnered with larger-scale suppliers to enhance our supply chain and prepare for future scaling." Dry co-packer: produces dry coffee including single serve and coffee bags; automated, larger-scale production; turnkey packaging; cost-effective; named one of the best privately owned companies in America by Entrepreneur Magazine; clients shown as Starbucks, Black Rifle Coffee Company, Stumptown and Peet's. RTD co-packer: co-packs and manufactures the canned oat milk latte; fully automated; "among most advanced U.S. retort production facilities"; detailed analytics for quality; "capacity for several years of scaling production"; clients shown as Black Rifle, Narra, La Colombe, Glow Up and Chameleon Organic Coffee.
Presentation choice: It answers "who makes it" for each product line and backs it with the partners' track record.
When it does not fit: Don't let partners' client logos imply your own volume.
Portion-controlled frozen smoothie packs, Australia. An early private deck (Barfresh Food Group Pty Ltd).
Barfresh deck, slide 7. Exact stored slide matched to this analysis.
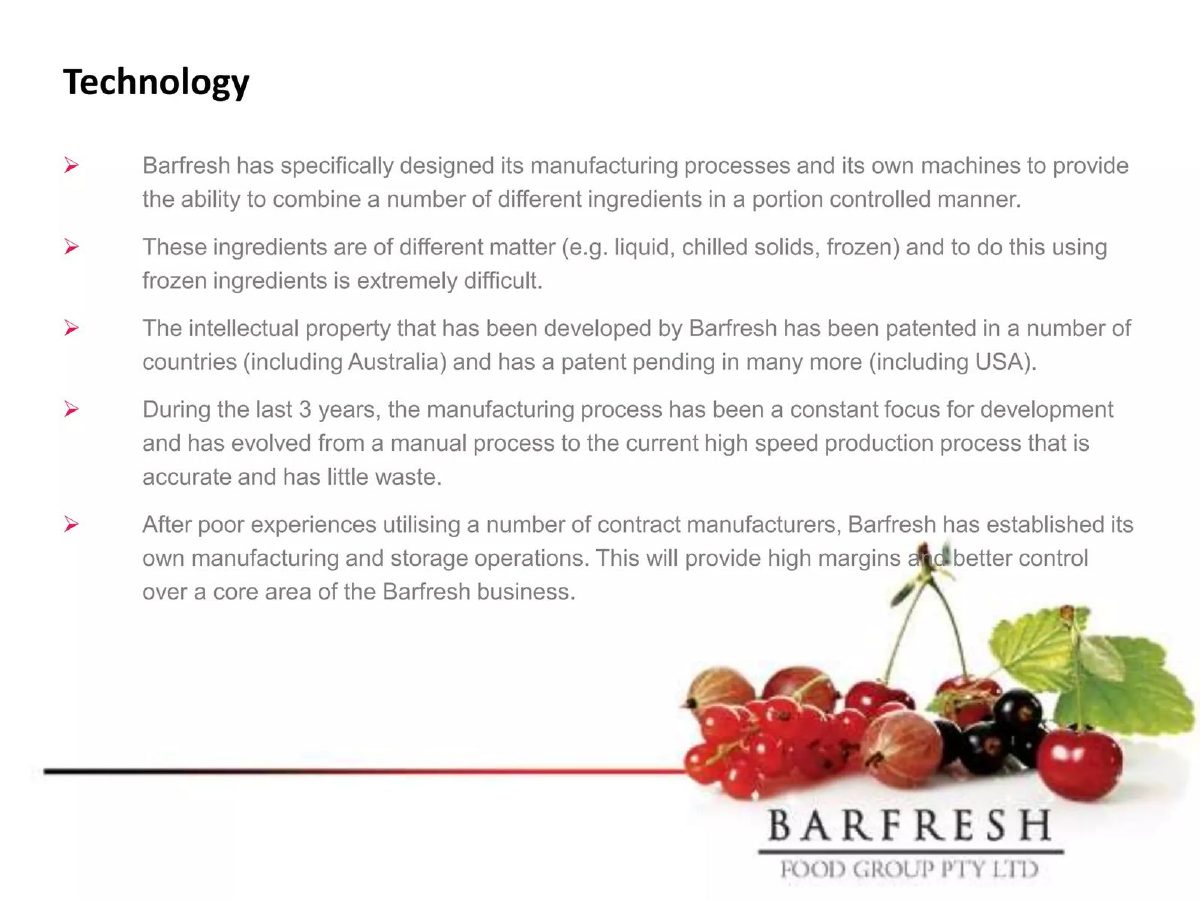
Our analysis: A clear make-or-buy explanation: the process is proprietary and partners could not run it reliably, so production is brought in-house. The margin benefit is claimed, not shown.
Evidence and limitation: No capacity, cost or margin figure. The reason for the change is stated; its effect is a forecast ("will provide").
What a founder can adapt: Add units per day and the gross margin before and after the move.
Supporting analysis
What the deck claims: "Technology": Barfresh designed its own manufacturing processes and machines to combine liquid, chilled and frozen ingredients in portion-controlled packs; the IP is patented in several countries including Australia, with patents pending in more including the USA; over three years the process moved from manual to high-speed with little waste; "After poor experiences utilising a number of contract manufacturers, Barfresh has established its own manufacturing and storage operations. This will provide high margins and better control over a core area of the Barfresh business."
Presentation choice: It tells an investor why the company is spending capital on production instead of outsourcing it.
When it does not fit: Don't claim higher margins from in-house production without the numbers.
Bramble Energy deck, slide 4. Exact stored slide matched to this analysis.
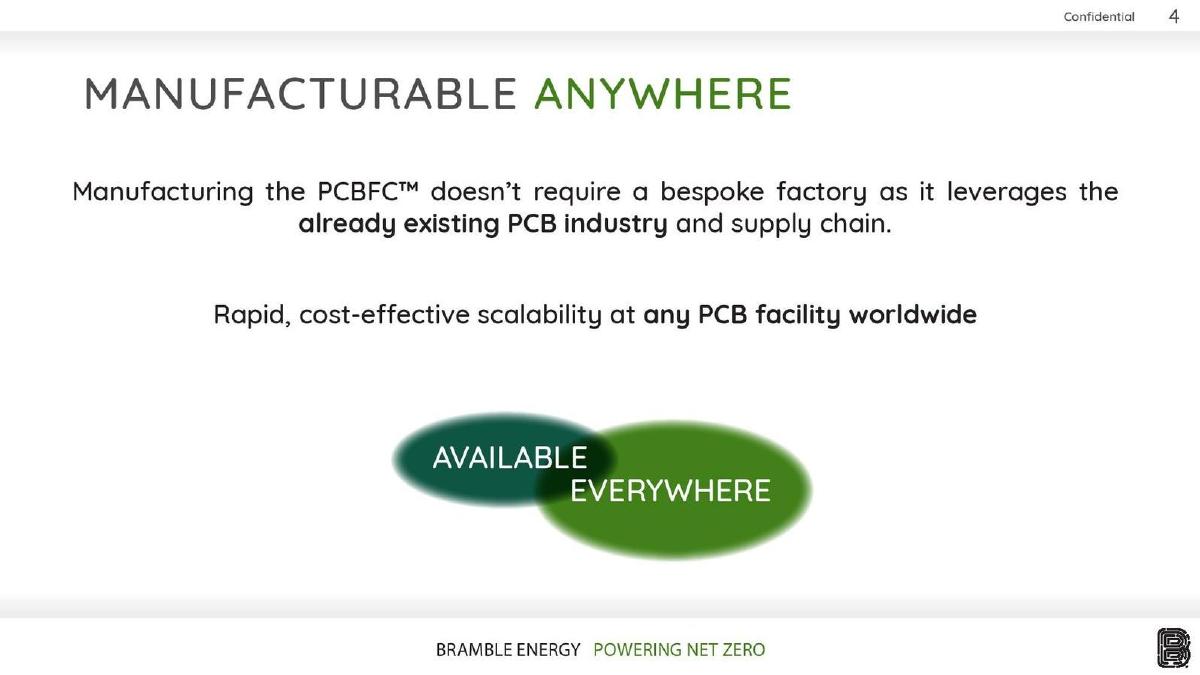
Our analysis: The argument is strong in principle: reusing an established industry avoids building a plant. The slide needs one fact showing it has happened, such as a named PCB manufacturer that has produced cells.
Evidence and limitation: No factory named, no units produced, no cost figure.
What a founder can adapt: Name the facilities that have built cells and at what volume.
Supporting analysis
What the deck claims: "Manufacturable anywhere": "Manufacturing the PCBFC doesn't require a bespoke factory as it leverages the already existing PCB industry and supply chain. Rapid, cost-effective scalability at any PCB facility worldwide." Two overlapping shapes: "available everywhere".
Presentation choice: It explains why the company needs little manufacturing capital, which matters for a hardware raise.
When it does not fit: Don't say "any facility" when you can name one.
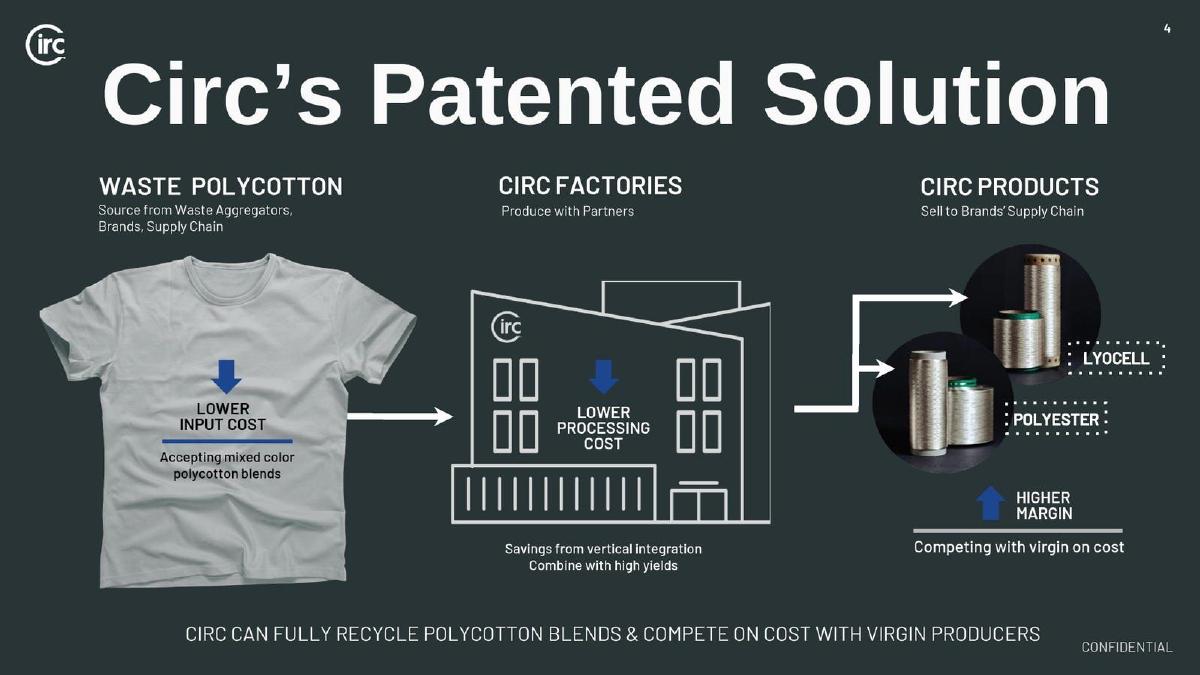
Textile recycling for polycotton blends. Marked confidential.
Circ deck, slide 5. Exact stored slide matched to this analysis.
Our analysis: The flow from waste to fibre is clear, and "produce with partners" tells the reader the model. The cost claims are the investment case and none is quantified.
Evidence and limitation: Every step is labelled lower or higher without a figure: no input cost, processing cost, yield or price against virgin fibre.
What a founder can adapt: Put one cost per step and the price of virgin fibre beside it.
Supporting analysis
What the deck claims: "Circ's Patented Solution": waste polycotton sourced from waste aggregators, brands and supply chains ("lower input cost, accepting mixed color polycotton blends"); Circ factories that "produce with partners" ("lower processing cost, savings from vertical integration, combine with high yields"); Circ products (lyocell and polyester) sold to brands' supply chains ("higher margin, competing with virgin on cost"). Footer: "Circ can fully recycle polycotton blends and compete on cost with virgin producers."
Presentation choice: It shows the full supply chain on one page, including where inputs come from.
When it does not fit: Don't label steps lower cost or higher margin without the numbers.
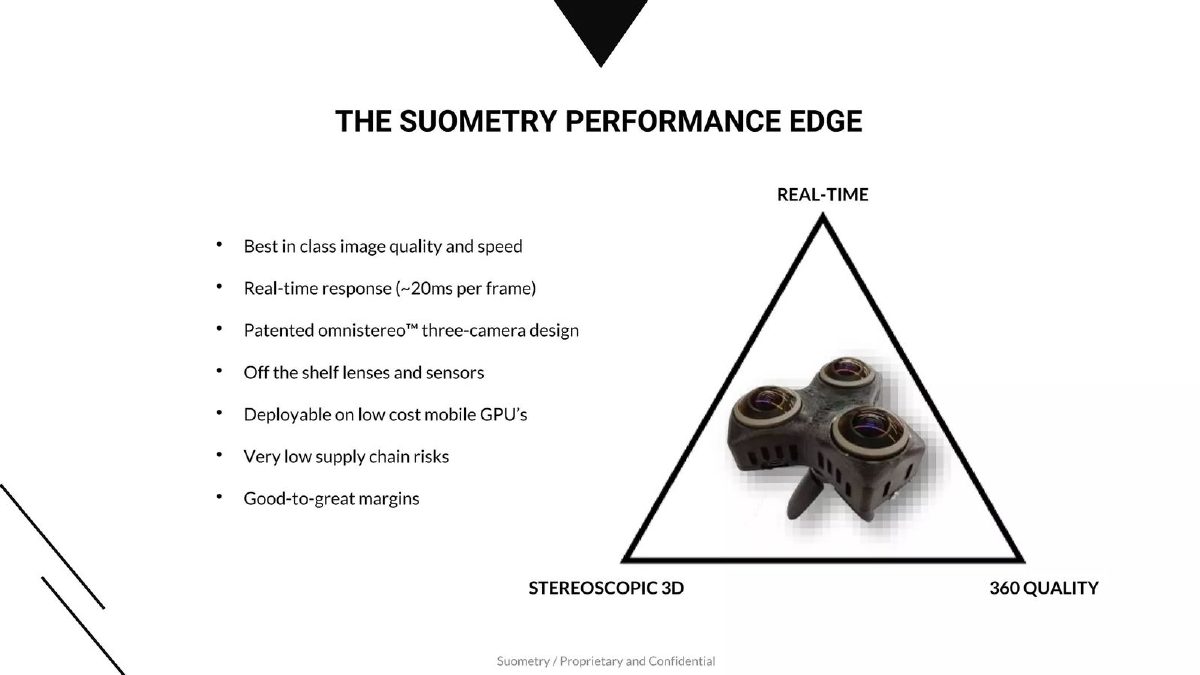
360-degree stereoscopic 3D camera. Marked proprietary and confidential.
Suometry deck, slide 7. Exact stored slide matched to this analysis.
Our analysis: Using standard lenses and sensors does reduce supply risk, and it is the right reason to give. "Very low" and "good-to-great" are ratings the reader cannot check.
Evidence and limitation: No parts, suppliers, unit cost or margin figure.
What a founder can adapt: Name the components and how many suppliers can provide each.
Supporting analysis
What the deck claims: "The Suometry Performance Edge": best-in-class image quality and speed; real-time response (about 20ms per frame); patented omnistereo three-camera design; "off the shelf lenses and sensors"; deployable on low-cost mobile GPUs; "very low supply chain risks"; "good-to-great margins".
Presentation choice: It links a design choice (standard components) to supply risk.
When it does not fit: Don't rate your own supply risk; show the facts behind it.
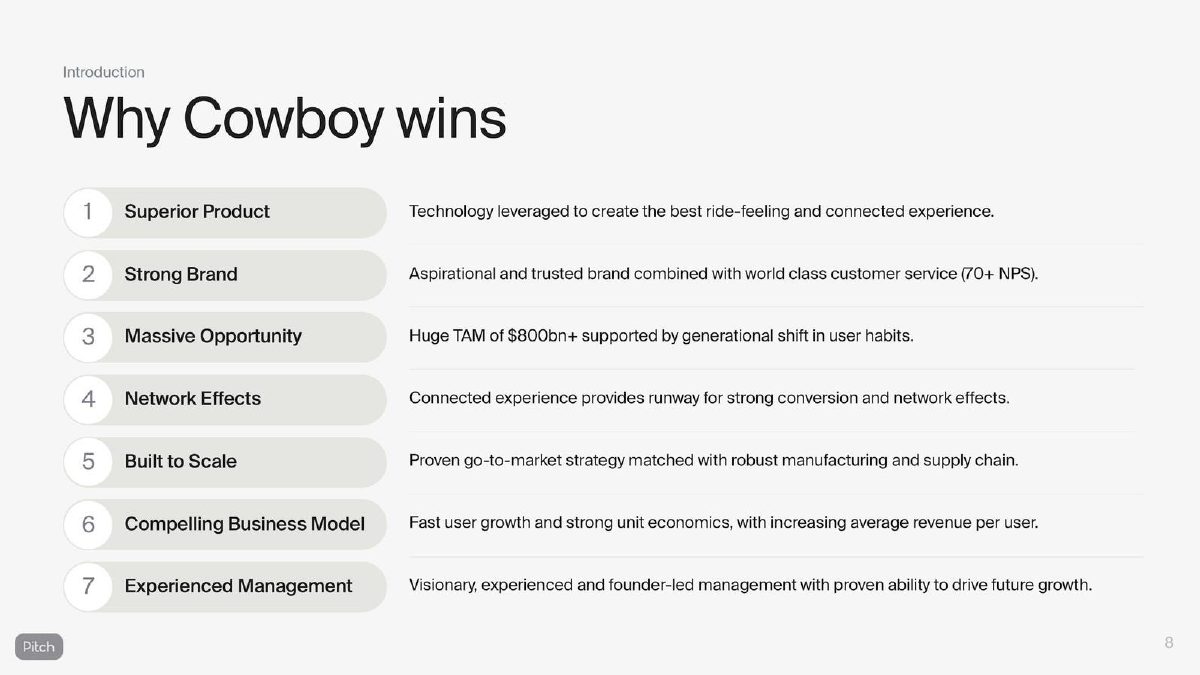
Connected electric bikes. An introduction slide listing seven reasons.
Cowboy deck, slide 8. Exact stored slide matched to this analysis.
Our analysis: For an e-bike company, supply was a central risk; the slide treats it as settled. That can work on a summary page only if a later slide carries the detail.
Evidence and limitation: Manufacturing is one clause in a list, with no producer, capacity or lead time.
What a founder can adapt: Point to the slide that names the assembler and capacity.
Supporting analysis
What the deck claims: "Why Cowboy wins": seven points including "5 Built to Scale: Proven go-to-market strategy matched with robust manufacturing and supply chain." Others: superior product, strong brand (70+ NPS), massive opportunity (TAM of $800bn+), network effects, compelling business model and experienced management.
Presentation choice: It shows where manufacturing sits in the investment case.
When it does not fit: Don't call a supply chain robust without evidence elsewhere in the deck.
Columns report what each slide states; checks are our calculations.
Example
Model
Producer named
Capacity in units
Compared with sales
Supply risk addressed
Moteefe
Not stated
No
Yes, 50,000/day
Yes, 10% used
No
Infused Foundry
In-house (planned)
Self
Yes, 180/min
Market, unstated figure
No
Chamberlain Coffee
Two co-packers
Roles and clients
No
No
Partner track record
Barfresh
In-house
Self
No
No
Reason for move
Bramble Energy
Existing industry
No
No
No
Claimed
Circ
Partner factories
No
No
No
No
Suometry
Standard parts
No
No
No
Claimed
Cowboy
Not stated
No
No
No
Claimed
Key Takeaways
Name who makes the product. Chamberlain Coffee separates its dry co-packer from its ready-to-drink co-packer.
State capacity in units. Infused Foundry gives 180 pieces a minute, 10,800 an hour and 86,400 a day.
Compare capacity with sales. Moteefe's 5,000 units a day of sales against 50,000 of capacity is 10% utilisation (our calculation).
Explain a make-or-buy change. Barfresh moved in-house after "poor experiences" with contract manufacturers.
Back up "scalable" with a fact. Bramble Energy says any PCB factory can make its product but names none.
Don't assert low supply risk. Suometry's "very low supply chain risks" rests on off-the-shelf parts it doesn't list.
Build your manufacturing panel
Answer each prompt in one line with a number where possible.
Producer. Who makes each product line: you, a named partner, or several?
Capacity. Units per day or year today, and at the end of the plan?
Utilisation. Current sales as a share of capacity?
Next step. What adds capacity (shift, line, partner) and what does it cost?
Backup. How many qualified suppliers for each critical part or process?
Copyable framework: Made by [producer]; capacity [x] units/[period], [y]% used today; next [step] adds [z] for [cost]; [n] qualified suppliers for [critical input].
Illustrative example 1 — written by us
Before: Proven go-to-market strategy matched with robust manufacturing and supply chain.
After: Assembled by [partner] in [country]; capacity [x] bikes a month, [y]% used; second assembler qualified for [z]% of volume.
What improved: Illustrative template for Cowboy's line; bracketed values are for the company to supply.
Why investors ask how the product is made
For a software company, serving twice as many customers is mainly a question of servers. For a physical product, it is a question of factories, suppliers, minimum order quantities, lead times and cash tied up in stock. An investor looking at a consumer brand, a food company or a hardware startup wants to know whether the plan in the financials can physically be produced, at the cost the margin assumes, without a single supplier holding the company hostage.
That is why a manufacturing or supply slide, or a clear panel on the product or operations slide, earns its place in decks for physical goods. It is also where many decks become vague. "Scalable manufacturing" appears often; the numbers that make it checkable (units per day, the share of capacity in use, the number of qualified suppliers) appear much less often.
This guide is about how the product is produced. The cost of each unit as volume grows is covered in the cost-at-volume guide, and how the product reaches customers in the hardware go-to-market guide. The three fit together: capacity limits how fast sales can grow, cost at volume decides the margin, and go-to-market decides how much of the capacity is used.
Three models: partners, in-house, or an existing industry
Partner production uses co-packers or contract manufacturers. It needs little capital and can start quickly, which is why most early consumer brands use it. The risk is dependence: a partner can raise prices, give capacity to a bigger client or fail on quality. Chamberlain Coffee's slide shows the strongest version of the case: named roles, the partners' automation and their other clients, which is evidence that they can handle volume.
In-house production needs capital but gives control over quality, cost and capacity. It is usually justified by something partners cannot do. Barfresh's slide gives that reason plainly: it designed its own machines for portion-controlled frozen ingredients and moved in-house "after poor experiences utilising a number of contract manufacturers". Infused Foundry is the in-house model taken further, since the factory itself is the business.
The third model relies on an industry that already exists, such as printed circuit board factories for Bramble Energy's fuel cells or partner plants for Circ's recycled fibre. It can be the fastest route to scale, but the slide needs to show that at least one such factory has actually produced the product; otherwise "available everywhere" is a hypothesis.
Capacity and utilisation: the numbers that make it checkable
Capacity is only meaningful in units and against demand. Moteefe gives both on one slide: current average sales of 5,000 units a day, current daily capacity of 50,000, 150,000 planned for 2021 and a long-term 800,000. Our calculation: the company is using 10% of today's capacity, so the constraint on growth is demand, not production. That is a useful thing for an investor to know, and the slide lets them work it out.
Infused Foundry's slide works in the other direction, converting a machine rate into a market comparison: 180 pieces a minute is 10,800 an hour and 86,400 in an eight-hour day (our checks confirm both). It then says that capacity could satisfy the candy sales of the whole state of Colorado for the first ten months of 2016 in 442 days on a single shift. Our calculation: 442 days × 86,400 pieces is about 38.2 million pieces, which implies that is the Colorado figure the company used, although the slide does not print it or its source. The comparison is vivid, but a reader cannot check it without that number.
When a deck gives capacity, the next question is what it takes to add more: another shift, another line, another partner, and how much capital each costs. None of the slides in this set gives that, and it is the most common gap.
Common mistakes
No producer named. Say who makes it, even if the partner's name stays confidential.
Capacity without units. "Scalable" needs units per day or year.
Capacity without demand. Show current sales against capacity.
Self-rated risk. Replace "low risk" with the number of suppliers.
Unsourced comparisons. Print the market figure a capacity claim relies on.
Forecast margins. Separate planned margin gains from measured ones.
Diagnostic checklist
Each product line has a named producer or "made in-house".
Capacity is stated in units per period.
Current sales are shown against capacity.
The cost and timing of the next capacity step are stated.
Critical inputs have more than one qualified supplier, or the risk is named.
Planned facilities are labelled as planned.
Frequently asked questions
Do I need a manufacturing slide in a pitch deck?
For a physical product, investors need to know who makes it, how much can be made and what happens if a supplier fails. That can be a slide or a panel on the product slide. Moteefe's capacity pyramid and Chamberlain Coffee's co-packer panel are examples.
Should I name my co-packer or contract manufacturer?
Name them if you can; if not, describe them with checkable facts. Chamberlain Coffee shows each co-packer's role and other clients without naming the partner.
How should I show production capacity?
In units per day or year, next to current sales. Moteefe shows 5,000 units a day of sales against 50,000 of capacity.
When is in-house manufacturing worth explaining?
When it uses capital an investor will ask about. Barfresh explains that contract manufacturers could not run its process, so it built its own line.
How do I show supply chain risk honestly?
Count the suppliers for each critical input and name any single source. Suometry's "very low supply chain risks" gives the right reason (standard parts) but no count.
How we chose these examples
Search (2026-09-30): the durable corpus index (70,729 unique pages, deduplicated by deck-file sha256 + page) was searched for co-packer, contract manufacturer, manufacturing partner, production capacity, units per day or year, factory and supply chain (58 public pages for the capacity and partner terms). Listed-company, SPAC, mining, energy-utility and cannabis-producer investor-relations decks were excluded.
Ten candidate pages were rendered from the original public deck files and read from the images; eight are used: Moteefe 10, Infused Foundry 6, Chamberlain Coffee 8, Barfresh 7, Bramble Energy 4, Circ 5, Suometry (awe-usa deck) 7 and Cowboy 8. Page numbers are PDF pages; Moteefe's page shows 15 and Circ's shows 4 in the slide footer.
Left out: Chick-in 6 (capacity of a customer's farm, not the company's production); Flow Water 6 (listed company). Figures are as printed on each slide and have not been verified.
How we built this: drafted and checked with AI assistance (editorial model review against the original slide images); no human editor has reviewed this guide.