Unit Cost vs Volume in a Pitch Deck: 7 Real Slide Examples
How to show that cost per unit falls as you grow: seven real pitch deck slides compared, from a cost with no volume to line-item tables.
Unit Cost vs Volume: How to Show Costs Falling as You Grow
Many founders tell investors that cost per unit will fall as volume grows. The seven real slides below range from a single cost with "lower at volume" in brackets to a line-by-line cost table for each future year. Not one of them states a cost per unit at two different stated volumes, which is what the claim would need. Read together, they show what makes that claim checkable and which parts each company actually stated.
TL;DR
A convincing cost-at-volume claim gives today's measured cost per unit, the volume it was measured at, the target cost, the volume or order size that unlocks it, and the reason costs fall (supplier price breaks, a machine, cheaper shipping). It keeps variable costs separate from fixed costs spread over more units. None of the seven slides here does that, and none shows a cost per unit at two stated volumes. Mycroclime shows a real cost for one batch of 15, at a single volume. Surf Shop Box breaks one box into line items for today and two future years, but its columns are year-ends, not volumes, and the two future columns are forecasts. Once Upon a Farm names an order threshold and a machine, but gives only the target cost, not today's. Parfait holds its cost flat while projected sales grow 31 times; Mandaê quotes published supplier tables and deliberately leaves volume discounts out. Brain Backups draws a falling cost curve with no numbers or axis labels; AxCent writes "lower" with no figure and no volume. Every future cost here is a forecast, target or estimate, not evidence that a cost fell.
Unit cost slides from real pitch decks
The examples run from measured costs to claims with no volume attached. Each shows the exact stored slide above its analysis and links to the full teardown. Text is quoted as shown on the slides; arithmetic checks are ours. We describe only what each slide shows; a company may have supported these figures elsewhere in its deck or data room.
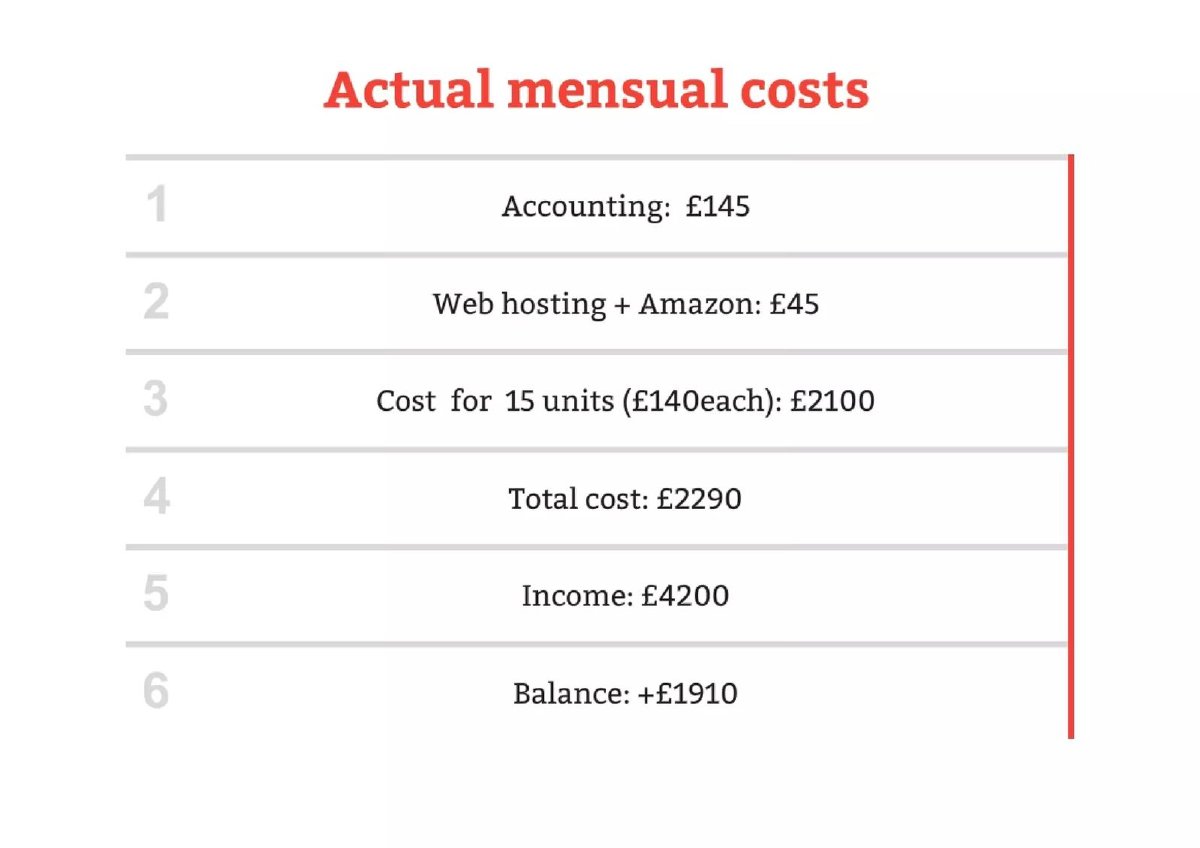
Mycroclime unit economics slide — slide 11
Consumer product company selling physical units, including through Amazon. Stage and year are not stated on the slide.
Mycroclime deck, slide 11. Exact stored slide matched to this analysis.
Our analysis: It is the only slide here with a measured unit cost and the batch size it was measured at. The arithmetic holds (15 × £140 = £2,100; £145 + £45 + £2,100 = £2,290; £4,200 − £2,290 = £1,910), and it keeps the monthly fixed costs separate from the unit cost.
Evidence and limitation: It shows one month and one batch size, so it cannot show whether cost falls with volume. The £4,200 income implies about £280 per unit if all 15 sold that month, which the slide does not say.
What a founder can adapt: Use this as your starting row: what one unit costs you today, at the quantity you actually bought. Add the cost you expect at the next order size and the quote behind it.
Supporting analysis
What the deck claims: "Actual mensual costs": "Accounting: £145", "Web hosting + Amazon: £45", "Cost for 15 units (£140each): £2100", "Total cost: £2290", "Income: £4200", "Balance: +£1910".
Presentation choice: It is the only slide here with a measured unit cost and the batch size it was measured at. The arithmetic holds (15 × £140 = £2,100; £145 + £45 + £2,100 = £2,290; £4,200 − £2,290 = £1,910), and it keeps the monthly fixed costs separate from the unit cost.
When it does not fit: It shows one month and one batch size, so it cannot show whether cost falls with volume. The £4,200 income implies about £280 per unit if all 15 sold that month, which the slide does not say.
Subscription box for surf products. The deck file is dated 11-28-16 in its name; the slide projects to the end of 2017 and 2018.
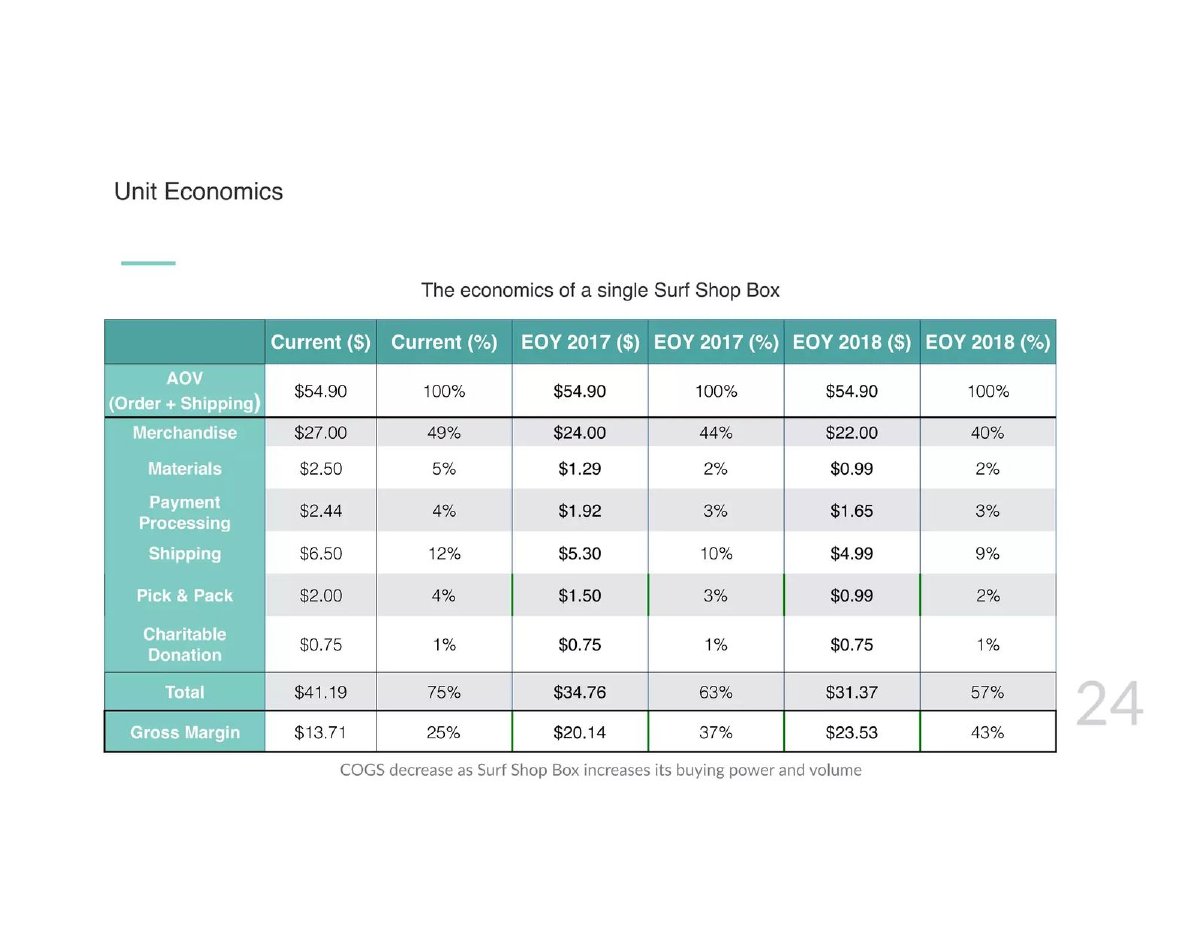
Surf Shop Box deck, slide 24. Exact stored slide matched to this analysis.
Our analysis: Every line adds up (for example $27.00 + $2.50 + $2.44 + $6.50 + $2.00 + $0.75 = $41.19), the price is held constant so the margin change comes only from costs, and an investor can see exactly which costs are expected to fall.
Evidence and limitation: The future columns are labelled by date, not volume, so the slide never says how many boxes produce the 2017 or 2018 costs. Payment processing falls from $2.44 to $1.65 on the same $54.90 order, which needs a reason (a new rate) that the slide does not give. The "Current" column is presumably measured, but the slide does not say.
What a founder can adapt: Break your unit cost into lines like this and hold the price steady, then add the volume each column assumes and the reason each line falls.
Supporting analysis
What the deck claims: "Unit Economics — The economics of a single Surf Shop Box": columns Current, EOY 2017 and EOY 2018 in dollars and percent. AOV "$54.90" in all three. Merchandise $27.00 → $24.00 → $22.00; Materials $2.50 → $1.29 → $0.99; Payment Processing $2.44 → $1.92 → $1.65; Shipping $6.50 → $5.30 → $4.99; Pick & Pack $2.00 → $1.50 → $0.99; Charitable Donation $0.75 in all three. Total $41.19 → $34.76 → $31.37; Gross Margin $13.71 (25%) → $20.14 (37%) → $23.53 (43%). Caption: "COGS decrease as Surf Shop Box increases its buying power and volume".
Presentation choice: Every line adds up (for example $27.00 + $2.50 + $2.44 + $6.50 + $2.00 + $0.75 = $41.19), the price is held constant so the margin change comes only from costs, and an investor can see exactly which costs are expected to fall.
When it does not fit: The future columns are labelled by date, not volume, so the slide never says how many boxes produce the 2017 or 2018 costs. Payment processing falls from $2.44 to $1.65 on the same $54.90 order, which needs a reason (a new rate) that the slide does not give. The "Current" column is presumably measured, but the slide does not say.
Organic baby food sold in pouches through distributors and retailers. Page 17 of the file; the slide itself is numbered 14.
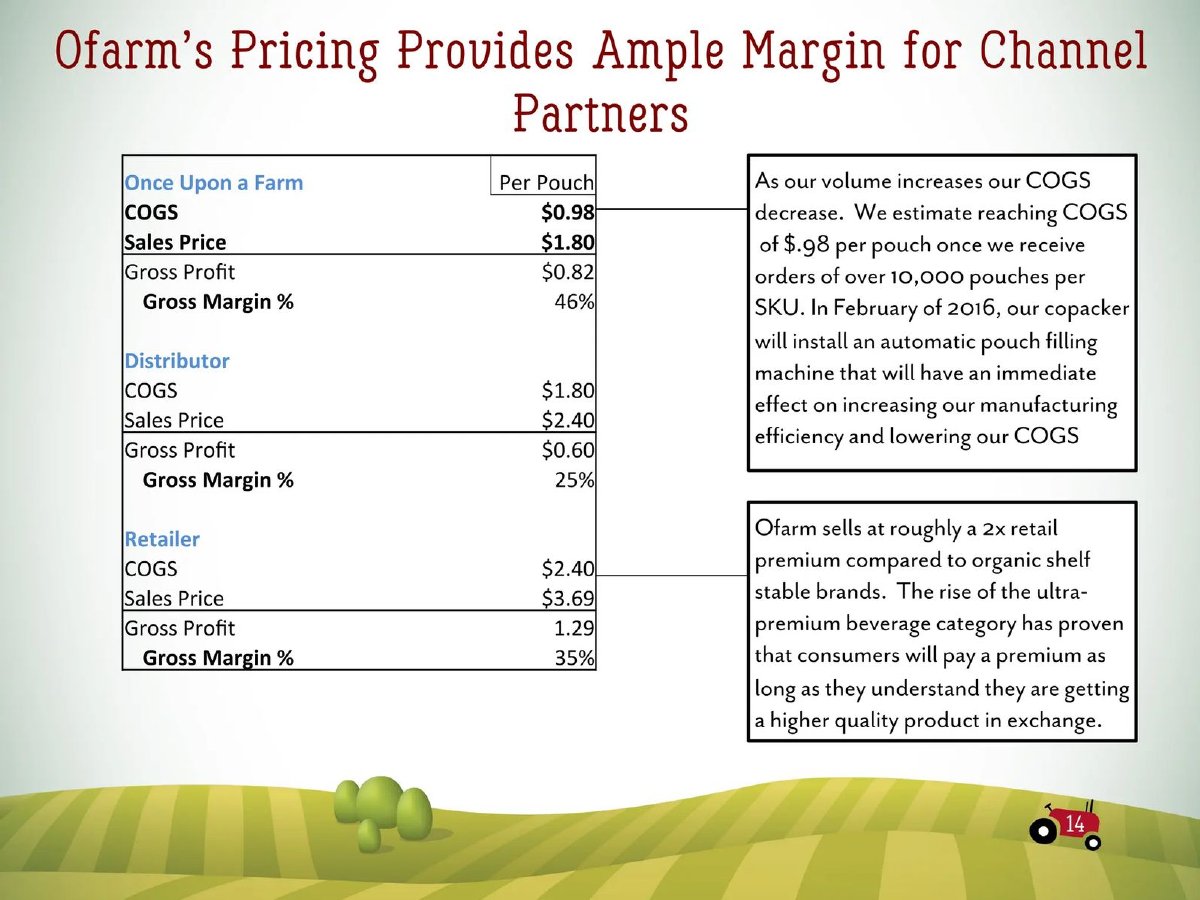
Once Upon a Farm deck, slide 17. Exact stored slide matched to this analysis.
Our analysis: It is the only slide here that ties a target cost to a specific threshold and names a physical cause. The margins check out ($0.82 ÷ $1.80 ≈ 46%; $0.60 ÷ $2.40 = 25%; $1.29 ÷ $3.69 ≈ 35%).
Evidence and limitation: Today's COGS is not stated, and the table presents the $0.98 estimate as if it were the current cost, so the 46% margin is a target. "Orders of over 10,000 pouches per SKU" is an order size, not monthly production volume, and the slide does not say when such orders are expected.
What a founder can adapt: Name the order size or volume that unlocks your target cost and the change that causes it, as this slide does.
Supporting analysis
What the deck claims: "Ofarm's Pricing Provides Ample Margin for Channel Partners": per pouch, COGS "$0.98", sales price "$1.80", gross profit "$0.82", "46%"; distributor buys at $1.80 and sells at $2.40 (25%); retailer buys at $2.40 and sells at $3.69 (35%). Callout: "As our volume increases our COGS decrease. We estimate reaching COGS of $.98 per pouch once we receive orders of over 10,000 pouches per SKU. In February of 2016, our copacker will install an automatic pouch filling machine that will have an immediate effect on increasing our manufacturing efficiency and lowering our COGS".
Presentation choice: It is the only slide here that ties a target cost to a specific threshold and names a physical cause. The margins check out ($0.82 ÷ $1.80 ≈ 46%; $0.60 ÷ $2.40 = 25%; $1.29 ÷ $3.69 ≈ 35%).
When it does not fit: Today's COGS is not stated, and the table presents the $0.98 estimate as if it were the current cost, so the 46% margin is a target. "Orders of over 10,000 pouches per SKU" is an order size, not monthly production volume, and the slide does not say when such orders are expected.
Food product sold directly, to grocery and specialty stores, and at farmers' markets. Stage and year are not stated on the slide.
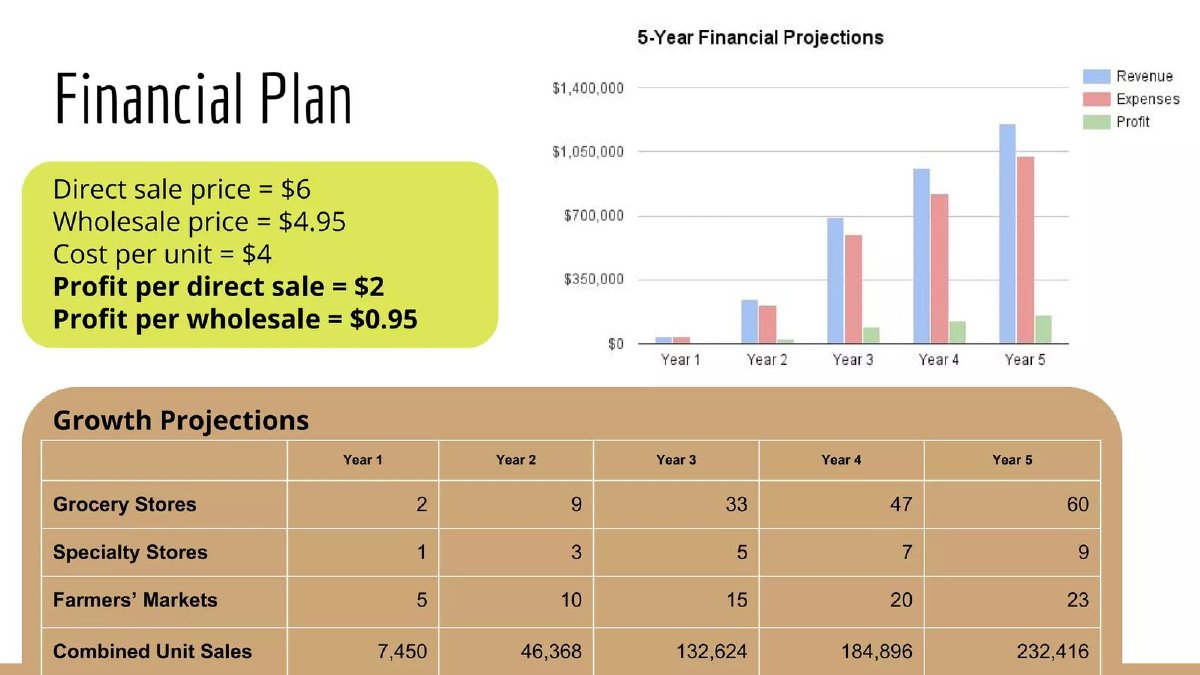
Parfait deck, slide 7. Exact stored slide matched to this analysis.
Our analysis: It is the opposite case: cost per unit stays at $4 while projected unit sales grow about 31 times (232,416 ÷ 7,450). That is conservative on cost, and the per-unit profits check out ($6 − $4 = $2; $4.95 − $4 = $0.95).
Evidence and limitation: The slide does not say whether $4 is today's measured cost or an estimate, or whether any savings at volume were considered. At $0.95 per wholesale unit, an investor will ask how margin improves.
What a founder can adapt: If you hold cost flat in your plan, say it is a deliberate assumption and show what margin would look like if the expected savings arrive.
Supporting analysis
What the deck claims: "Financial Plan": "Direct sale price = $6", "Wholesale price = $4.95", "Cost per unit = $4", "Profit per direct sale = $2", "Profit per wholesale = $0.95". "Growth Projections" table: grocery stores 2 → 60, specialty stores 1 → 9, farmers' markets 5 → 23, "Combined Unit Sales" 7,450 (Year 1), 46,368, 132,624, 184,896, 232,416 (Year 5). A "5-Year Financial Projections" bar chart shows revenue, expenses and profit.
Presentation choice: It is the opposite case: cost per unit stays at $4 while projected unit sales grow about 31 times (232,416 ÷ 7,450). That is conservative on cost, and the per-unit profits check out ($6 − $4 = $2; $4.95 − $4 = $0.95).
When it does not fit: The slide does not say whether $4 is today's measured cost or an estimate, or whether any savings at volume were considered. At $0.95 per wholesale unit, an investor will ask how margin improves.
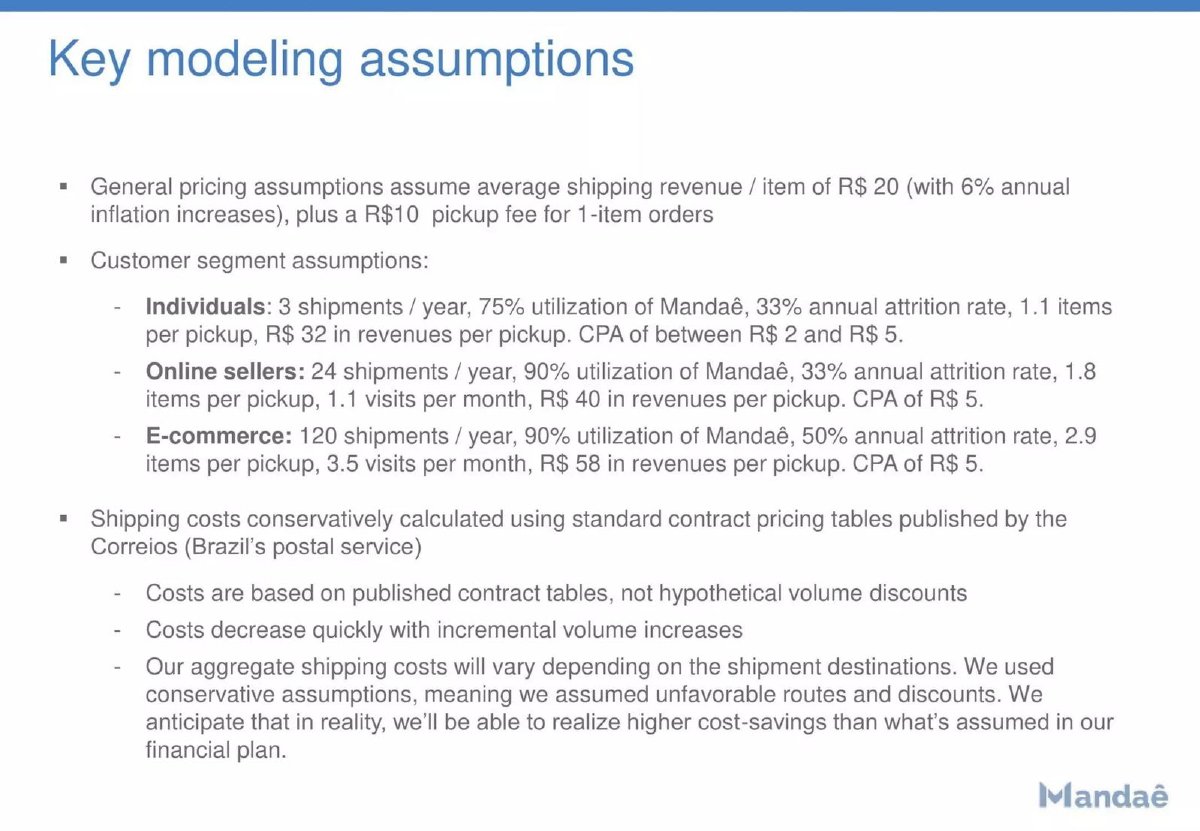
Brazilian shipping service that collects parcels from individuals and online sellers. Stage and year are not stated on the slide.
Mandaê deck, slide 27. Exact stored slide matched to this analysis.
Our analysis: It separates the cost it modelled (published supplier tables) from the savings it expects (volume discounts) and keeps the savings out of the plan. The cost source can be checked by an investor.
Evidence and limitation: "Costs decrease quickly with incremental volume increases" has no figures or volume thresholds, and the slide shows no cost per shipment. The expected savings are the company's belief, not a measured result.
What a founder can adapt: Base your plan on prices you can document today, and show expected volume discounts separately as upside.
Supporting analysis
What the deck claims: "Key modeling assumptions": average shipping revenue per item "R$ 20 (with 6% annual inflation increases)" plus a R$10 pickup fee for 1-item orders; segment assumptions for individuals, online sellers and e-commerce. "Shipping costs conservatively calculated using standard contract pricing tables published by the Correios (Brazil's postal service)"; "Costs are based on published contract tables, not hypothetical volume discounts"; "Costs decrease quickly with incremental volume increases"; "We used conservative assumptions, meaning we assumed unfavorable routes and discounts."
Presentation choice: It separates the cost it modelled (published supplier tables) from the savings it expects (volume discounts) and keeps the savings out of the plan. The cost source can be checked by an investor.
When it does not fit: "Costs decrease quickly with incremental volume increases" has no figures or volume thresholds, and the slide shows no cost per shipment. The expected savings are the company's belief, not a measured result.
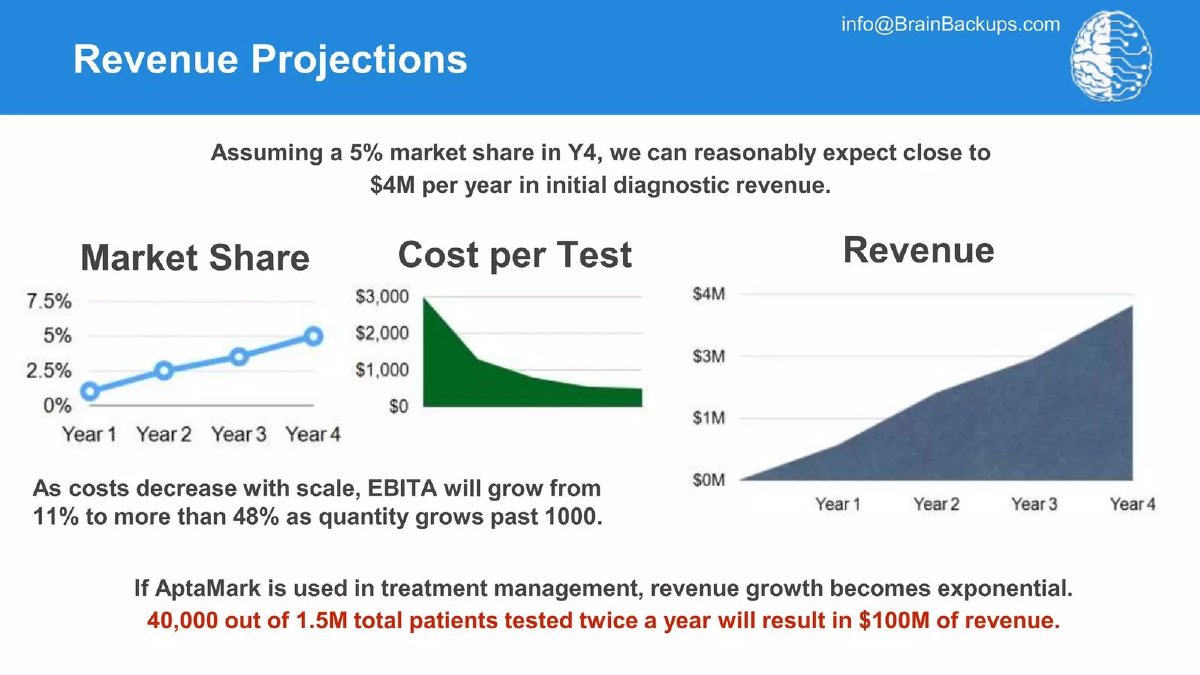
Diagnostic test company. The slide is titled "Revenue Projections"; stage and year are not stated.
Brain Backups deck, slide 8. Exact stored slide matched to this analysis.
Our analysis: It links a falling cost per test to a volume ("past 1000") and to a margin outcome, which is the chain an investor wants to follow.
Evidence and limitation: The whole slide is headed "Revenue Projections", so the cost curve is a projection, not a measured cost: its left-hand end is not today's cost. The chart has no x-axis labels at all, so nothing confirms the axis is volume rather than time, and no cost figures are printed. By our approximate reading the curve starts near the $3,000 gridline and settles below $1,000, but that is our reading of a picture, not a stated number. "1000" is not given a unit or period (tests per year is likely but not stated).
What a founder can adapt: If cost falls with volume, plot it against volume with labelled axes and give the cost at each point.
Supporting analysis
What the deck claims: "Assuming a 5% market share in Y4, we can reasonably expect close to $4M per year in initial diagnostic revenue." Three charts: "Market Share" (Year 1 to Year 4, rising to 5%), "Cost per Test" (y-axis $0 to $3,000, no x-axis labels) and "Revenue" (Year 1 to Year 4). "As costs decrease with scale, EBITA will grow from 11% to more than 48% as quantity grows past 1000."
Presentation choice: It links a falling cost per test to a volume ("past 1000") and to a margin outcome, which is the chain an investor wants to follow.
When it does not fit: The whole slide is headed "Revenue Projections", so the cost curve is a projection, not a measured cost: its left-hand end is not today's cost. The chart has no x-axis labels at all, so nothing confirms the axis is volume rather than time, and no cost figures are printed. By our approximate reading the curve starts near the $3,000 gridline and settles below $1,000, but that is our reading of a picture, not a stated number. "1000" is not given a unit or period (tests per year is likely but not stated).
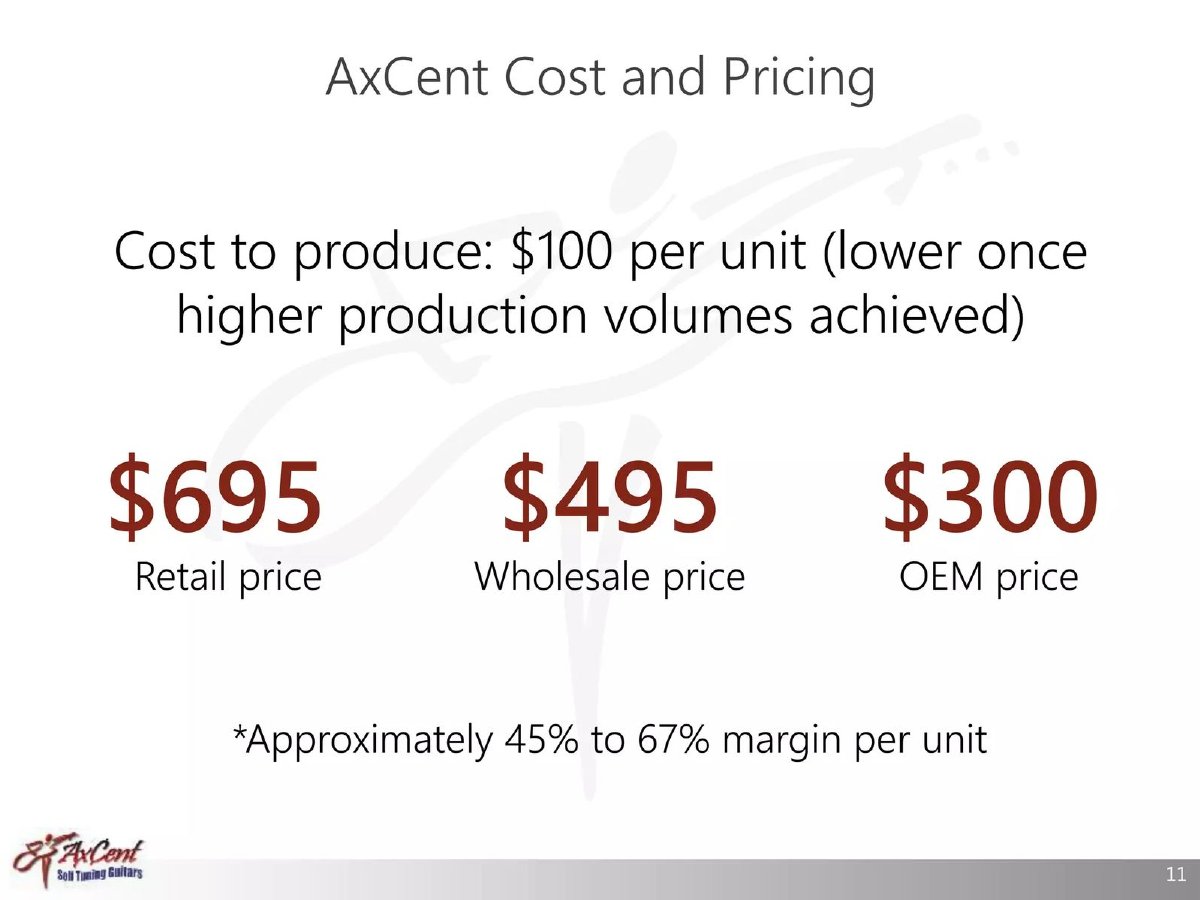
Self-tuning guitar company. Stage and year are not stated on the slide.
AxCent deck, slide 11. Exact stored slide matched to this analysis.
Our analysis: It states one production cost next to three prices, so an investor can check margin by channel.
Evidence and limitation: The slide does not say whether the $100 is measured, quoted by a manufacturer or estimated, and gives no volume for it or for the lower cost. The margin range does not follow from the figures shown: $100 against $300 gives 67%, but against $495 and $695 it gives about 80% and 86%, so the 45% must include costs the slide does not list.
What a founder can adapt: Replace "lower once higher production volumes achieved" with the volume and the cost you expect there, and say what the margin figure includes.
Supporting analysis
What the deck claims: "AxCent Cost and Pricing": "Cost to produce: $100 per unit (lower once higher production volumes achieved)". "$695 Retail price", "$495 Wholesale price", "$300 OEM price". "*Approximately 45% to 67% margin per unit".
Presentation choice: It states one production cost next to three prices, so an investor can check margin by channel.
When it does not fit: The slide does not say whether the $100 is measured, quoted by a manufacturer or estimated, and gives no volume for it or for the lower cost. The margin range does not follow from the figures shown: $100 against $300 gives 67%, but against $495 and $695 it gives about 80% and 86%, so the 45% must include costs the slide does not list.
Each cell reports what the slide itself states, and whether that figure is measured, quoted, forecast, targeted or unstated. Nothing here means the company lacked the information. No slide in this set states a cost per unit at two different stated volumes.
Example
Cost today
Volume or order size stated
Second cost stated
Reason given
Mycroclime
£140 per unit (measured: "actual" monthly costs)
15 units
No
No
Surf Shop Box
$41.19 per box ("Current", basis unstated)
No (year-end dates only)
$34.76 then $31.37 (forecast by year-end)
Caption: "buying power and volume"
Once Upon a Farm
Unstated
Orders over 10,000 pouches per SKU
$0.98 (target/estimate)
Automatic pouch filling machine
Parfait
$4 (basis unstated, held flat)
Unit sales projected, not tied to cost
Same $4 (forecast, unchanged)
None (cost does not move)
Mandaê
Unstated (quoted from published Correios tables)
No
No figures
Volume discounts, deliberately excluded
Brain Backups
Unstated (chart is a projection, axis unlabelled)
"Past 1000" (unit and period unstated)
No figures; curve ≈$3,000 to under $1,000 (our approximate reading)
"Scale"
AxCent
$100 per unit (basis unstated)
No
"Lower" (no figure)
"Higher production volumes"
Key Takeaways
Give the cost at two volumes. No slide here does: Mycroclime's measured "Cost for 15 units (£140each)" is one batch at one volume, and the rest tie their second number to a date, a target or nothing.
Start with today's measured cost and the quantity behind it. Mycroclime's is the only cost on these slides labelled actual.
Attach the target cost to a volume, not only a date. Once Upon a Farm names "orders of over 10,000 pouches per SKU"; Surf Shop Box uses year-end columns instead.
Show which line items are expected to fall. Surf Shop Box's forecast columns move merchandise, materials, shipping and pick-and-pack down and hold the donation flat.
Name the mechanism. Once Upon a Farm's automatic pouch filling machine is a specific cause; AxCent's "higher production volumes" is not.
Keep the base case conservative and say so. Mandaê models costs on published contract tables, "not hypothetical volume discounts".
Write your unit cost line
Fill one row for today and one for each volume step you are asking investors to believe.
Today. What does one unit cost you now, at what quantity, and is that a paid invoice, a quote or an estimate?
Target. What cost do you expect, at what production volume or order size, and by when?
Why it falls. Which line items fall, and what causes it: supplier price breaks, a machine, a cheaper route, fixed costs spread wider?
Base case. Which savings are in your plan, and which are upside you have left out?
Copyable framework: Today: [cost]/unit at [quantity] ([measured/quote/estimate]). At [volume] per [month/order]: [cost]/unit ([quote/estimate]), because [mechanism]. Plan assumes: [cost]; savings beyond that are upside.
Illustrative example 1 — written by us
Before: Cost to produce: $100 per unit (lower at higher volumes).
After: Today: $100/unit at 200 units (paid invoices). At 2,000 units per order: $72/unit (supplier quote), because of material price breaks and a second mould. Plan assumes $85; savings beyond that are upside.
What improved: Our illustrative rewrite, not any company's figures. It adds the quantity behind today's cost, the source of each number, the volume that unlocks the target and what the plan actually assumes.
What this guide adds
The unit economics guide covers the profit on one customer or order; the gross margin guide covers which margin you are quoting and what it includes; the financials guide covers forecasts and break-even volume; the hardware product guide asks for unit cost "today and at volume" in one worksheet line. None of them covers how to show and support the claim that cost per unit falls as you grow. That is the question here.
Five things to separate
This is our editorial checklist; no slide below covers all of it. Measured versus forecast: a cost you paid last month is evidence, a cost you expect next year is an estimate, and a supplier quote sits in between. Production volume versus order size: units you make per month is not the same as the size of one purchase order or one customer's order. Variable versus fixed: a lower cost per unit from spreading rent or salaries over more units is real, but it is different from paying less for materials, and investors will ask which one you mean. Stated future cost versus evidence of decline: a number for next year shows your target, not that costs have started falling. Capacity versus output: what a line or partner could make is not what it has made.
Where you have supplier quotes at different quantities, show the quantities. A quote at 10,000 units does not tell an investor the price at 1,000.
Common mistakes
A future cost with no volume. "Lower at scale" cannot be checked; "$72 at 2,000 units per order" can.
A target shown as today's cost. If a table uses the cost you hope to reach, label it as a target.
Order size read as production volume. One large order and steady monthly output are different claims.
Fixed and variable costs mixed. Spreading rent over more units is not the same as buying materials for less; say which you mean.
Margins that don't follow from the figures. If the stated margin needs costs the slide doesn't list, list them.
Diagnostic checklist
Today's cost per unit, the quantity it applies to and whether it is measured, quoted or estimated.
Each future cost tied to a production volume or order size, not only a date.
The line items that fall and the reason each falls.
Variable cost savings kept separate from fixed costs spread over more units.
The plan's cost assumption stated, with expected savings shown as upside.
Margins that can be recomputed from the figures on the slide.
Frequently asked questions
How we chose these examples
Corpus: published pitch deck teardowns on StartupFundraising.com. Founder-uploaded private decks are excluded. Searched 2026-09-30: the saved public slide text (pages 1–15 of each deck) plus the private research text recovered from every page of eligible decks and earlier batch files, 70,927 unique pages after removing duplicates by deck file and page. The recovered text was used only to find candidates.
Selection: we searched for cost per unit, unit cost, COGS, BOM, cost per test, economies of scale, volume discounts, minimum order, tooling, yield, utilisation and copacker near cost or volume wording, then set aside mining, cannabis cultivation, fund and public-company decks. Of about 40 founder slides left, we inspected ten original page images and kept seven that each teach something different. Invitae (page 15) shows measured cost per sample falling as volume rose but comes from a listed-company deck and was not used; Plantee (page 17) and EV Technology Group (page 14) were inspected and not used because they repeat a lesson already shown here (a cost-reduction target without a volume).
Overlap check: we read the unit economics, gross margin, financials, roadmap and hardware product guides; only the hardware product guide mentions cost at volume, in one worksheet line. None of these seven slides appears in another guide.
Images: all seven were rendered from the original public deck files (Mycroclime 15 pages, Surf Shop Box 29, Once Upon a Farm 21, Parfait 10, Mandaê 28, Brain Backups 18, AxCent 14) and matched to company and page on 2026-09-30 (editorial model review). No person has yet completed an editorial review of this page.
Future costs on these slides are the companies' forecasts or estimates. Chart readings marked approximate are ours. We make no claim that any company reached its target cost or that any slide affected a fundraising outcome.