Food and Restaurant Market Size Slides: 7 Real Examples
How food, restaurant and grocery startups size their market: tonnes of food, stores, restaurants or foodies.
Food Market Slide: Restaurants, Stores and the Customers You Can Serve
Food is the largest consumer category there is, so a food startup's market slide rarely lacks a big number. The useful slides count the restaurants, stores or eaters the company can actually reach, and say what each is worth. The slides below count very different things, from tonnes of surplus food to stores on a shelf map, and each leaves different questions open.
TL;DR
Count the customers you sell to (restaurants, stores or households) in the places you will launch, then multiply by what each is worth to you. Superfüds is the clearest small example: a TAM of 5,000 stores, 700 already served, with lifetime value and acquisition cost per store. Karma goes country by country with tonnes of surplus food, store counts and a launch city. Slides that stop at counts of people or businesses (Grapevine, Blackpepper) show who the customer is but not what the market is worth.
Food market slides from real pitch decks
Each example shows the slide above its analysis and links to the full teardown. Slides that count paying customers and their value come first. Claims are as shown on the slides; comments and calculations are ours.
Superfüds market slide — slide 3
Healthy-food brand and distributor to chain stores in Colombia.
Superfüds deck, slide 3. Exact stored slide matched to this analysis.
Our analysis: Stores counted, current share and unit value shown.
Evidence and limitation: It counts the stores it sells into, shows how many it already serves, and gives value and cost per store. Our calculations: 700 of 5,000 is 14% of the stated TAM; $75,151 ÷ $1,317 ≈ 57, slightly below the ratio of 59 shown. The slide does not turn stores into a money figure, and the LTV basis (years, margin) isn't given.
What a founder can adapt: "[N] stores in [chains/region]; serving [M]; LTV $[X] per store = $[N×X] potential ([basis])."
Supporting analysis
What the deck claims: "Acting as Distributors, we pushed Chain Stores in Colombia to create their first ever health food section, yielding 500% growth!" "TAM: 5.000 stores." "Currently serving: 700 stores." "LTV $75.151 CAC $1.317 Ratio: 59." "10X growth with same user base", with retailer and pharmacy chain logos.
Presentation choice: Investors see the penetration already achieved and the value of each new store.
When it does not fit: A ratio that doesn't match its own inputs.
App selling surplus food from restaurants and grocery stores.
Karma deck, slide 4. Exact stored slide matched to this analysis.
Our analysis: Tonnes and stores by country, down to a launch city.
Evidence and limitation: It counts supply in tonnes and stores per country and names a launch city with its own store count, which is the right local step. Our check of the value column at €12/kg: Sweden 225k t → €2.7Bn matches; UK 2.1M t → €25.2Bn, not the €30.8Bn shown; the other rows are within a few percent. The value is the retail worth of the food, not Karma's revenue, which would be a commission on it; the slide doesn't state one.
What a founder can adapt: "[City]: [N] restaurants + [M] stores × $[revenue per store] = $[X]. Country: [tonnes] × $[price] × [take]%."
Supporting analysis
What the deck claims: "Addressable market." Table by country: addressable surplus food in metric tonnes (restaurants + grocery stores), number of addressable restaurants + grocery stores, "Karma-Value (€12/kg)", starting city, stores in that city, and population. Sweden: 225k tonnes, 29k + 4k stores, €2,7Bn, Stockholm 0,9k + 0,9k. UK: 2,1M tonnes, 100k + 15k, €30,8Bn, London 10k + 9k. US: 28,5M tonnes, 270k + 41k*, €338,7Bn, New York 10k + 3k. "*conflicting numbers." Sources footnoted.
Presentation choice: The city column shows where the first customers are.
When it does not fit: Food value presented as your market; a row that doesn't compute.
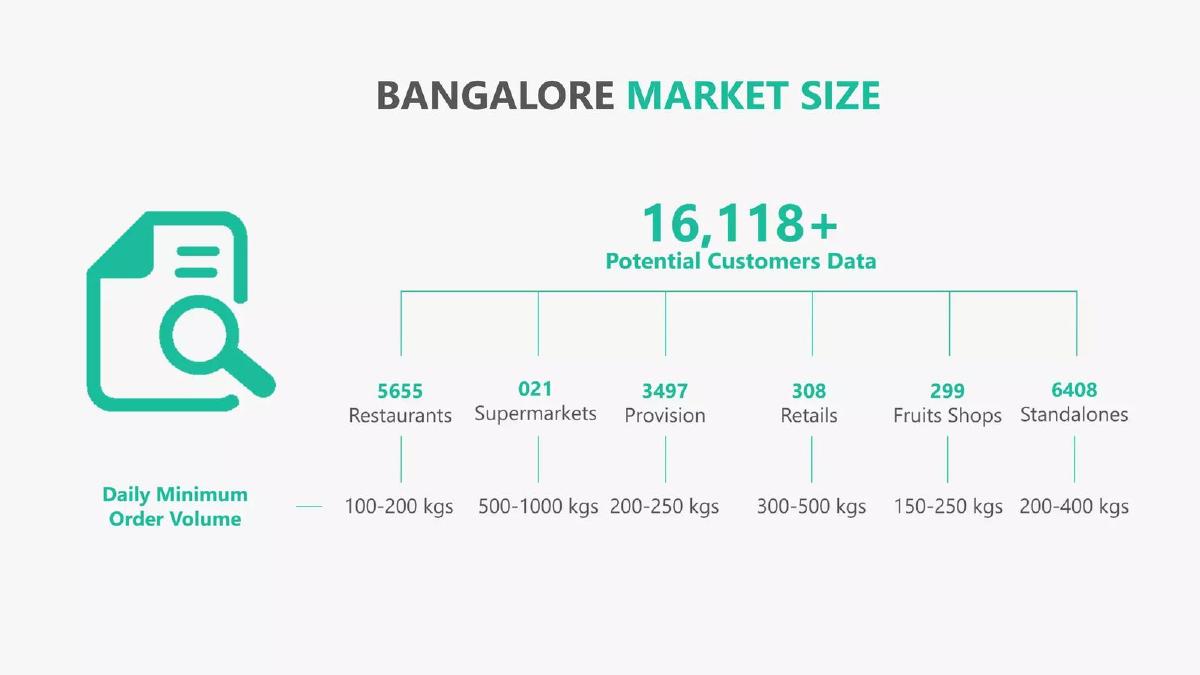
Fresh-produce supply to food businesses in Bangalore.
Farm Bazaar deck, slide 3. Exact stored slide matched to this analysis.
Our analysis: City customer counts with order volume per type.
Evidence and limitation: It counts buyers by type in one city and gives the daily order volume for each, which is most of what a bottom-up calculation needs. Our sum of the six counts is 16,188, not 16,118 (reading the supermarket figure as 21). The slide stops short of multiplying customers × volume × price, so there's no money figure.
What a founder can adapt: "[N] restaurants × [kg]/day × $[price]/kg × [days] = $[X] in [city]."
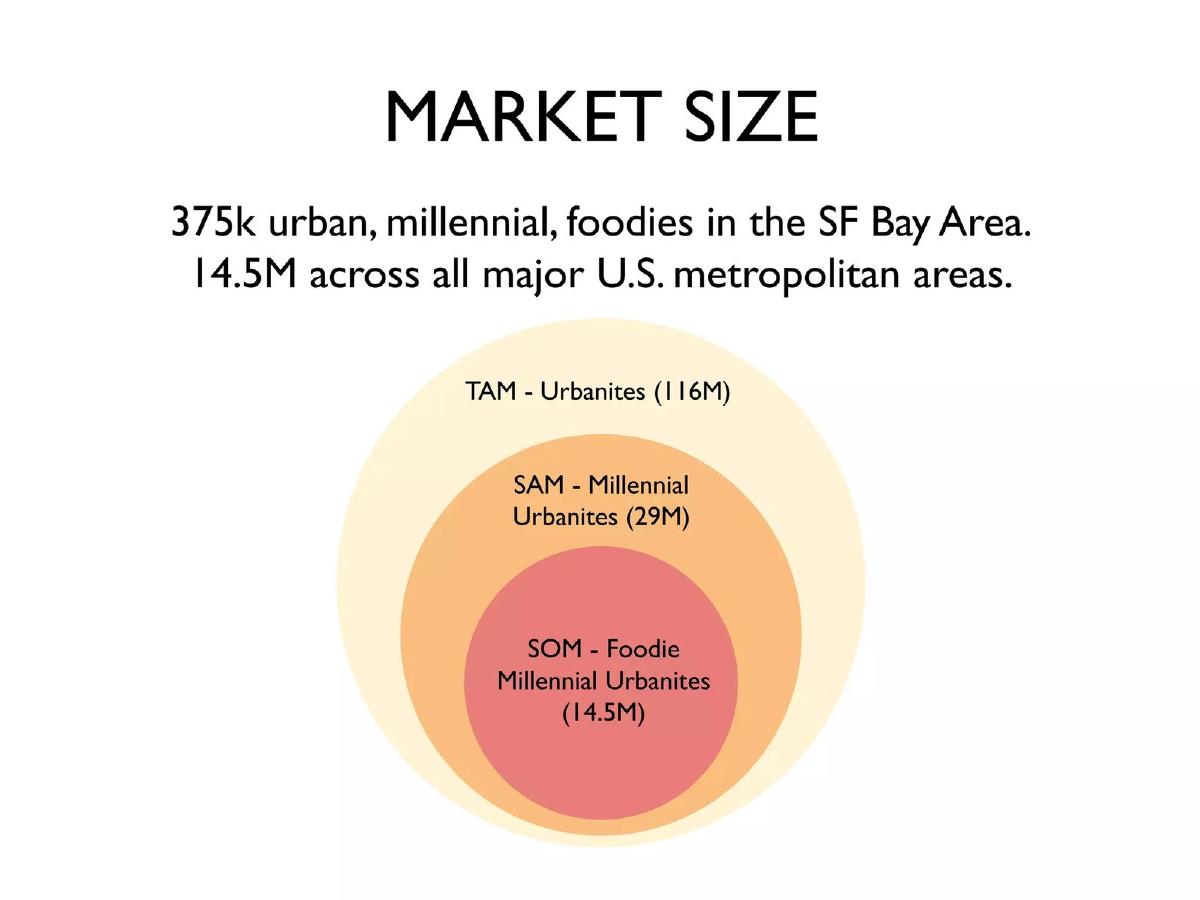
Blackpepper deck, slide 6. Exact stored slide matched to this analysis.
Our analysis: People at each tier, with a launch city.
Evidence and limitation: The tiers narrow in one unit, people, and name a launch area. Our calculation: the SOM is exactly half of the SAM, and it equals the national metro figure, so the "obtainable" tier is the whole foodie segment rather than a share the company expects to win. No money value, source or definition of "foodie" is given.
What a founder can adapt: "[N] [users] in [city] × $[revenue]/yr = $[X]; [M] nationally = $[Y] ([source])."
Supporting analysis
What the deck claims: "Market Size." "375k urban, millennial, foodies in the SF Bay Area. 14.5M across all major U.S. metropolitan areas." "TAM - Urbanites (116M)"; "SAM - Millennial Urbanites (29M)"; "SOM - Foodie Millennial Urbanites (14.5M)."
Presentation choice: Starting from the Bay Area gives a concrete first market.
When it does not fit: Calling the whole segment obtainable.
MiVesta deck, slide 5. Exact stored slide matched to this analysis.
Our analysis: Other sites' audiences plus a named target.
Evidence and limitation: It shows sourced audience sizes for existing food sites and names a target group and city. The users of different sites overlap, so they can't be added up, and the slide doesn't size its own reachable audience or revenue.
What a founder can adapt: "[N] [target users] in [city] ([source]) × [conversion]% × $[revenue] = $[X]."
Supporting analysis
What the deck claims: "Market for Cooking, Connected." Online "Foodies" table: FoodBuzz 14.0 M users, FoodNetwork 7.8 M, Allrecipes.com 7.3 M, Food.com 4.8 M, Epicurious 1.1 M apps / 1.5 M users, Big Oven 2.0 M apps / .5 M users (Sources: Quantcast 2010; CNN-app downloads & Harris Poll). "81% of US adults enjoy cooking @ home." "15% of US adults watch cooking TV 'very often.'" "Specific targets: Miami foodies (& beyond), active on social network, ages 20-55, middle income +."
Presentation choice: Sourced audience figures show the interest exists.
When it does not fit: Competitors' user counts as your market.
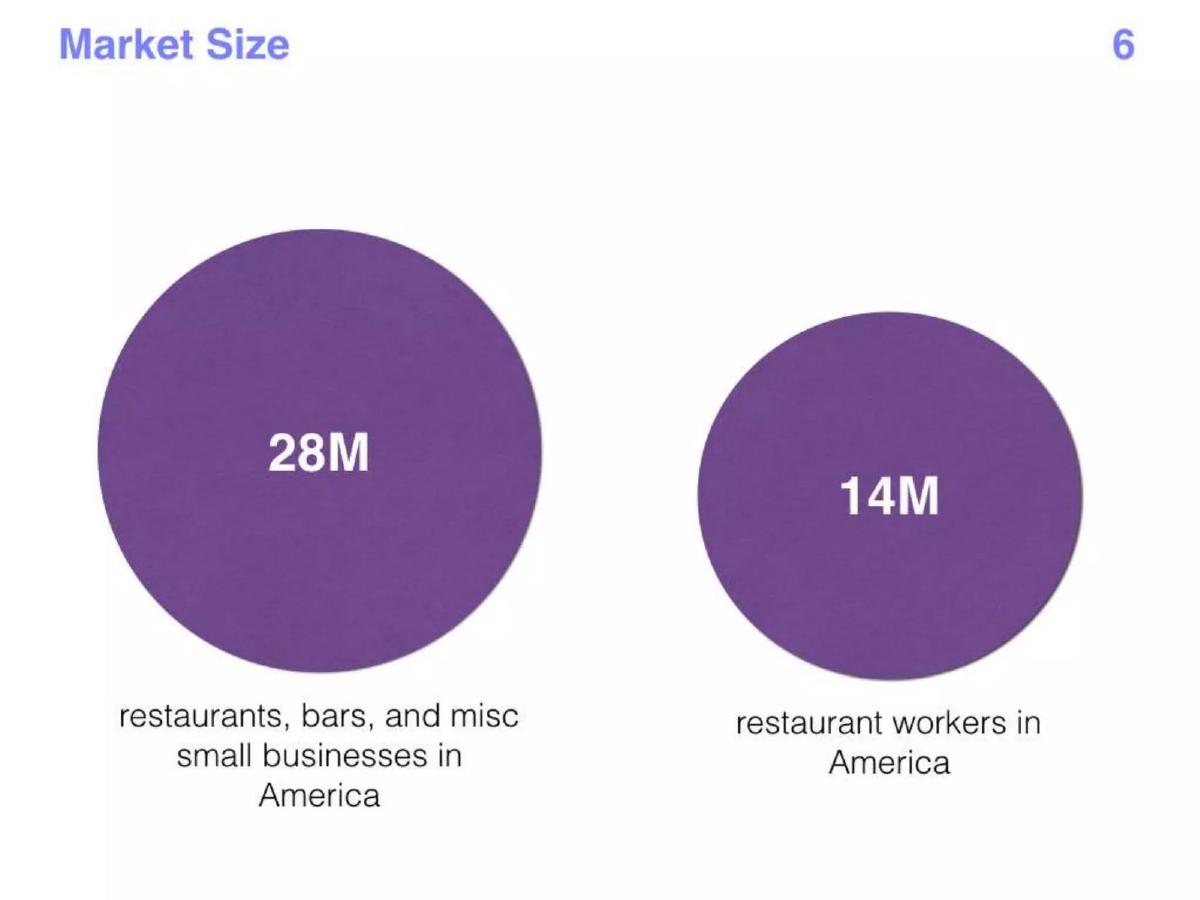
Product for restaurant and small-business workers.
Grapevine deck, slide 6. Exact stored slide matched to this analysis.
Our analysis: Customer and user counts only.
Evidence and limitation: Two counts that define the customer and the user. The first mixes restaurants with other small businesses, so it's not a restaurant count. There's no price, no source and no share the company expects to reach.
What a founder can adapt: "[N] restaurants ([source]) × $[price]/yr = $[X]; [M] workers × $[price] = $[Y]."
Supporting analysis
What the deck claims: "Market Size." "28M restaurants, bars, and misc small businesses in America." "14M restaurant workers in America."
Presentation choice: It is clear who the product is for.
When it does not fit: Counts with no value attached.
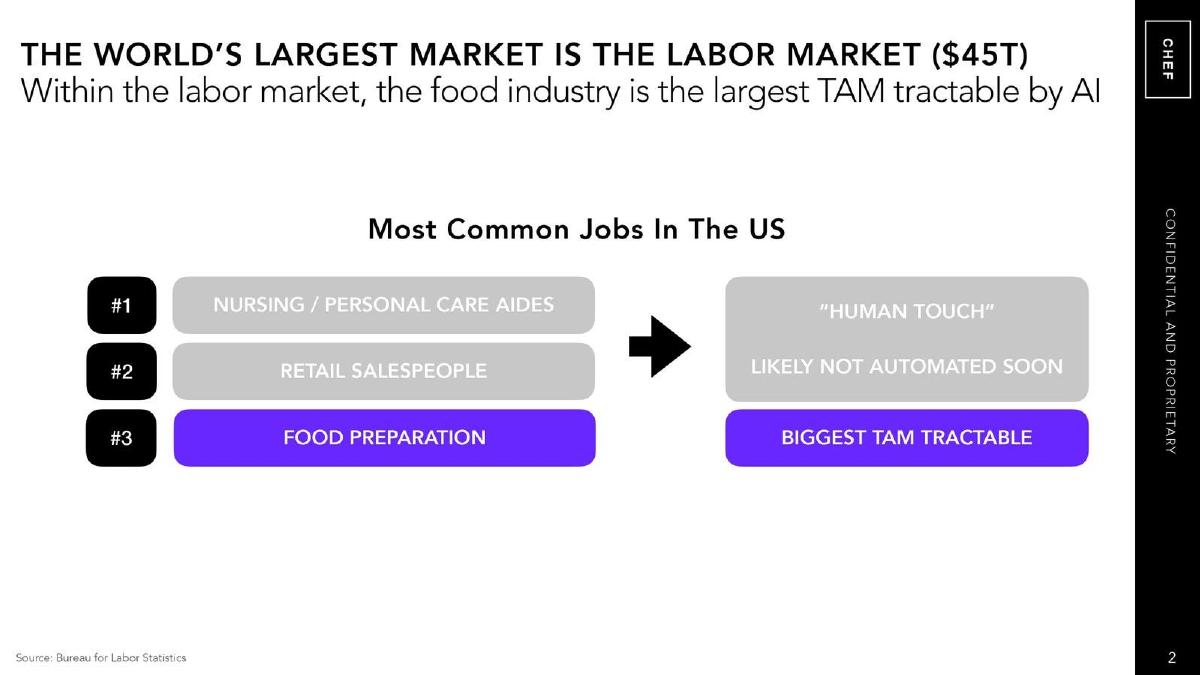
Chef Robotics deck, slide 2. Exact stored slide matched to this analysis.
Our analysis: Labour-replacement framing without a food-labour figure.
Evidence and limitation: Weaker example as a market slide. It argues that food preparation is the largest automatable job category, which is a useful framing for a robotics company selling labour replacement. But the only figure is the $45T global labour market; the food-preparation labour spend it targets is not sized.
What a founder can adapt: "[N] food-prep workers × $[wage] = $[X] labour spend ([source]); [share]% automatable."
Supporting analysis
What the deck claims: "The world's largest market is the labor market ($45T)." "Within the labor market, the food industry is the largest TAM tractable by AI." "Most Common Jobs in the US": #1 nursing / personal care aides, #2 retail salespeople, #3 food preparation, labelled "biggest TAM tractable." Source: Bureau of Labor Statistics.
Presentation choice: Sizing by labour cost fits an automation product.
When it does not fit: A global headline with no figure for your segment.
Before: "28M restaurants, bars, and misc small businesses in America. 14M restaurant workers in America."
After: "[N] US restaurants ([source, year]) × $[price]/yr = $[X]; launch in [city]: [M] restaurants = $[Y]."
What improved: Our illustrative rewrite of Grapevine's slide; bracketed text is a placeholder, not company fact.
What's different about food market sizing
Food businesses are local: delivery radius, distribution and store shelves decide who can buy. National food spending says little about a startup that serves one city. The strongest slides count customers in a launch city or a set of chains, and give the value of each, whether that is order volume, subscription or lifetime value.
What investors check
Who pays: the restaurant, the store or the eater. Which city or chain comes first. Whether the value is your revenue or the value of the food itself. Whether the table rows add up, and whether sources are given.
How we read each slide
We quote the text on the slide images and mark our own arithmetic as ours. We have not checked any market figure or source. Page numbers are pages in the original deck file. All seven images were already stored and were checked pixel-for-pixel against fresh renders of the decks.
Common mistakes
Food value as revenue. State what you earn on it.
National figure for a local business. Size the launch city.
Totals that don't add up. Check every row.
Counts with no value. Attach revenue per customer.
Diagnostic checklist
Paying customer named.
Launch city or chain counted.
Revenue per customer shown.
Current customers shown.
Rows and totals checked.
Frequently asked questions
How should a food or restaurant startup size its market?
Count the restaurants, stores or households you sell to in your launch area and multiply by revenue per customer. Superfüds shows a TAM of 5,000 stores with 700 served and value per store.
Can I use the value of all food sold as my market?
Only as context. Karma values surplus food at €12/kg, which is the food's worth, not what Karma earns. State your commission or price.
How we chose these examples
Corpus: published pitch deck teardowns on StartupFundraising.com. Founder-uploaded private decks are excluded.
Selection (2026-09-26): we searched teardown slide text for market-size wording together with restaurant, food, meal or grocery terms, reviewed the candidate slides from the deck files, and kept seven.
Excluded: slides already analysed in the consumer product market guide, agriculture and farm-input decks (a different customer), and slides where food is mentioned but not sized.
Page numbers are pages in the original deck files. All seven images were already stored and were checked pixel-for-pixel against fresh renders on 2026-09-26.
Market figures and sources are quoted from the slides and not independently verified. Calculations (shares, sums, per-row checks) are ours and marked as such. Farm Bazaar's supermarket count is printed "021"; we read it as 21.
Review: slide images were checked on 2026-09-26 and matched to company, deck and page (editorial model review). No person has yet completed an editorial review of this page. We make no claim that any slide caused a fundraising outcome.