Consumer Brand Market Size Slides: 7 Real Examples
How consumer product and food and beverage brands size their market: the shelf category they sell into, the price markup, the buyers they target.
Consumer Brand Market Slide: Size the Shelf You Sell On
A consumer brand competes for a place on a shelf or in a feed, next to named rivals, at a price. The strongest consumer market slides size that shelf: the category the product replaces, in the country it launches in, with a source. Weaker ones show a broad total such as "health and wellness" or "beauty" that no single product could reach. This guide compares seven real consumer brand market slides, from a category slide with a markup figure to a slide whose headline number covers a whole industry.
TL;DR
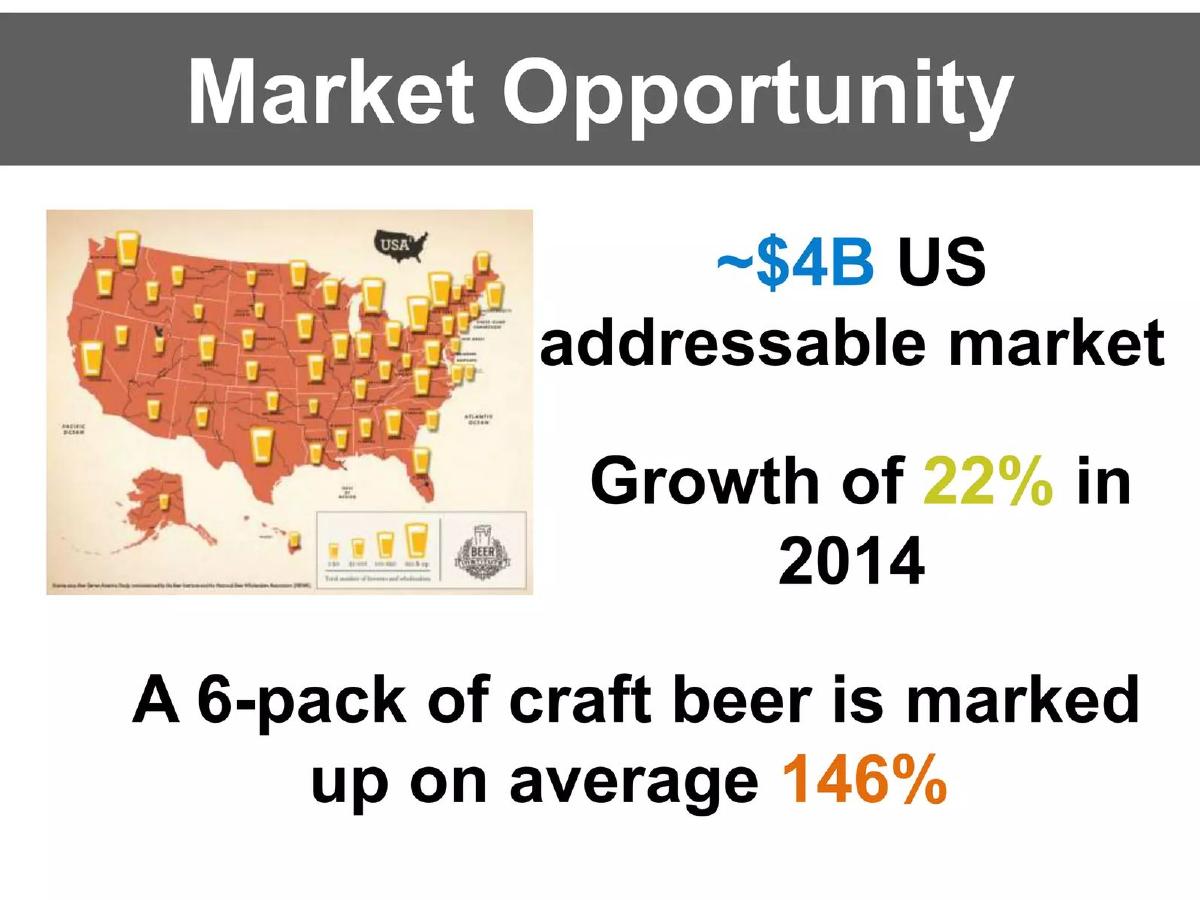
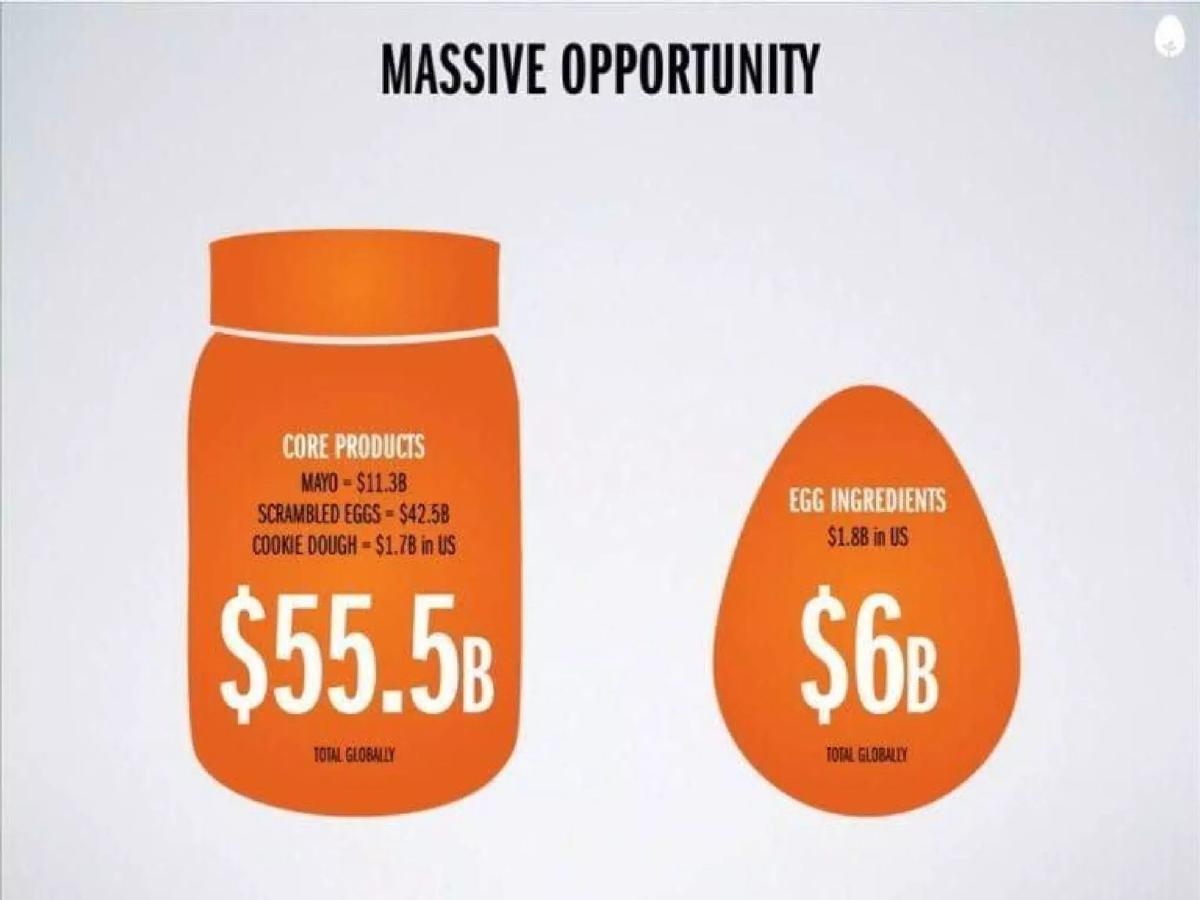
Size the category your product replaces on the shelf, in your launch country, and cite the source. Brewstrap shows a "~$4B US addressable market" for craft beer and says a 6-pack is "marked up on average 146%". Eat Just (then Hampton Creek) splits its opportunity by product: mayo $11.3B, scrambled eggs $42.5B, cookie dough $1.7B in the US. Ryu's headline is "$815 billion by 2021" for all health and wellness, which is far larger than the athletic apparel it sells.
Consumer brand market slides from real pitch decks
Each example shows the slide above its analysis and links to the full teardown. Slides that size a specific category come first. Claims are as shown on the slides; comments are ours.
Brewstrap market slide — slide 10
Online marketplace selling beer direct from small craft breweries, US.
Brewstrap deck, slide 10. Exact stored slide matched to this analysis.
Our analysis: One category, one country, plus the margin opportunity.
Evidence and limitation: It names one category (US craft beer), one country and a growth rate, then adds the markup that a direct channel could capture. It gives no source on the page and no share target.
What a founder can adapt: "[Category] in [country]: $[X] ([source], [year]). Retail markup: [N]%."
Supporting analysis
What the deck claims: "Market Opportunity." "~$4B US addressable market." "Growth of 22% in 2014." "A 6-pack of craft beer is marked up on average 146%." A US map of breweries.
Presentation choice: The markup figure explains why a direct channel has room.
When it does not fit: Category figures with no source.
Plant-based egg replacement products, early deck under the Hampton Creek name.
Eat Just deck, slide 10. Exact stored slide matched to this analysis.
Our analysis: Market split by the products on sale.
Evidence and limitation: It sizes each product line it actually sells and separates consumer products from ingredients. The labels mix global and US figures, and no source appears on this page, so the totals are hard to check.
What a founder can adapt: "[Product A] $[X], [Product B] $[Y] in [country] ([source]). Ingredients: $[Z]."
Supporting analysis
What the deck claims: "Massive Opportunity." "Core products: Mayo = $11.3B, Scrambled eggs = $42.5B, Cookie dough = $1.7B in US." "$55.5B total globally." "Egg ingredients $1.8B in US." "$6B total globally."
Presentation choice: Investors can see which shelf each product competes on.
When it does not fit: Mixing US and global figures in one total.
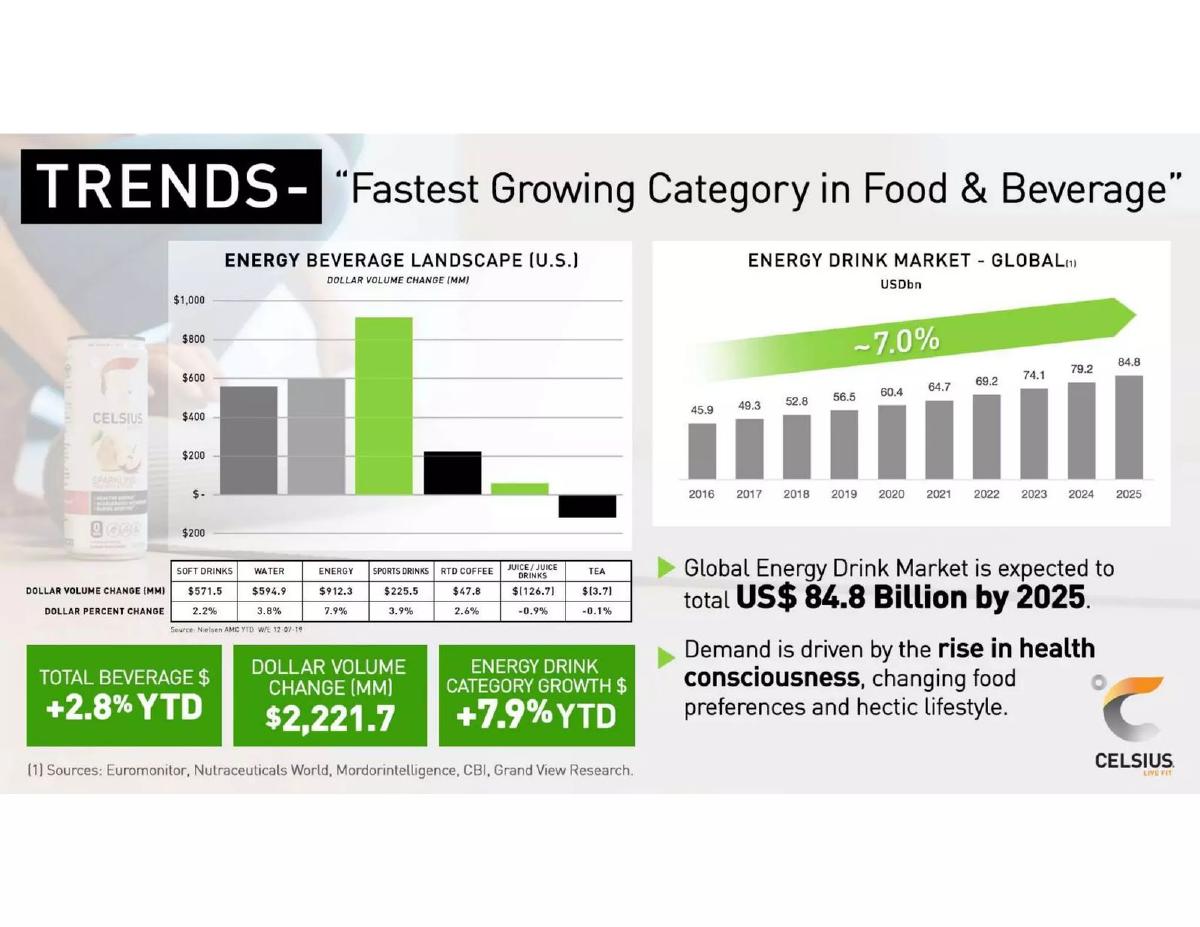
Functional energy drink brand, 2020 investor presentation.
Celsius deck, slide 4. Exact stored slide matched to this analysis.
Our analysis: Category growth against the aisle, with sources.
Evidence and limitation: It compares its category with the rest of the beverage aisle and names its sources. It sizes the whole energy-drink category rather than the healthier segment Celsius sells into.
What a founder can adapt: "[Category] +[N]% vs total [aisle] +[M]% ([source]). Size: $[X]."
Supporting analysis
What the deck claims: "Trends – 'Fastest Growing Category in Food & Beverage'." A US beverage chart by category (dollar volume change). "Global Energy Drink Market is expected to total US$ 84.8 Billion by 2025." "Energy drink category growth $ +7.9% YTD" against "Total beverage $ +2.8% YTD". Sources: Euromonitor, Nutraceuticals World, Mordor Intelligence, CBI, Grand View Research.
Presentation choice: Growth relative to neighbouring categories shows where shelf space is moving.
When it does not fit: Sizing the whole category when you sell one segment.
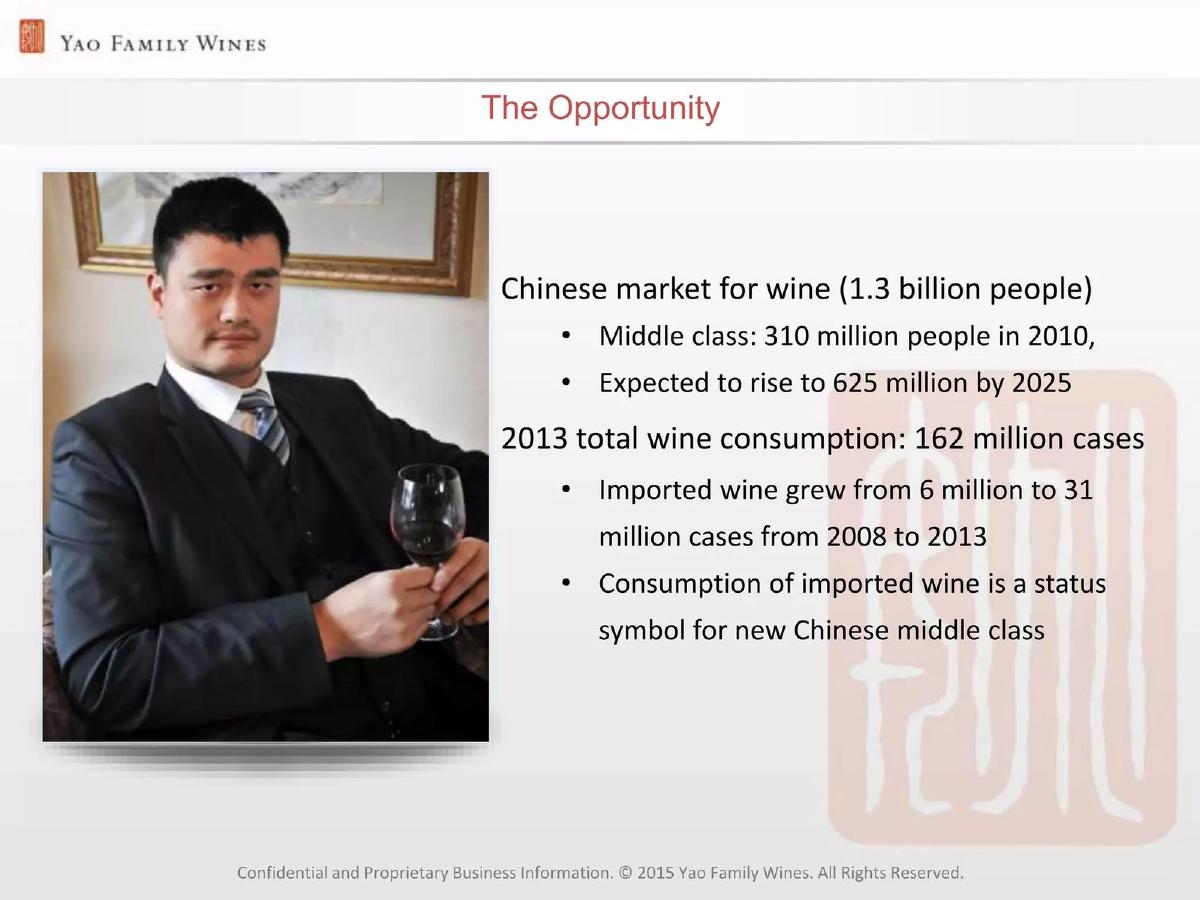
Napa Valley wine brand selling in China and the US, 2015 deck.
Yao Family Wines deck, slide 7. Exact stored slide matched to this analysis.
Our analysis: Unit counts narrowed to the imported segment.
Evidence and limitation: It counts the market in cases and narrows from all wine to imported wine, the segment a Napa brand competes in. It gives no price per case, no dollar figure and no source.
What a founder can adapt: "[Segment]: [N] units/yr, up from [M] ([source]). At $[price] = $[X]."
Supporting analysis
What the deck claims: "The Opportunity." "Chinese market for wine (1.3 billion people)." "Middle class: 310 million people in 2010, expected to rise to 625 million by 2025." "2013 total wine consumption: 162 million cases." "Imported wine grew from 6 million to 31 million cases from 2008 to 2013."
Presentation choice: Case counts for imported wine match what the brand sells.
Blossom Protein deck, slide 5. Exact stored slide matched to this analysis.
Our analysis: Two sourced categories and a share target.
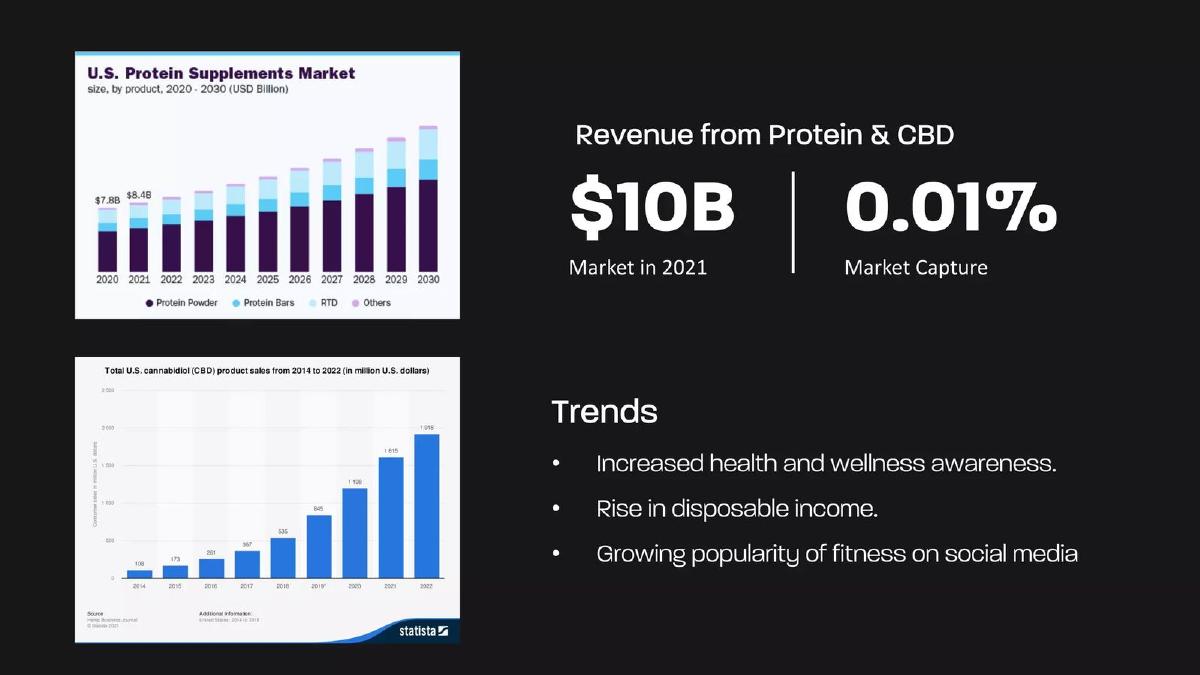
Evidence and limitation: It uses two sourced category charts and states a share target. It adds the protein and CBD categories together, although the product sits where they overlap, and 0.01% is given without a revenue figure.
What a founder can adapt: "[Category] $[X] ([source]). Target: [N]% = $[Y] by [year]."
Supporting analysis
What the deck claims: A "U.S. Protein Supplements Market" chart (2020–2030) and a Statista chart of US CBD product sales. "Revenue from Protein & CBD: $10B Market in 2021." "0.01% Market Capture." Trends: health and wellness awareness, disposable income, fitness on social media.
Presentation choice: A stated share lets investors turn the market into revenue.
When it does not fit: Adding two categories you only partly overlap.
Ryu deck, slide 7. Exact stored slide matched to this analysis.
Our analysis: Relevant figures in small print, broad total as headline.
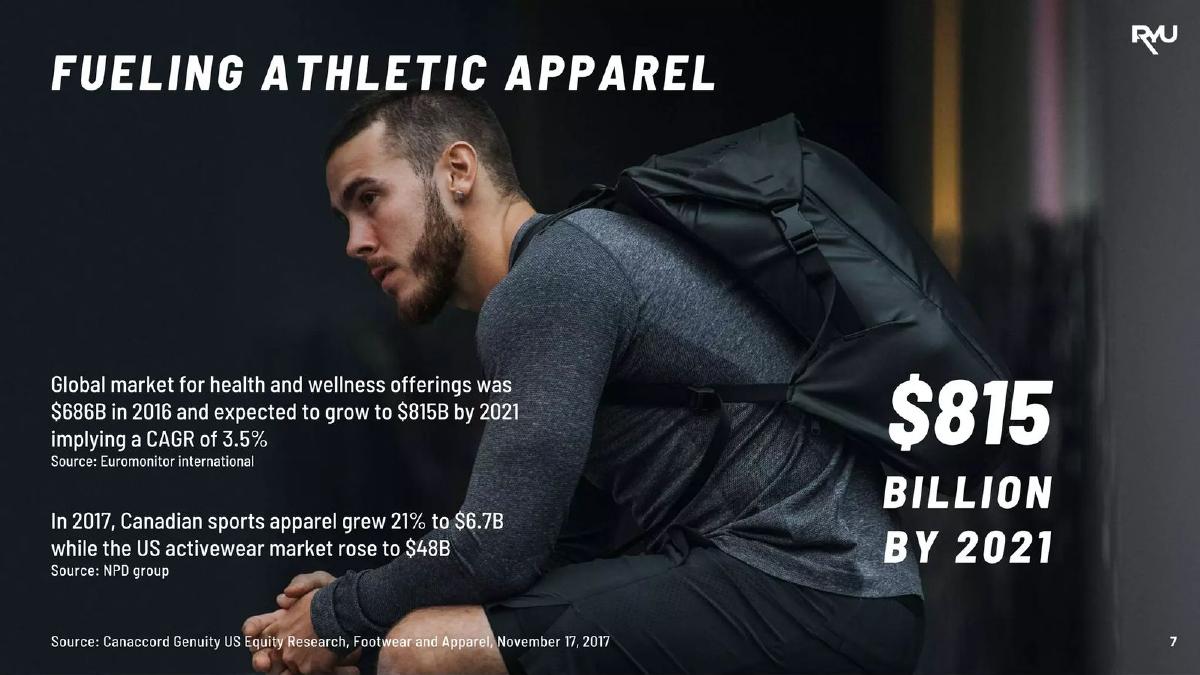
Evidence and limitation: Weaker example. The smaller figures ($6.7B Canadian sports apparel, $48B US activewear) match what Ryu sells and have sources, but the headline number is all health and wellness.
What a founder can adapt: Headline: "$[X] [activewear] in [country]"; wellness trend as supporting text.
Supporting analysis
What the deck claims: "Fueling Athletic Apparel." "Global market for health and wellness offerings was $686B in 2016 and expected to grow to $815B by 2021 implying a CAGR of 3.5%" (Euromonitor). "In 2017, Canadian sports apparel grew 21% to $6.7B while the US activewear market rose to $48B" (NPD Group). Headline: "$815 billion by 2021."
Presentation choice: Investors read the headline first; it should be the category you sell into.
When it does not fit: Leading with a lifestyle total.
What improved: Our illustrative rewrite of Ryu's slide using a figure already on it; bracketed text is a placeholder, not company fact.
What's different about consumer market sizing
Retail categories are measured closely by research firms, so investors expect a named category figure rather than a guess. They also know a new brand wins a small share of one category first. A slide that names that category, its price level and its growth tells them more than a large lifestyle total.
What investors check
Whether the category matches the product (craft beer, not all alcohol). Whether the figure is for the country the brand sells in. Whether a share or unit target links the category to the company's own revenue. Whether the growth claim has a source and a date.
How we read each slide
We quote the text on the slide images. We have not checked any market figure or source. Page numbers are pages in the original deck file. Two images were already stored and were checked against the decks; five were rendered from the deck PDFs.
Common mistakes
Lifestyle total. Lead with the category you sell into.
Mixed geography. Keep US and global figures apart.
No unit. Say whether a figure is dollars, cases or people.
No share. Link the category to your own revenue.
Diagnostic checklist
Shelf category named.
Launch country stated.
Source cited.
Share or unit target given.
Frequently asked questions
How should a consumer brand size its market?
Use the retail category the product replaces, in the launch country, with a source. Brewstrap shows a ~$4B US craft beer market.
Should a brand use a big lifestyle total like health and wellness?
Use it as context at most. Ryu's slide leads with $815B for health and wellness, while its $48B US activewear figure matches what it sells.
How we chose these examples
Corpus: published pitch deck teardowns on StartupFundraising.com. Founder-uploaded private decks are excluded.
Selection (2026-09-26): we searched consumer, food and beverage, apparel and beauty teardowns for market size and market opportunity headings, scanned fifteen candidate decks around the matching pages, and kept seven.
Excluded: Popping (marketplace, not a consumer product), Up All Night (events), T&J Designs (matching page is social traction), HomeRoots (already in the TAM/SAM/SOM guide), Feminora (medical device), Belgian Boys (pages unreadable). Teardown text numbering differed from deck-file pages for Blossom Protein (teardown p3), Beautyfyn (p4), Celsius (p2) and Yao Family Wines (p5); pages were matched by eye.
Page numbers are pages in the original deck files. Celsius and Blossom Protein images were already stored and were checked against the decks; the other five were rendered from the deck PDFs. All seven decks were confirmed as published teardowns on 2026-09-26.
Market figures and sources are quoted from the slides and not independently verified.
Review: slide images were checked on 2026-09-26 and matched to company, deck and page (editorial model review). No person has yet completed an editorial review of this page. We make no claim that any slide caused a fundraising outcome.