How hardware and device startups size their market: units times price, procedure counts, buyer counts and category spend.
Hardware Market Slide: Size It in Units, Buyers and Price
A hardware market can be counted: devices sold per year, procedures performed, vehicles on the road, buyers who could install the product. The strongest hardware market slides use those counts and multiply by a price, so investors can check the maths. Weaker ones show a single industry total or a unit count with no link to the company's own device. This guide compares six real hardware market slides, from a one-line bottom-up calculation to a slide that counts units without saying what the company would earn.
TL;DR
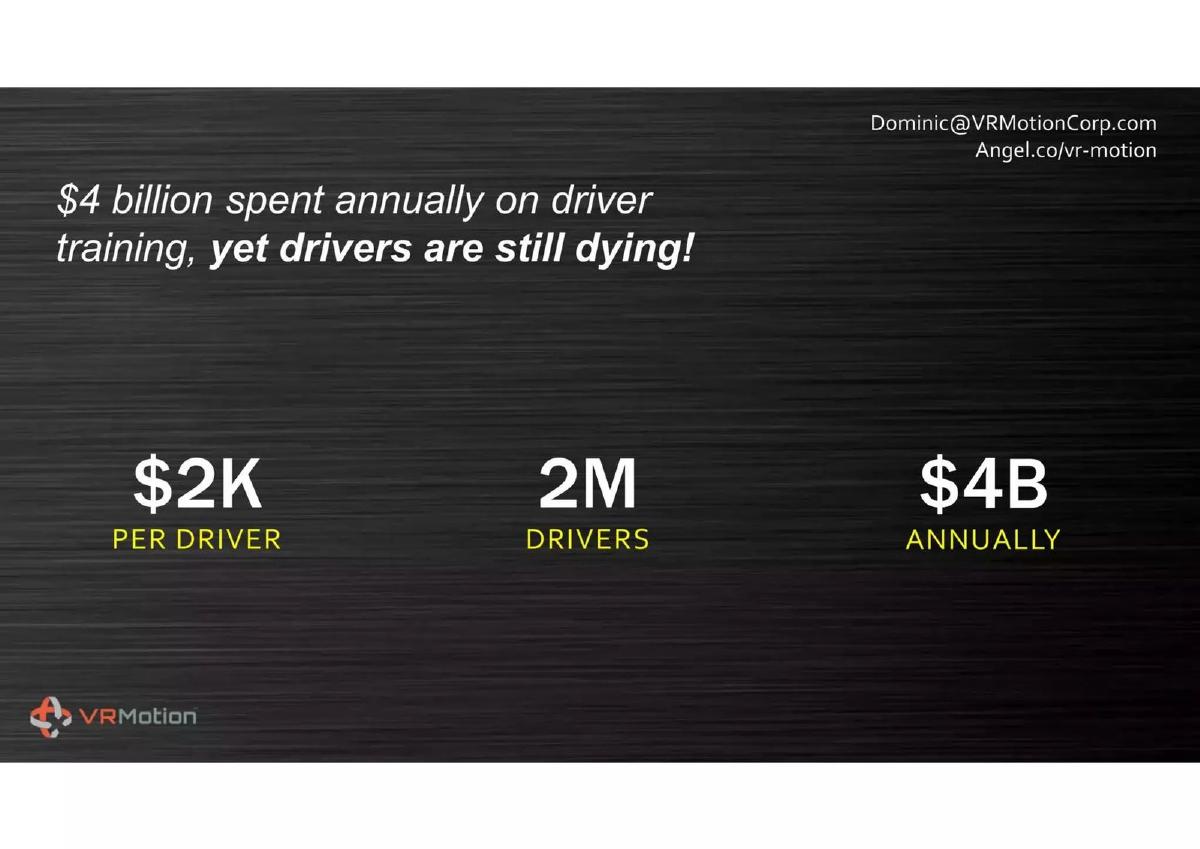
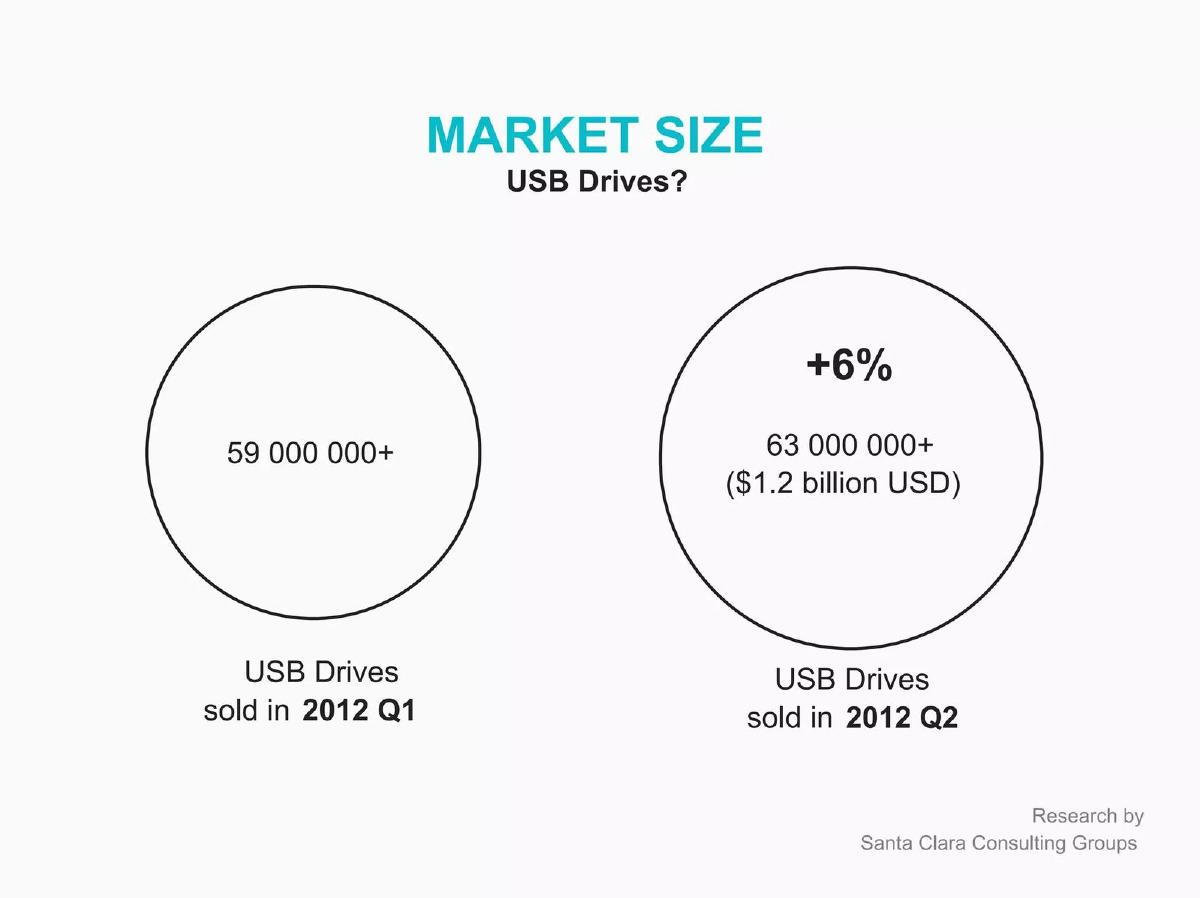
Count the buyers or units, multiply by your price, and show the result. VRMotion shows "$2K per driver", "2M drivers", "$4B annually". Axcess Instruments counts 1,000,000 U.S. laparoscopic gallbladder surgeries next to a $700 million U.S. trocar market. WiKey shows USB drives sold per quarter but not what share or price WiKey expects, so the slide leaves its own opportunity open.
Hardware market slides from real pitch decks
Each example shows the slide above its analysis and links to the full teardown. Slides with a checkable calculation come first. Claims are as shown on the slides; comments are ours.
VRMotion market slide — slide 3
Virtual reality driving simulators for professional driver training.
VRMotion deck, slide 3. Exact stored slide matched to this analysis.
Our analysis: Price × buyers, in one line.
Evidence and limitation: The whole calculation fits on one line and can be checked: $2,000 × 2 million = $4 billion. It doesn't say which drivers (country, vehicle type) or where the numbers come from, and it sizes current training spend rather than what a simulator would capture.
What a founder can adapt: "$[price] per [buyer] × [N] [buyers] = $[X] per year ([source])."
Supporting analysis
What the deck claims: "$4 billion spent annually on driver training, yet drivers are still dying!" "$2K PER DRIVER", "2M DRIVERS", "$4B ANNUALLY".
Presentation choice: Investors can check the maths in seconds.
When it does not fit: Leaving out which buyers and where.
Single-use laparoscopic access device (trocar) with built-in imaging.
Axcess Instruments deck, slide 5. Exact stored slide matched to this analysis.
Our analysis: Narrowed to the device category, with procedure counts.
Evidence and limitation: It narrows from all laparoscopy to the device category it sells (trocars) and counts the procedures it targets. It doesn't give a price per device or a source, so the link between procedure counts and dollars isn't shown.
What a founder can adapt: "[N] [procedures]/yr × $[price per device] = $[X]. Category: $[Y]."
Supporting analysis
What the deck claims: "Market Opportunity." "AxcessPort Share: 1,000,000 US laparoscopic gallbladder surgeries; 500,000 US tubal ligations surgeries." "AGR 7-8%." "$8.3 Billion Global laparoscopic market", "$2.8 Billion US laparoscopic market", "$700 Million US trocar market". Nested circles: Global market, US laparoscopic, US trocar, Axcess Instruments market.
Presentation choice: Procedure counts are the natural unit for a single-use surgical device.
When it does not fit: Procedure counts with no price.
One Mobility deck, slide 6. Exact stored slide matched to this analysis.
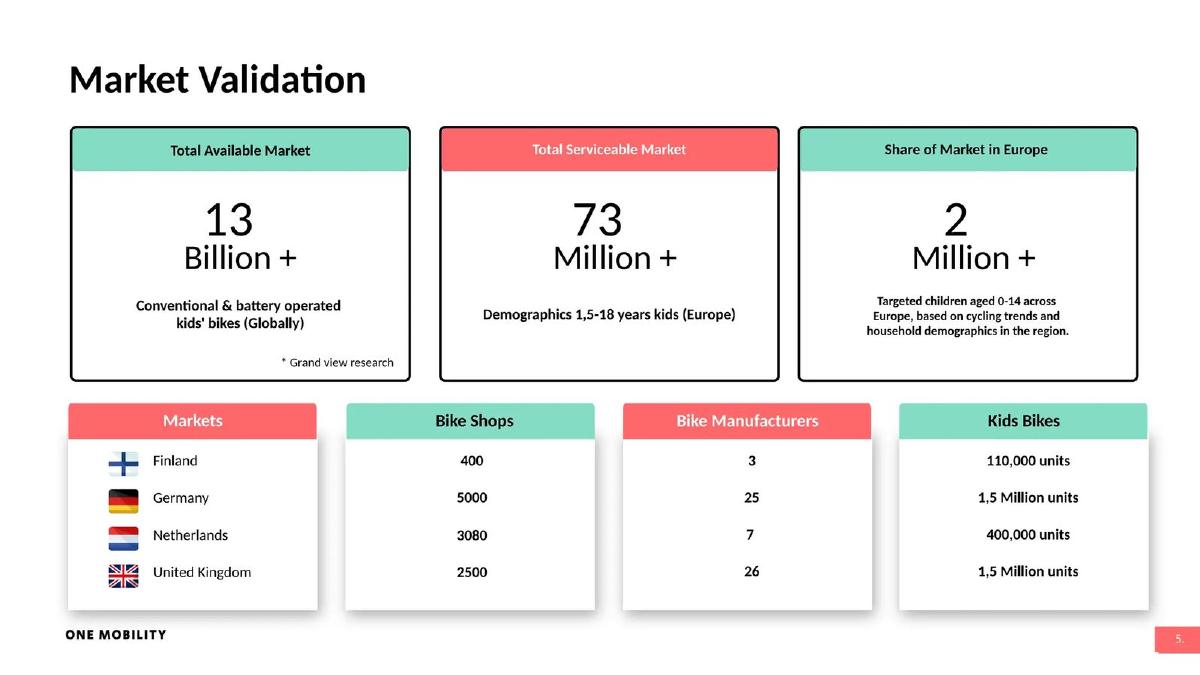
Our analysis: Country-level unit counts, mixed headline units.
Evidence and limitation: It names four launch countries and counts units, shops and manufacturers in each. The three headline boxes mix dollars (13 billion) and children (73 million, 2 million), so the TAM, SAM and share are not in the same unit.
What a founder can adapt: "[Country]: [N] units/yr, [M] shops. × $[subscription] = $[X]."
Supporting analysis
What the deck claims: "Market Validation." "Total Available Market 13 Billion + Conventional & battery operated kids' bikes (Globally)" ("Grand view research"). "Total Serviceable Market 73 Million + Demographics 1,5-18 years kids (Europe)". "Share of Market in Europe 2 Million + Targeted children aged 0-14 across Europe." A table for Finland, Germany, Netherlands and United Kingdom: bike shops (400, 5000, 3080, 2500), bike manufacturers (3, 25, 7, 26) and kids' bikes (110,000, 1.5 million, 400,000, 1.5 million units).
Presentation choice: Per-country unit and shop counts show where to launch.
When it does not fit: Dollars and people in the same funnel.
Fisker deck, slide 15. Exact stored slide matched to this analysis.
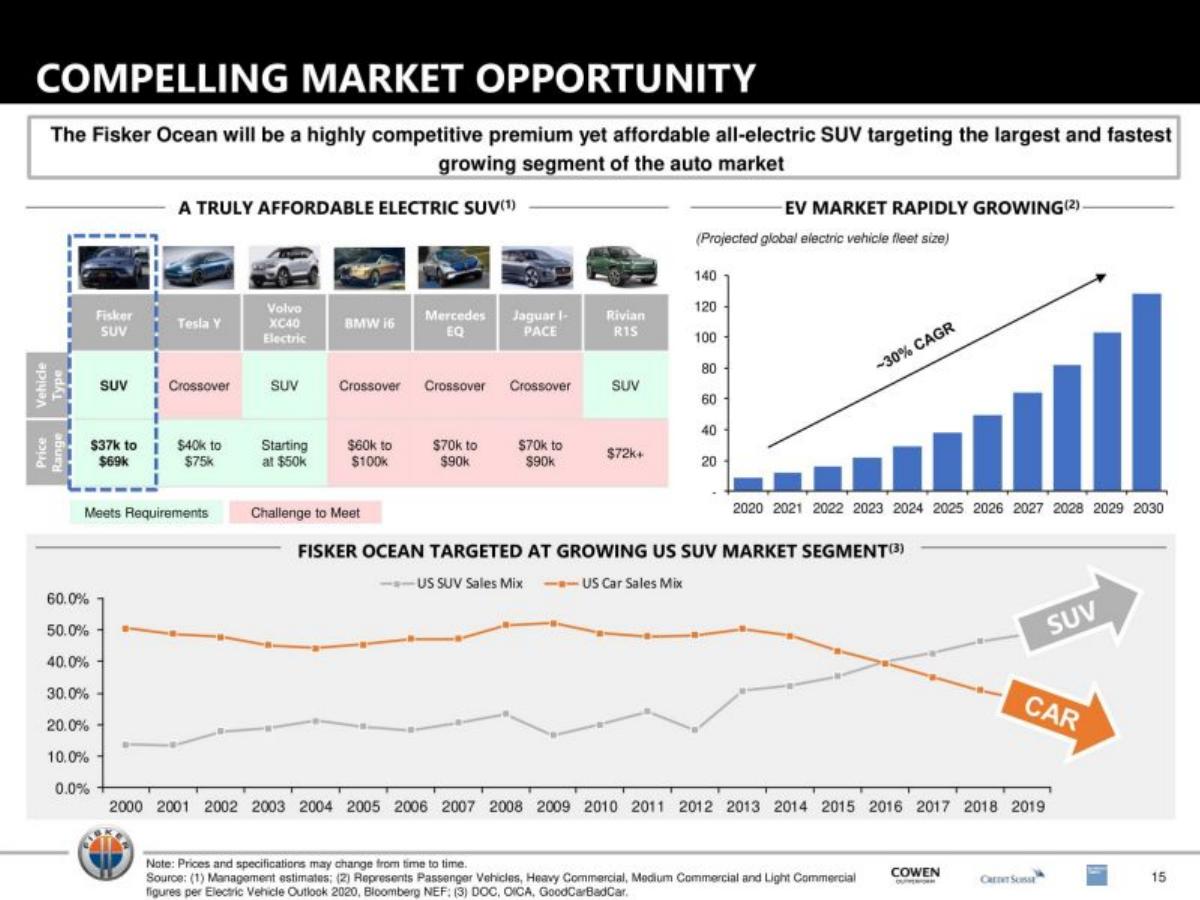
Our analysis: Segment and price position, with sources.
Evidence and limitation: It places the product by price inside a segment and shows that segment's share rising, with named sources. It gives no unit or dollar market size for the segment on this page.
What a founder can adapt: "[Segment] = [share]% of [N] units/yr; our price $[X] vs [rivals]."
Supporting analysis
What the deck claims: "Compelling Market Opportunity." "The Fisker Ocean will be a highly competitive premium yet affordable all-electric SUV targeting the largest and fastest growing segment of the auto market." A price table comparing the Fisker SUV ($37k to $69k) with Tesla Y, Volvo XC40 Electric, BMW i4, Mercedes EQ, Jaguar I-Pace and Rivian R1S. "EV Market Rapidly Growing" chart (~30% CAGR, projected global EV fleet, 2020–2030). "Fisker Ocean Targeted at Growing US SUV Market Segment" chart of US SUV vs car sales mix, 2000–2019. Sources include Bloomberg NEF.
Presentation choice: For a vehicle, the price band and segment trend define the market.
When it does not fit: Trend charts with no segment size.
Goodrive deck, slide 7. Exact stored slide matched to this analysis.
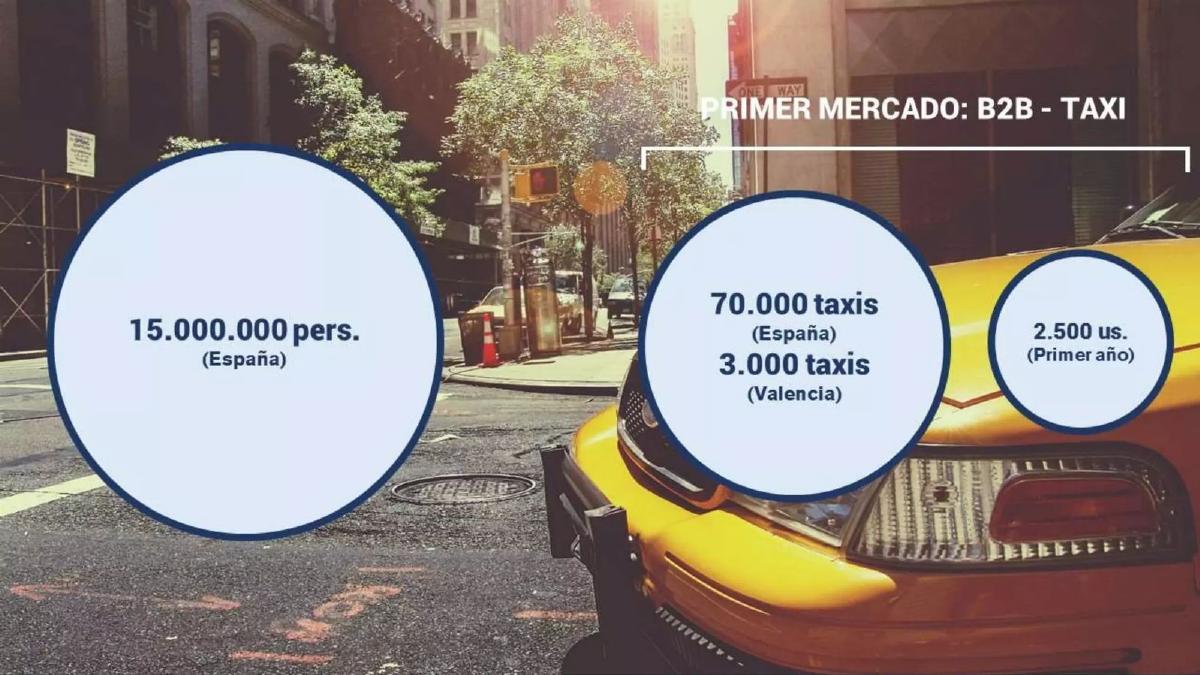
Our analysis: A countable first segment and a first-year target.
Evidence and limitation: It picks a narrow first buyer (taxis), counts them nationally and in one city, and sets a first-year unit target. It gives no price, so there is no dollar market.
What a founder can adapt: "[N] [fleet] nationally, [M] in [city]. Year 1: [K] units × $[price]."
Supporting analysis
What the deck claims: "Primer mercado: B2B – Taxi" (first market: B2B taxis). "15.000.000 pers. (España)". "70.000 taxis (España)", "3.000 taxis (Valencia)". "2.500 us. (Primer año)" (2,500 users in the first year).
Presentation choice: A city-level fleet count makes the first year believable.
WiKey deck, slide 12. Exact stored slide matched to this analysis.
Our analysis: Adjacent category units, no link to the product.
Evidence and limitation: Weaker example. It counts units in an adjacent category with a source, but doesn't say what share of USB-drive buyers WiKey expects, at what price, or why they would switch.
What a founder can adapt: "[N] [category] units/yr at $[avg]. Our buyers: [segment], [M] units at $[price]."
Supporting analysis
What the deck claims: "Market Size. USB Drives?" "59 000 000+ USB Drives sold in 2012 Q1." "+6%". "63 000 000+ ($1.2 billion USD) USB Drives sold in 2012 Q2." "Research by Santa Clara Consulting Groups."
Presentation choice: Investors need to know how much of that category the device could take.
When it does not fit: A comparable category with no share or price.
What improved: Our illustrative rewrite of WiKey's slide; bracketed text is a placeholder, not company fact.
What's different about hardware market sizing
Physical products leave countable traces: units shipped, installed bases, procedures, fleets. That makes bottom-up sizing easier than for software, and investors expect it. They also know hardware is slow to reach buyers, so a realistic first segment (one country, one fleet type, one procedure) matters more than a global total.
What investors check
Whether units times price gives the stated market. Whether the segment matches the device (a trocar, not all laparoscopy). Whether replacement cycles or consumables are counted. Whether the first market is reachable with the team's channels. Whether sources are named.
How we read each slide
We quote the text on the slide images. We have not checked any market figure or source. Page numbers are pages in the original deck file. Two images were already stored and were checked against the decks; four were rendered from the deck PDFs.
Common mistakes
No price. Counts need a price to become a market.
Whole industry. Size the device category you sell into.
Mixed units. Keep dollars, units and people separate.
No first market. Name where the first units ship.
Diagnostic checklist
Unit counted.
Price applied.
Device segment named.
Source cited.
Frequently asked questions
How should a hardware startup size its market?
Count units or buyers and multiply by your price. VRMotion shows $2K per driver × 2M drivers = $4B a year.
Should a device company use the whole industry as its market?
Narrow it to the device category. Axcess Instruments narrows an $8.3B global laparoscopic market to a $700M U.S. trocar market.
How we chose these examples
Corpus: published pitch deck teardowns on StartupFundraising.com. Founder-uploaded private decks are excluded.
Selection (2026-09-26): we searched hardware, device, vehicle and robotics teardowns for market size and market opportunity headings, scanned twelve candidate decks around the matching pages, and kept six.
Excluded: Butlr (featured in the AI market guide), Respira (market page text unreadable at published resolution), Brewstrap and Hindxr (not hardware), GoPlug and Benvira (matching pages were not market sizing), Airdog (deck file unavailable). Teardown text numbering differed from deck-file pages for One Mobility (teardown p5, file p6); the page was matched by eye.
Page numbers are pages in the original deck files. One Mobility and Axcess Instruments images were already stored and were checked against the decks; VRMotion, Fisker, Goodrive and WiKey were rendered from the deck PDFs. All six decks were confirmed as published teardowns on 2026-09-26.
Market figures and sources are quoted from the slides and not independently verified.
Review: slide images were checked on 2026-09-26 and matched to company, deck and page (editorial model review). No person has yet completed an editorial review of this page. We make no claim that any slide caused a fundraising outcome.