How AI startups size their market: the customer's spend on the problem, not the size of "the AI market".
AI Startup Market Slide: Size the Customer's Spend, Not the AI Hype
AI startups are tempted to open their market slide with a global "AI market" forecast. Investors discount that number, because no startup sells into all of AI. The stronger AI market slides size what a specific customer already spends on the job the product does, and then narrow it to the segment the company can actually reach. This guide compares eight real AI startup market slides, from nested spend circles to a slide that sizes the AI market itself.
TL;DR
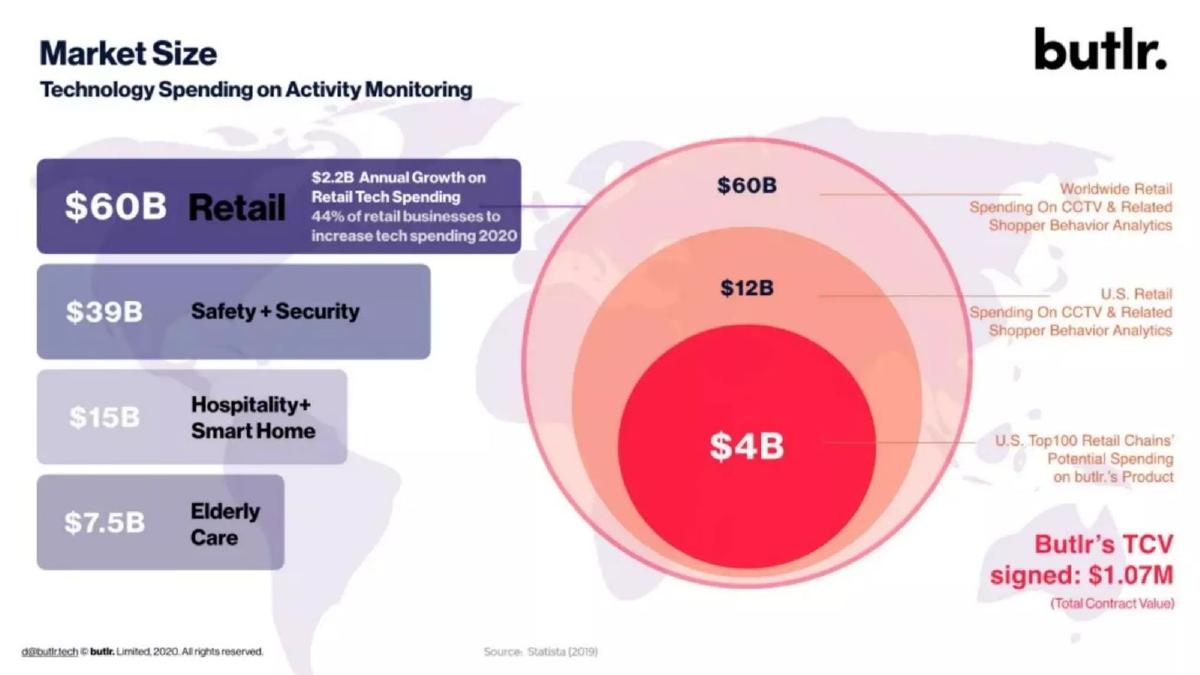
Size what your customer already spends on the problem, then narrow it. Butlr sizes worldwide retail spending on CCTV and shopper analytics ($60B), then U.S. retail ($12B), then the top-100 U.S. chains' potential spend on its product ($4B). SuperScale builds its TAM from a success fee on a $28B pool. Retora instead cites a $100 billion "Artificial Intelligence" market, which doesn't tell investors what its customers pay for.
AI startup market slides from real pitch decks
Each example shows the slide above its analysis and links to the full teardown. Slides that size a specific customer budget come first. Claims are as shown on the slides; comments are ours.
Butlr market slide — slide 4
Thermal sensors and AI analytics for tracking how people move through physical spaces, 2020 deck.
Butlr deck, slide 4. Exact stored slide matched to this analysis.
Our analysis: Existing spend, narrowed to first buyers, with signed value.
Evidence and limitation: It sizes an existing budget (CCTV and shopper analytics), narrows it to the chains it targets, names its source and puts signed contract value on the same slide. It doesn't show how the $4B figure was calculated.
What a founder can adapt: "[Customer] spends $[X] on [current tool]. [Segment]: $[Y]. Signed: $[Z]."
Supporting analysis
What the deck claims: "Market Size. Technology Spending on Activity Monitoring." "$60B Retail", "$39B Safety + Security", "$15B Hospitality+ Smart Home", "$7.5B Elderly Care". Nested circles: "$60B Worldwide Retail Spending On CCTV & Related Shopper Behavior Analytics", "$12B U.S. Retail", "$4B U.S. Top100 Retail Chains' Potential Spending on butlr.'s Product". "Butlr's TCV signed: $1.07M (Total Contract Value)". "Source: Statista (2019)".
Presentation choice: Investors see the budget, the first segment and proof of sales together.
When it does not fit: A narrowed figure with no calculation shown.
AI-driven game growth and optimisation for game publishers.
SuperScale deck, slide 6. Exact stored slide matched to this analysis.
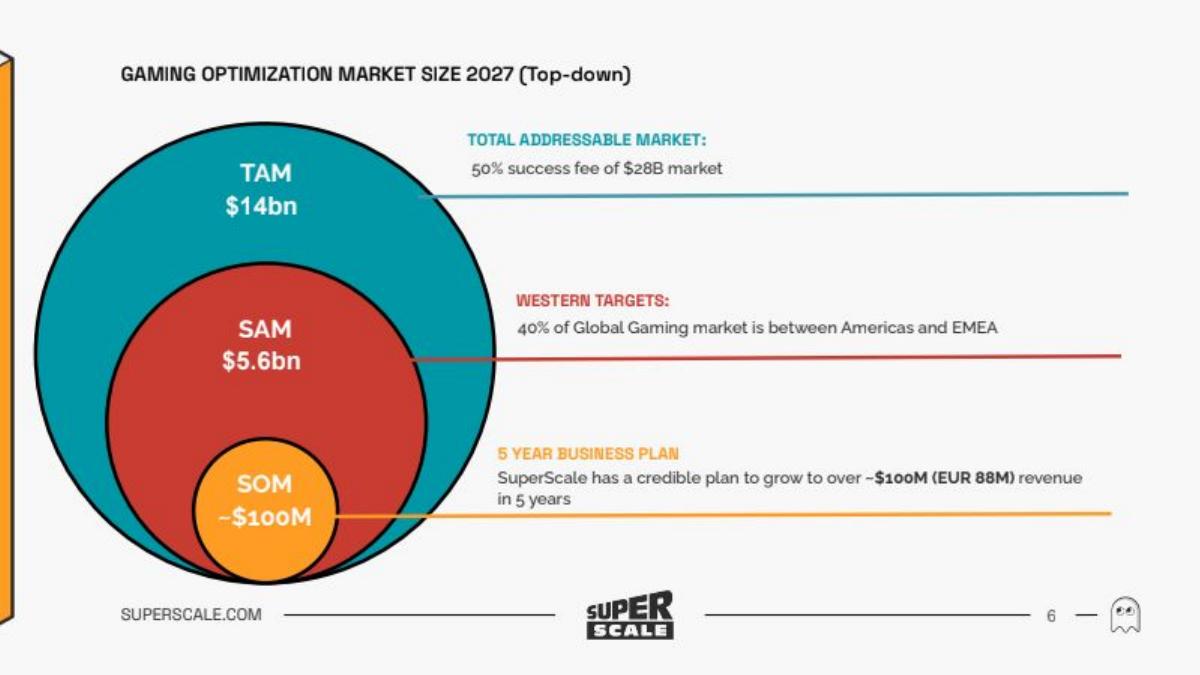
Our analysis: TAM built from the pricing model.
Evidence and limitation: The TAM follows from its pricing (a 50% success fee) and the SAM from a stated regional share. The SOM is the company's own five-year plan, not a market measure, and the slide labels the method top-down.
What a founder can adapt: "TAM: [fee]% of $[pool]. SAM: [region/segment] = [share]%. SOM: [plan]."
Supporting analysis
What the deck claims: "Gaming Optimization Market Size 2027 (Top-down)." "TAM $14bn – Total Addressable Market: 50% success fee of $28B market." "SAM $5.6bn – Western Targets: 40% of Global Gaming market is between Americas and EMEA." "SOM ~$100M – 5 Year Business Plan: SuperScale has a credible plan to grow to over ~$100M (EUR 88M) revenue in 5 years."
Presentation choice: Tying the TAM to the fee shows how the market turns into revenue.
When it does not fit: Calling a revenue plan a market share without saying so.
AI-powered search engine for international law and arbitration.
Jus Mundi deck, slide 7. Exact stored slide matched to this analysis.
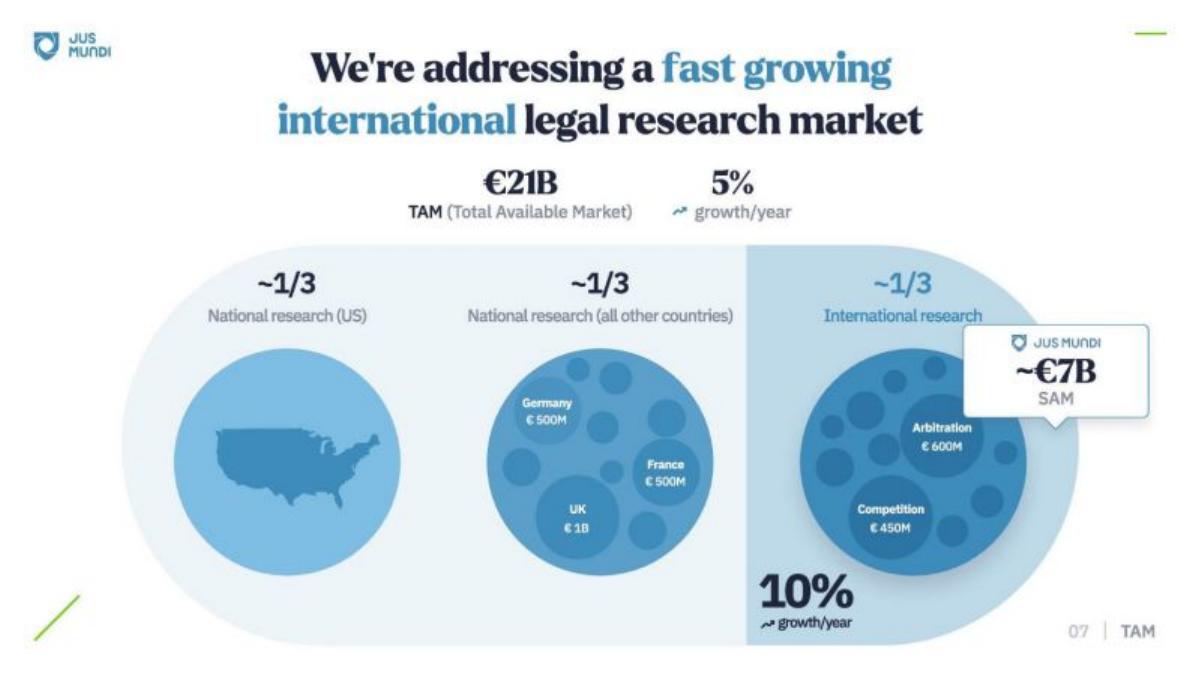
Our analysis: Customer budget split, own segment growing faster.
Evidence and limitation: It sizes the legal research budget, splits it into thirds and shows its segment growing twice as fast as the whole. It doesn't give a source on the slide.
What a founder can adapt: "[Buyer] research spend: $[X], [g]%/yr. Our segment: $[Y], [g2]%/yr."
Supporting analysis
What the deck claims: "We're addressing a fast growing international legal research market." "€21B TAM (Total Available Market)", "5% growth/year". "~1/3 National research (US)", "~1/3 National research (all other countries)" with Germany €500M, France €500M, UK €1B, "~1/3 International research" with Arbitration €600M and Competition €450M. "Jus Mundi ~€7B SAM". "10% growth/year".
Presentation choice: A faster-growing slice is a clearer argument than a large total.
AI-driven portfolio management for financial advisors.
Vise deck, slide 6. Exact stored slide matched to this analysis.
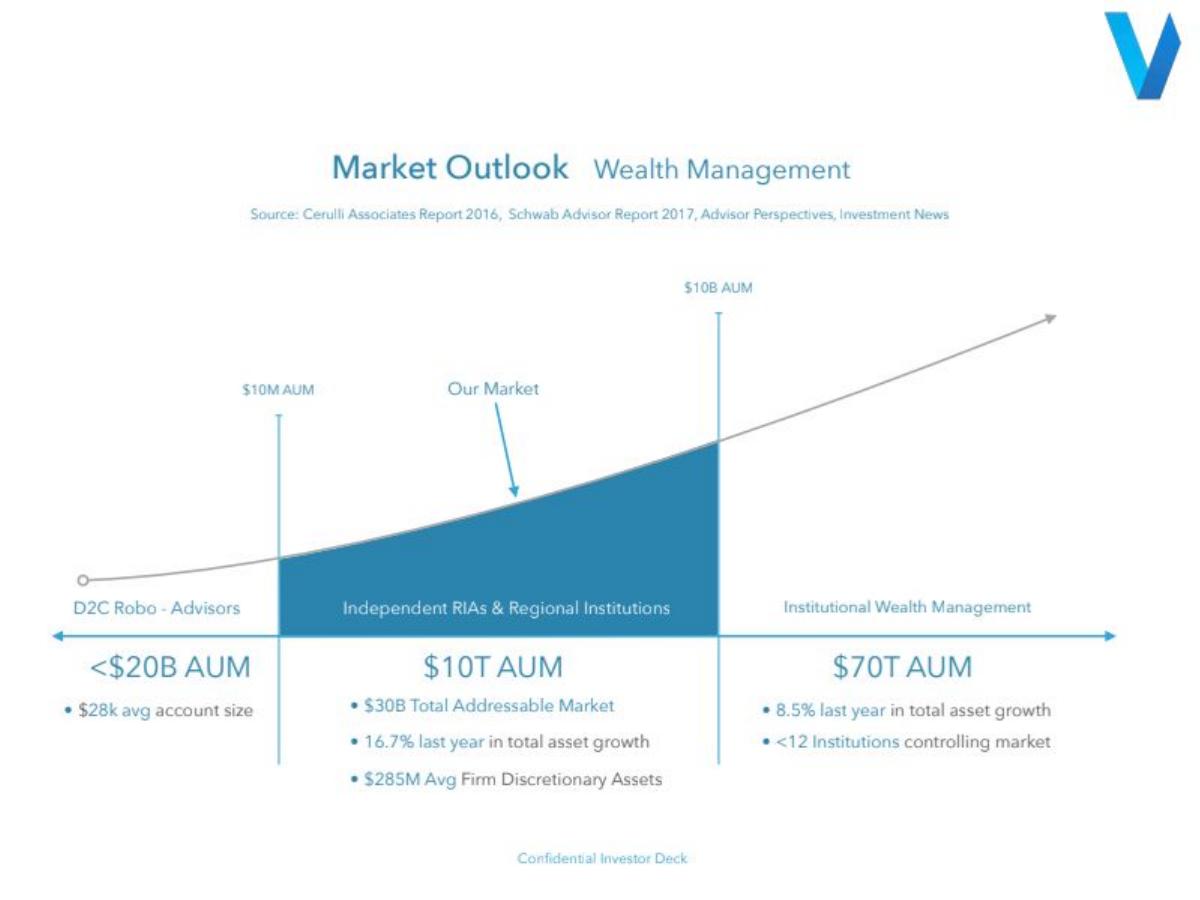
Our analysis: One segment chosen from a wider spectrum.
Evidence and limitation: It picks one segment between robo-advisors and large institutions, explains why, and names its sources. It doesn't show how $10T of assets becomes a $30B TAM.
What a founder can adapt: "Too small: [segment]. Too concentrated: [segment]. Ours: [segment], $[X] TAM."
Supporting analysis
What the deck claims: "Market Outlook – Wealth Management." "Source: Cerulli Associates Report 2016, Schwab Advisor Report 2017, Advisor Perspectives, Investment News." "D2C Robo-Advisors <$20B AUM, $28k avg account size." "Our Market: Independent RIAs & Regional Institutions, $10T AUM, $30B Total Addressable Market, 16.7% last year in total asset growth, $285M Avg Firm Discretionary Assets." "Institutional Wealth Management $70T AUM, 8.5% last year in total asset growth, <12 Institutions controlling market."
Presentation choice: Showing what you are not targeting makes the chosen segment credible.
When it does not fit: A TAM with no link to the asset figure.
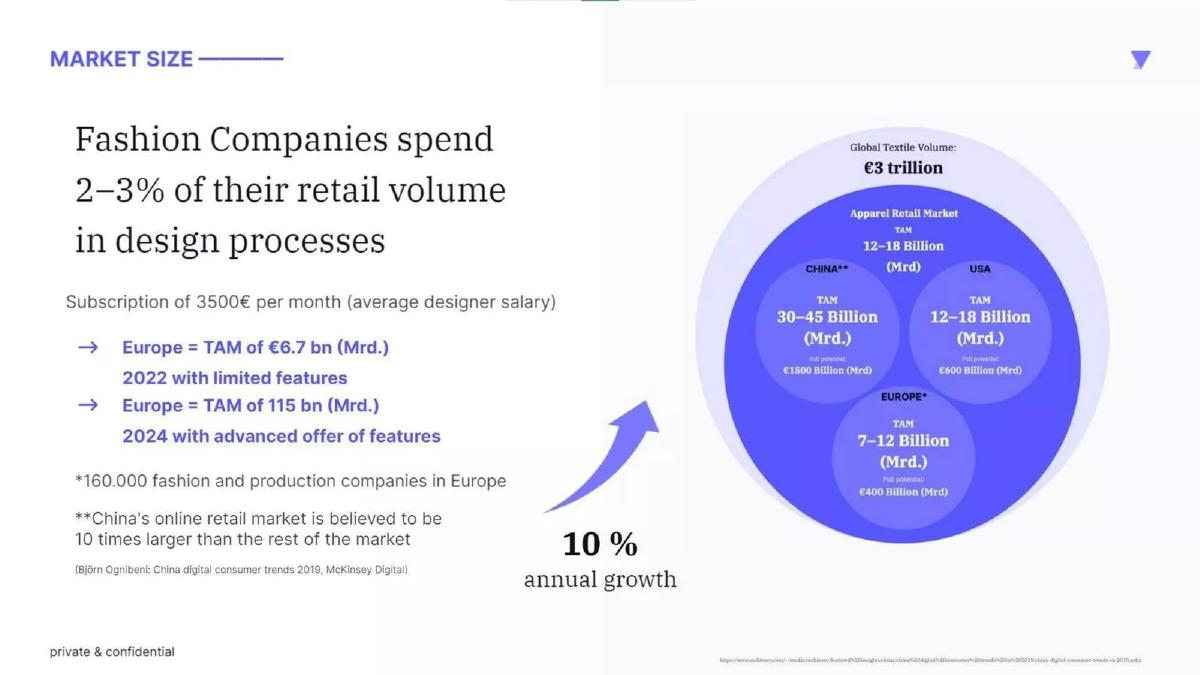
AI design software for fashion companies, Germany.
Yoona.ai deck, slide 8. Exact stored slide matched to this analysis.
Our analysis: Right anchor, inconsistent numbers.
Evidence and limitation: It anchors the market to design spend and prices the subscription against a designer's salary. The Europe TAM appears as €6.7bn, €115bn and 7–12 billion on the same slide, and the currency and unit are not consistent.
What a founder can adapt: "[N] companies × $[price]/month = $[TAM]. Priced below [labour cost]."
Supporting analysis
What the deck claims: "Market Size. Fashion Companies spend 2–3% of their retail volume in design processes." "Subscription of 3500€ per month (average designer salary)." "Europe = TAM of €6.7 bn (Mrd.) 2022 with limited features." "Europe = TAM of 115 bn (Mrd.) 2024 with advanced offer of features." "*160.000 fashion and production companies in Europe." Circles: Global Textile Volume €3 trillion; Apparel Retail Market TAM 12–18 Billion; China 30–45, USA 12–18, Europe 7–12 Billion. "10% annual growth".
Presentation choice: Pricing against labour is a strong AI argument, but conflicting totals weaken it.
When it does not fit: Three different TAMs for the same region.
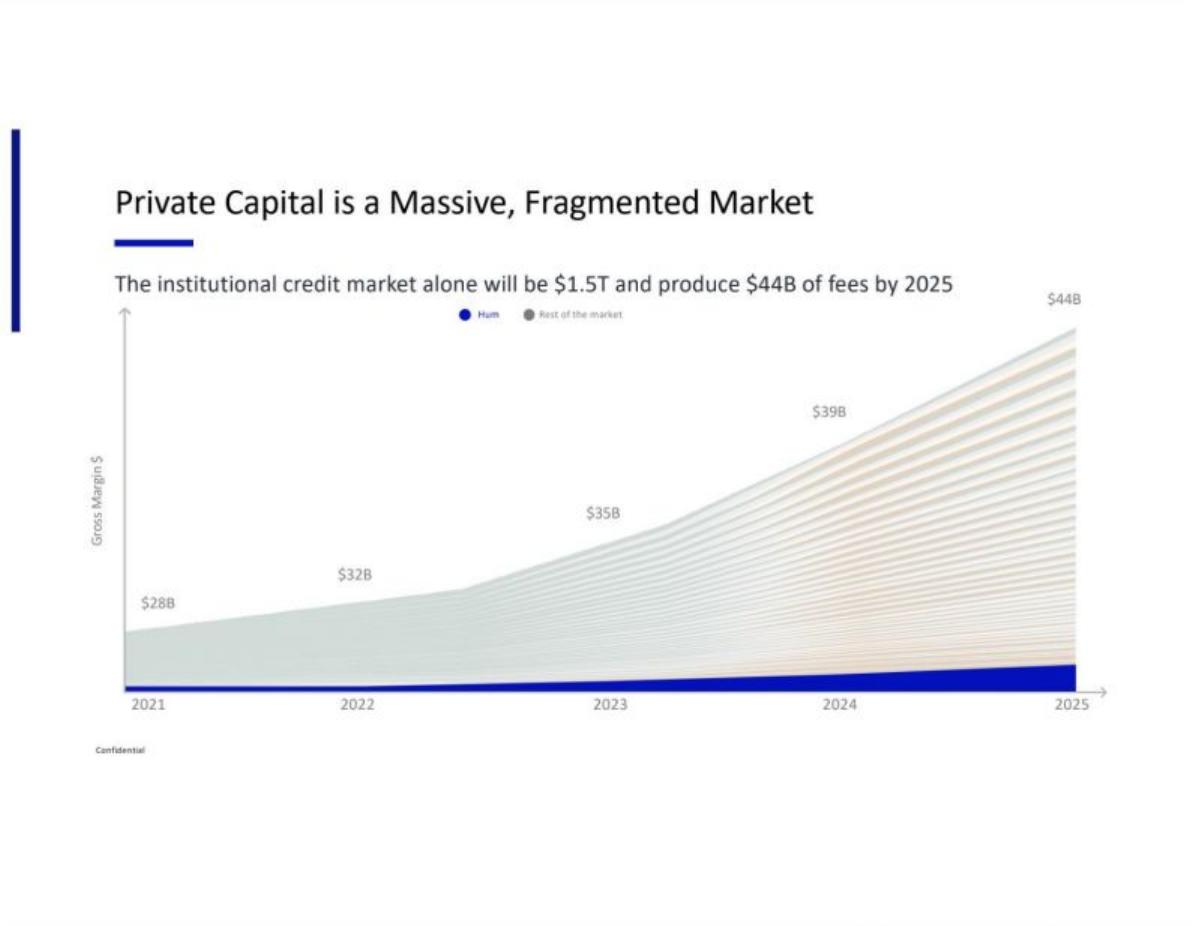
AI-driven capital matching platform connecting companies with institutional investors.
Hum Capital deck, slide 3. Exact stored slide matched to this analysis.
Our analysis: Fee pool, not asset size.
Evidence and limitation: It sizes the fee pool the platform earns from, not total capital, and shows its own band. It doesn't cite a source on the slide.
What a founder can adapt: "$[X] flows through [market]; $[Y] in fees by [year]; our take: [Z]%."
Supporting analysis
What the deck claims: "Private Capital is a Massive, Fragmented Market." "The institutional credit market alone will be $1.5T and produce $44B of fees by 2025." A chart of gross margin dollars rising from $28B (2021) to $44B (2025), with Hum's share shown as a thin band against "Rest of the market".
Presentation choice: Investors care about the fees available to a marketplace, not the capital flowing through it.
When it does not fit: A forecast with no named source.
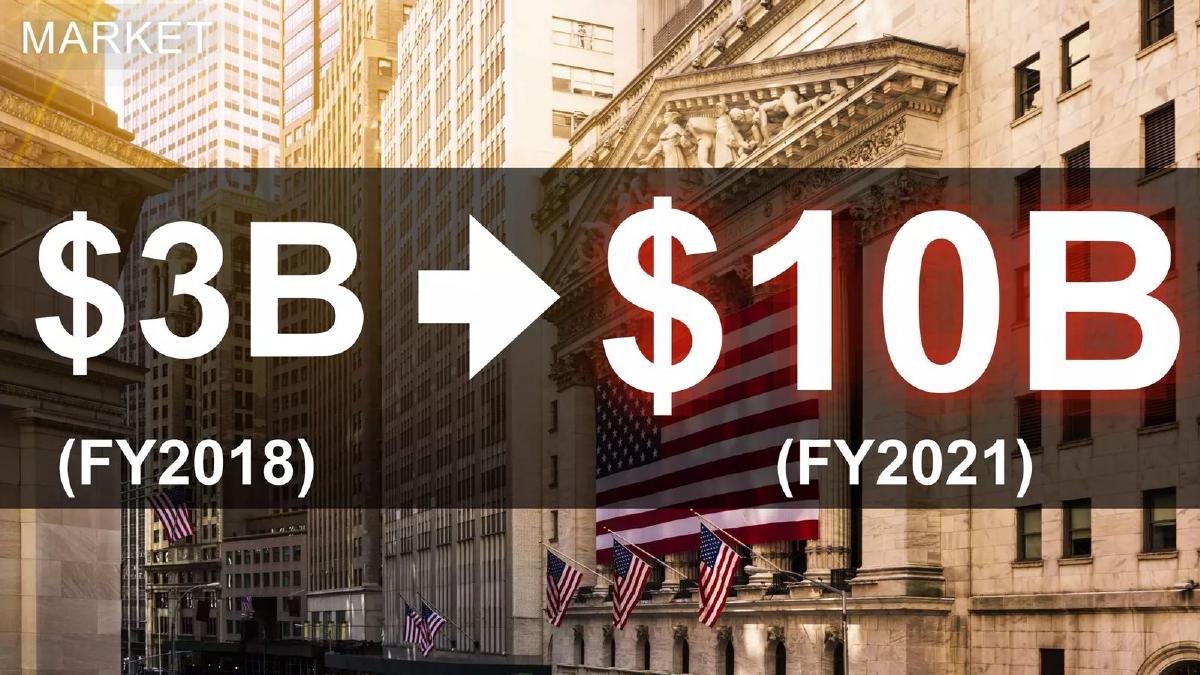
GPU Eater deck, slide 10. Exact stored slide matched to this analysis.
Our analysis: Growth with no definition.
Evidence and limitation: Weaker example. It shows fast growth but doesn't say which market the figures describe, where they come from or which customers GPU Eater targets.
What a founder can adapt: "[Market: e.g. cloud GPU rental for ML] $[X] → $[Y] ([source]). Our segment: [customer], $[Z]."
Supporting analysis
What the deck claims: "Market." "$3B → $10B (FY2018) (FY2021)".
Presentation choice: Investors can't judge a number they can't define.
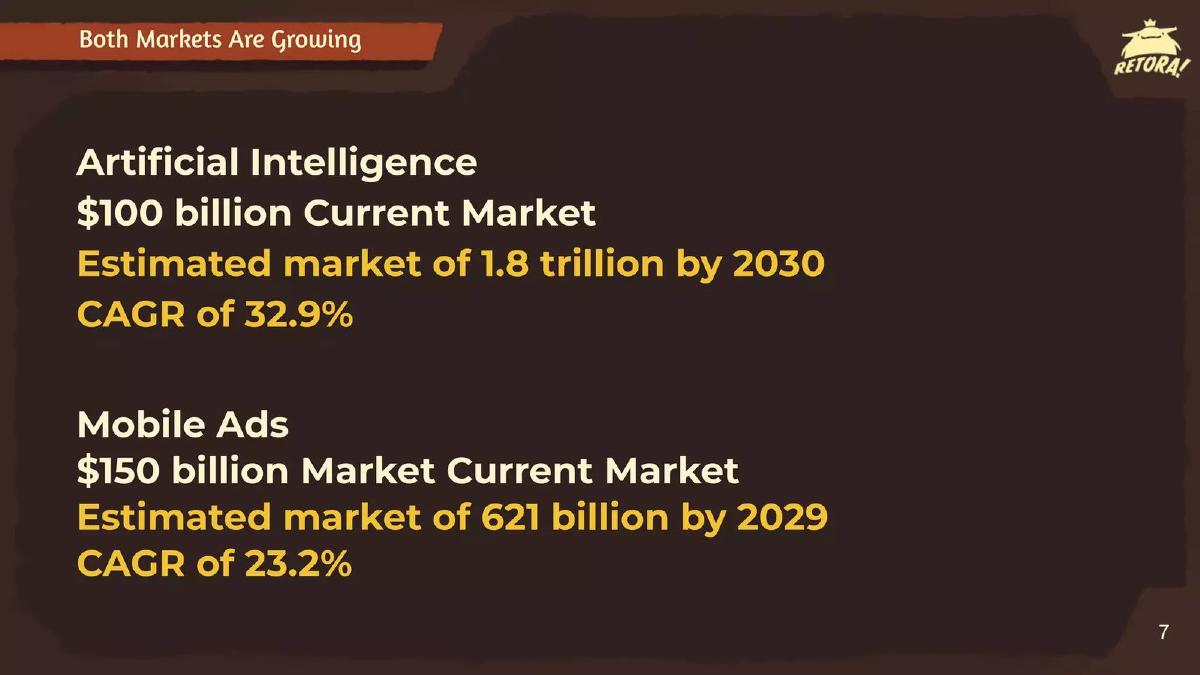
AI-generated mobile games with player feedback rewards.
Retora deck, slide 7. Exact stored slide matched to this analysis.
Our analysis: Industry totals, not a customer budget.
Evidence and limitation: Weaker example. It sizes the whole AI industry and all mobile advertising, with no source and no link to what Retora sells or who pays it.
What a founder can adapt: "[Advertisers] spend $[X] on [ad format]; our share model: [Y]%."
Supporting analysis
What the deck claims: "Both Markets Are Growing." "Artificial Intelligence $100 billion Current Market. Estimated market of 1.8 trillion by 2030. CAGR of 32.9%." "Mobile Ads $150 billion Market Current Market. Estimated market of 621 billion by 2029. CAGR of 23.2%."
Presentation choice: This is the pattern investors discount most on AI decks.
When it does not fit: Using the AI market as your market.
Which kind of AI market slide answers which question.
Approach
Example
Answers
Leaves open
Existing spend, narrowed
Butlr
Budget, first segment, signed value
How $4B was calculated
TAM from pricing
SuperScale
How market becomes revenue
Bottom-up check
Budget split by segment
Jus Mundi
Where growth is fastest
Source
Segment chosen on a spectrum
Vise
Why this segment
AUM-to-TAM link
Priced against labour
Yoona.ai
Why buyers would pay
Consistent totals
Fee pool
Hum Capital
Money available to a platform
Source
Growth headline
GPU Eater
Growth rate
What market it is
AI industry totals
Retora
Nothing about customers
Who pays
Key Takeaways
Size the customer's budget, not the AI industry.
Narrow from total to the segment you can reach.
Tie the TAM to your pricing model.
Cite the source and year of each number.
Show how much of the market you have signed.
Write your AI market slide
Answer these before you design the slide.
Budget. What does your customer spend today on the job your AI does?
Price. How does your pricing (seat, subscription, fee) turn that spend into revenue?
Segment. Which part can you reach in the next three years?
Source. Where does each number come from, and what year?
Copyable framework: [Customer] spends $[X] on [job] ([source, year]). At [pricing], TAM = $[Y]. First segment: [who], $[Z]. Signed so far: $[W].
Illustrative example 1 — written by us
Before: "Artificial Intelligence $100 billion Current Market. Estimated market of 1.8 trillion by 2030."
After: "[Mobile game studios] spend $[X] on [player testing] ([source]). At $[price] per test, TAM = $[Y]."
What improved: Our illustrative rewrite of Retora's slide; bracketed text is a placeholder, not company fact.
Why "the AI market" is the wrong number
Global AI forecasts combine chips, cloud, services and software across every industry. An AI startup sells one product to one kind of buyer, so its market is that buyer's existing spend on the job: security cameras and analytics, legal research, wealth management software, game optimisation, design labour. AI is how the product works, not who pays for it.
What investors check
Which budget the product replaces or grows. Whether the TAM follows from the price (seats, subscriptions, a success fee or a share of assets). Whether the serviceable slice is realistic for the first years. Whether sources are named and dated. Whether any signed revenue sits next to the market number.
How we read each slide
We quote the text on the slide images. We have not checked any market figure or source. Page numbers are pages in the original deck file. Four images were already stored and were checked against the deck; four were rendered from the deck PDFs.
Common mistakes
Using the AI market. Size your customer's budget instead.
Unlabelled numbers. Say which market and which source.
TAM unrelated to price. Show how the spend becomes revenue.
Conflicting totals. Use one number per region and one currency.
Diagnostic checklist
Customer budget named.
TAM tied to pricing.
Segment narrowed.
Sources dated.
Frequently asked questions
Should an AI startup use the AI market size on its market slide?
Usually not. Size what your customer already spends on the job. Butlr sizes retail spending on CCTV and shopper analytics rather than the AI market.
How do you calculate TAM for an AI product?
Start from the pricing model. SuperScale takes a 50% success fee on a $28B pool for a $14bn TAM; Yoona.ai prices its subscription against a designer's salary.
How we chose these examples
Corpus: published pitch deck teardowns on StartupFundraising.com. Founder-uploaded private decks are excluded.
Selection (2026-09-26): we searched AI and machine-learning teardowns for market size, market opportunity and TAM headings, scanned ten candidate decks around the matching pages, and kept eight.
Excluded: SpatzAI (counts accelerators and teams, no spend), CommerceIQ (market context rather than sizing, already in the flywheel guide), Hum Capital p5 (platform metrics, not market size), SuperScale p4 (whole gaming market; p6 used instead).
Page numbers are pages in the original deck files. Butlr, SuperScale, Vise and Hum Capital images were already stored and were checked against the decks; Jus Mundi, Yoona.ai, Retora and GPU Eater were rendered from the deck PDFs. All eight decks were confirmed as published teardowns on 2026-09-26.
Market figures and sources are quoted from the slides and not independently verified.
Review: slide images were checked on 2026-09-26 and matched to company, deck and page (editorial model review). No person has yet completed an editorial review of this page. We make no claim that any slide caused a fundraising outcome.