SaaS Market Size Slides: 7 Real Pitch Deck Examples
How software startups size their market: seats × price, value per server, share of customer spend, sourced category totals, and the weak versions to avoid.
SaaS Market Size Slides: Real Pitch Deck Examples
Seven market slides from software decks, shown in full. The strongest turn a count of users or machines into subscription revenue; the weakest describe a trend or list achievements without putting a number on the market.
TL;DR
A SaaS market slide should show how many buyers there are and what each would pay per year. Pareto starts from 2M US sales and marketing professionals earning $60k a year and a McKinsey figure (60% of professionals spend 30% of their time on manual data tasks) to reach "$1.8B/month in potential addressable subscription revenue". Plumbr prices its value per machine ("exceeds $1000/server/year") and compares it with the $2b+ customers already pay for monitoring. OneLobby sizes spend from a sourced share of revenue (1% on meetings and events, Frost & Sullivan). Hour One gives a sourced category total (Statista). TimeFlip counts buyers but gives the total without showing how. Productsup and Knak are weaker examples: one mixes the market with other claims, the other gives no market number at all.
SaaS market size slides
Each example shows the exact stored slide above its analysis and links to the full teardown. Stronger examples first. Figures are as shown on the slides; we have not verified them.
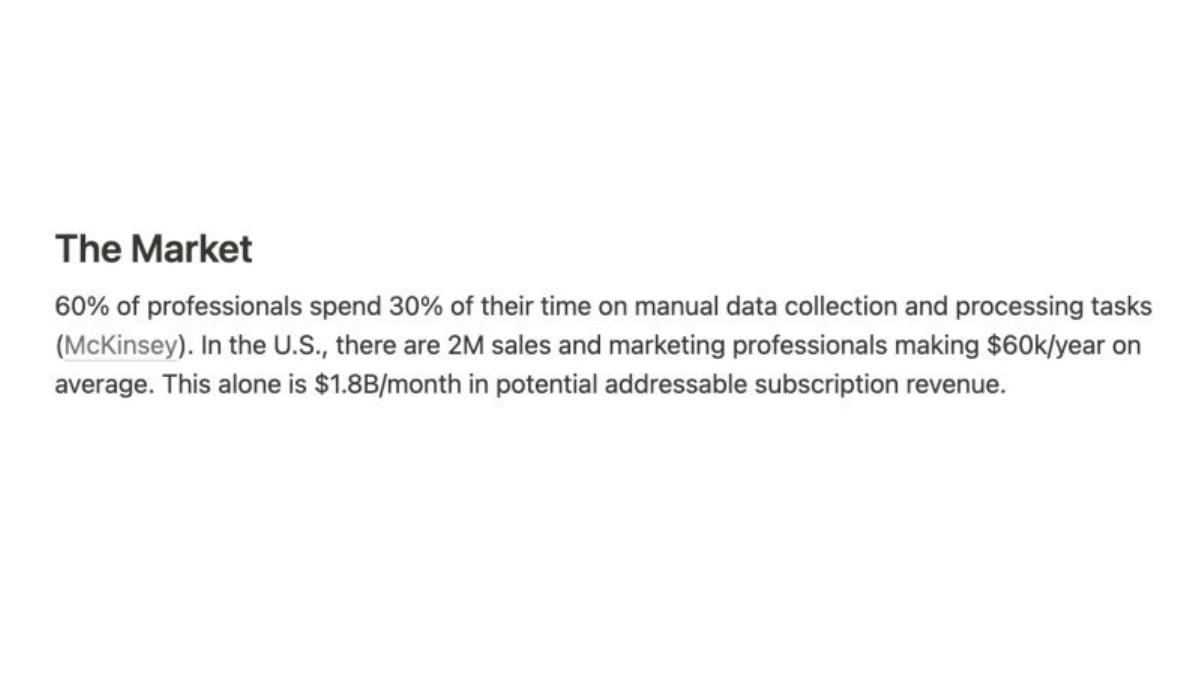
Pareto market slide — slide 5
Data collection for sales and marketing teams. One short paragraph.
Pareto deck, slide 5. Exact stored slide matched to this analysis.
Our analysis: The inputs multiply out: 2M × $60k × 30% of time × 60% of people ≈ $21.6B a year, or $1.8B a month. That's the value of the time lost, which the slide calls subscription revenue.
Evidence and limitation: A named source, a user count and a salary figure.
What a founder can adapt: Show the sum on the slide, then add the price you'll charge per seat.
Supporting analysis
What the deck claims: "The Market." "60% of professionals spend 30% of their time on manual data collection and processing tasks (McKinsey). In the U.S., there are 2M sales and marketing professionals making $60k/year on average. This alone is $1.8B/month in potential addressable subscription revenue."
Presentation choice: Starting from the people who feel the problem, with a source, makes the number checkable.
When it does not fit: The value of lost time is not what customers will pay; say what share of it becomes your price.
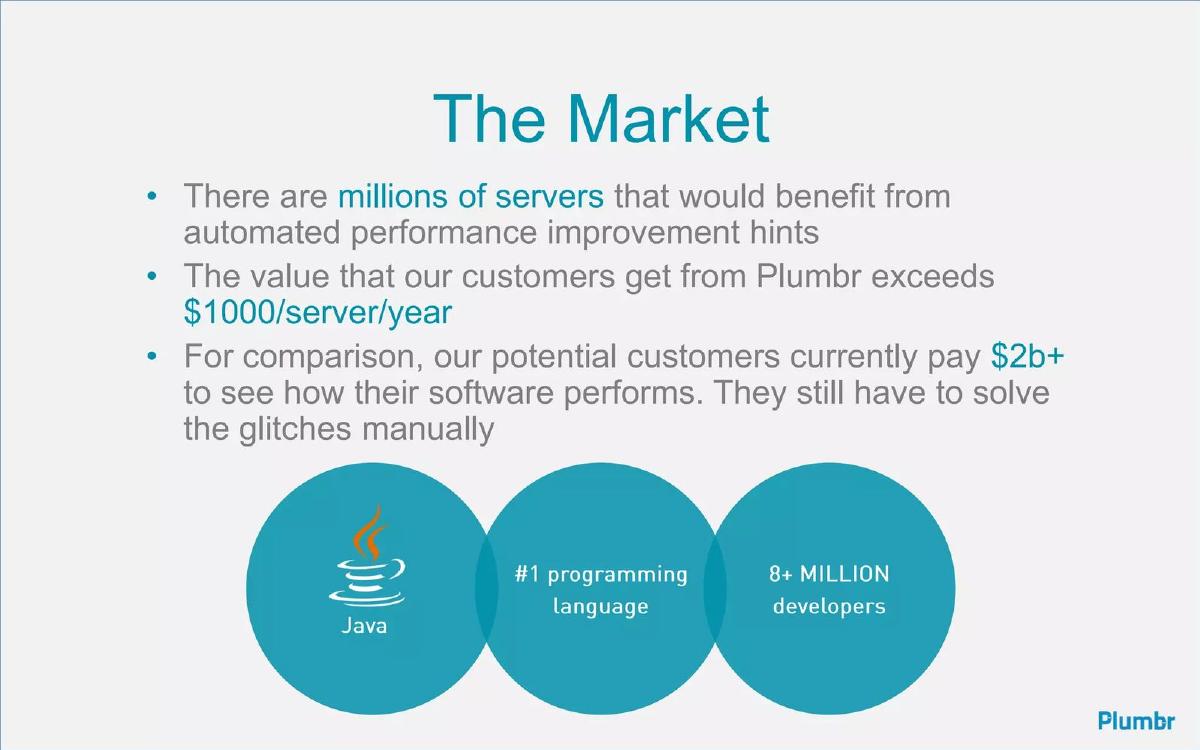
Performance monitoring for Java applications. Three bullets and three circles.
Plumbr deck, slide 3. Exact stored slide matched to this analysis.
Our analysis: Prices the product per machine and shows customers already spend $2b+ on a related tool, so the budget exists.
Evidence and limitation: Value per server and existing spend on monitoring.
What a founder can adapt: Give the number of units (servers, seats) and the value per unit, and name the budget it comes from.
Supporting analysis
What the deck claims: "The Market." "There are millions of servers that would benefit from automated performance improvement hints." "The value that our customers get from Plumbr exceeds $1000/server/year." "For comparison, our potential customers currently pay $2b+ to see how their software performs. They still have to solve the glitches manually." Circles: "Java", "#1 programming language", "8+ MILLION developers".
Presentation choice: A per-unit value plus existing spend is a convincing pair.
When it does not fit: "Millions of servers" needs a figure and a source; value delivered isn't the same as price charged.
Software for company meetings and events. Three bullets.
OneLobby deck, slide 5. Exact stored slide matched to this analysis.
Our analysis: Shows a large, defined buyer group with a clear budget, and hints at the problem (no measure of return).
Evidence and limitation: A sourced spend share, a total for the 2,000 largest companies and a per-company average.
What a founder can adapt: Add what share of that $21M budget a company would spend on your software.
Supporting analysis
What the deck claims: "Market Size." "According to a study by Frost & Sullivan 2013, Companies spend 1% of their revenue on Meetings and Events." "This represents $396 BILLION in spending by the global 2000 alone. Would you spend $400 BN w/o knowing what you get in return?" "Large enterprises spend an avg of $21 million on Meeting & Events annually."
Presentation choice: A per-company figure lets an investor work out the software price from the budget.
When it does not fit: $396B is event spending, not software spending; size the software part.
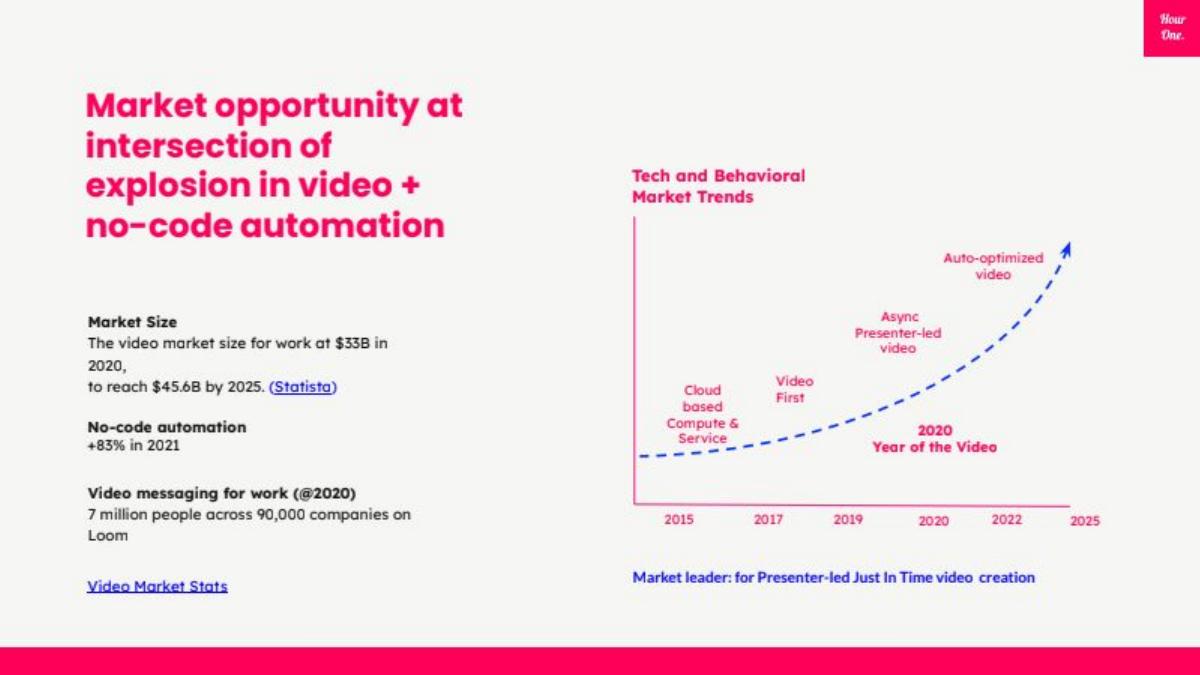
Video creation for business. Market figures plus trend chart.
Hour One deck, slide 4. Exact stored slide matched to this analysis.
Our analysis: Shows two growing trends and uses Loom's user numbers as proof that businesses already use video.
Evidence and limitation: A sourced category total with a forecast, and a usage figure from a known product.
What a founder can adapt: Narrow the $33B to the part your product serves, in accounts × price.
Supporting analysis
What the deck claims: "Market opportunity at intersection of explosion in video + no-code automation." "Market Size: The video market size for work at $33B in 2020, to reach $45.6B by 2025. (Statista)." "No-code automation +83% in 2021." "Video messaging for work (@2020): 7 million people across 90,000 companies on Loom." Chart of trends 2015–2025; "Market leader: for Presenter-led Just In Time video creation".
Presentation choice: A known company's usage makes the demand concrete.
When it does not fit: "Market leader" is a claim, not market size; the +83% has no source.
Time tracking for businesses and individuals. Three figures and a customer list.
TimeFlip deck, slide 4. Exact stored slide matched to this analysis.
Our analysis: Shows businesses already pay for time tracking and lists who they are.
Evidence and limitation: Buyer counts and a total, no sources.
What a founder can adapt: Link the numbers: 0.5M businesses × [$ per year] = [$ market], with sources.
Supporting analysis
What the deck claims: "Market Validation, B2C and B2B." "0.5M businesses: Use time tracking software." ">100 M individuals: Worldwide. Gig Economy." ">$5Bn: Global time tracking market." Ticked list: software developers, consulting companies, banks & insurance, freelancers, law firms, media agencies, design bureaus, logistics companies.
Presentation choice: Buyer counts are the right starting point for software.
When it does not fit: The $5Bn total isn't connected to the buyer counts, and no source is given.
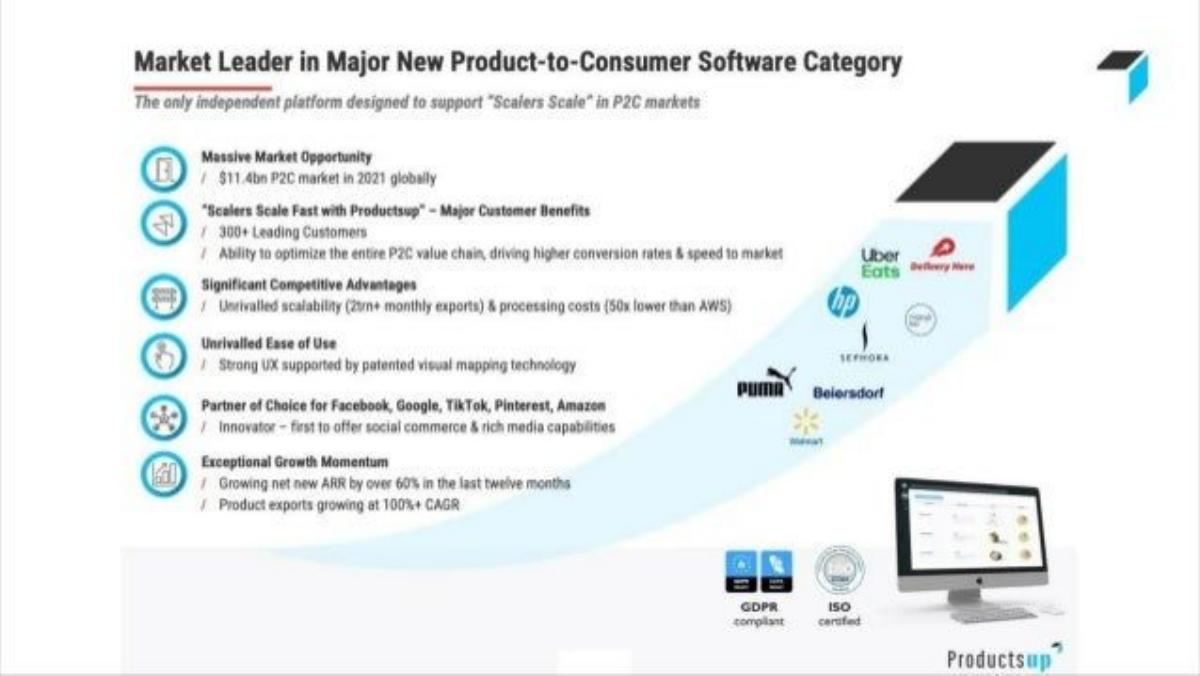
Product data software for online sellers. Six claims plus customer logos.
Productsup deck, slide 3. Exact stored slide matched to this analysis.
Our analysis: A weaker example: the market figure is one line on a slide that is mostly about traction and advantages.
Evidence and limitation: One market figure among five other topics.
What a founder can adapt: Give the market its own slide and show how the $11.4bn is made up.
Supporting analysis
What the deck claims: "Market Leader in Major New Product-to-Consumer Software Category." "Massive Market Opportunity: $11.4bn P2C market in 2021 globally." Then customer benefits ("300+ Leading Customers"), competitive advantages, ease of use, partnerships ("Facebook, Google, TikTok, Pinterest, Amazon") and growth ("Growing net new ARR by over 60% in the last twelve months").
Presentation choice: Included for contrast: mixing topics makes the market number easy to miss.
When it does not fit: Move customers, partners and growth to their own slides.
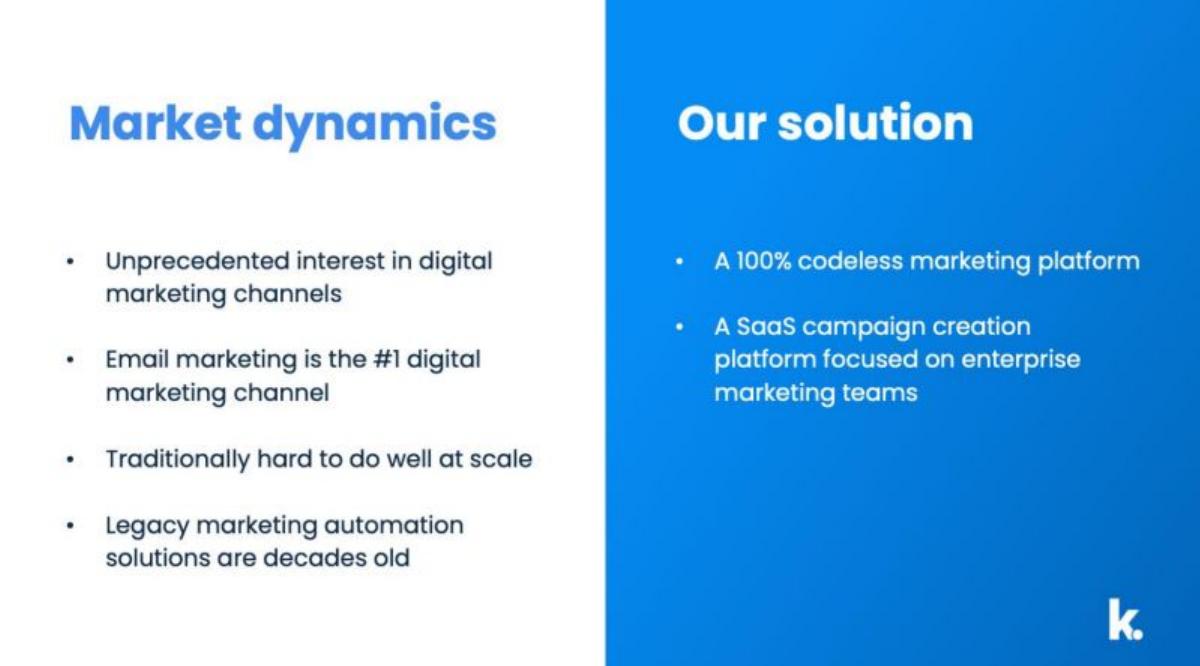
Email campaign creation for enterprise marketing teams. Two columns of bullets.
Knak deck, slide 6. Exact stored slide matched to this analysis.
Our analysis: A weaker example: describes why the timing is good but never says how many buyers there are or what they'd pay.
Evidence and limitation: Trends only; no number.
What a founder can adapt: Add: [N] enterprise marketing teams × [$ per year] = [$ market].
Supporting analysis
What the deck claims: "Market dynamics": "Unprecedented interest in digital marketing channels", "Email marketing is the #1 digital marketing channel", "Traditionally hard to do well at scale", "Legacy marketing automation solutions are decades old". "Our solution": "A 100% codeless marketing platform", "A SaaS campaign creation platform focused on enterprise marketing teams".
Presentation choice: Included for contrast: trends without a figure leave the market size unknown.
When it does not fit: Keep the solution on its own slide.
How the market is sized and whether it connects to subscription revenue.
Example
Software type
Method
Source named
Buyers × price shown
Pareto
Sales data collection
Users × salary × time lost
Yes (McKinsey)
Partly (value, not price)
Plumbr
Performance monitoring
Value per server, existing spend
No
Partly
OneLobby
Meetings and events
Share of revenue spent
Yes (Frost & Sullivan)
Partly (per-company budget)
Hour One
Video creation
Category total
Yes (Statista)
No
TimeFlip
Time tracking
Buyer counts + total
No
No
Productsup
Product data feeds
Category total
No
No
Knak
Email campaigns
Trends only
No
No
Key Takeaways
Count buyers or seats, then multiply by annual price.
Price per unit of value (seat, server, company) is easy to check.
Comparing with what customers already spend grounds the number.
Name the source for every outside figure.
Keep the market slide about the market.
Build your SaaS market slide
Size the market the way you'll earn it: accounts or seats × annual price.
Buyers. How many companies or seats need this, with source.
Price. What each pays per year (your actual or planned price).
Existing budget. What they spend today on the problem or a related tool.
First segment. The group you'll sell to first, and its size.
Copyable framework: [N] [companies/seats] × [$ per year] = [$ market]. Today they spend [$] on [tool]. We start with [segment]: [N] × [$] = [$]. Sources: [..].
Illustrative example 1 — written by us
Before: Email marketing is the #1 digital marketing channel. Legacy marketing automation solutions are decades old.
After: [N] enterprise marketing teams × [$X] a year = [$Y]. They already spend [$Z] on email tools ([source]).
What improved: Our illustrative rewrite; not Knak's wording. It adds a buyer count, a price and existing spend, with marked places for real figures.
What this guide adds
The library has a market-size-by-stage guide, a fintech market guide and a TAM/SAM/SOM guide. This page looks only at software sold by subscription, where investors want to see the number of possible accounts or seats and a realistic annual price, because that is how the revenue will actually be earned.
The seven decks cover data collection for sales teams (Pareto), Java performance monitoring (Plumbr), meetings and events software (OneLobby), video creation (Hour One), time tracking (TimeFlip), product data feeds for online sellers (Productsup) and email campaign creation (Knak). None of these decks appears in another guide.
Three ways software decks size the market
Users × price (Pareto, Plumbr): the number of people or machines that need the product, times what each is worth per year. The clearest method for subscription software.
Share of existing spend (OneLobby, Plumbr's comparison): what customers already pay for the problem. Shows the budget exists.
Category total (Hour One, TimeFlip, Productsup): a published figure for the whole category. Fine as context, but weak on its own unless it narrows to your buyers.
Common mistakes
Trends instead of a number. Every market slide needs a figure.
Value as price. Say what you'll charge, not what customers save.
Spend on the wrong thing. Size software spend, not the whole activity.
Totals with no link. Connect buyer counts to the total.
Mixed topics. Traction and partners belong on other slides.
Diagnostic checklist
Buyers or seats counted, with source.
Annual price per buyer.
The sum shown on the slide.
Existing spend on the problem.
Nothing unrelated on the slide.
Frequently asked questions
How we chose these examples
Corpus: published pitch deck teardowns on StartupFundraising.com. Founder-uploaded private decks are excluded.
Selection (2026-09-25): we searched stored slide text for slides headed Market, Market Size or Market Opportunity that mention software, SaaS, subscription, enterprise, B2B, cloud or small business, excluded decks already used in another guide and decks that are not software, and kept slides with a stored image. Of 17 software candidates checked, 8 were already used elsewhere and 1 had no stored image; of the remaining 8, Help Lightning was left out because its slide describes the product rather than the market. Productsup and Knak are included as weaker examples for contrast.
Company descriptions come from the slides themselves.
Review: stored slide text and images were checked on 2026-09-25 and matched to company, deck and slide number (editorial model review). No person has yet completed an editorial review of this page.
Figures are as shown on the slides; we have not verified them. We make no claim that any slide caused a fundraising outcome.