How market size slides change from pre-seed to Series B: from a bottom-up count of first customers to a sourced TAM.
Market Size Slides by Stage: Real Pre-Seed to Series B Examples
Eight market slides from pre-seed, seed, Series A and Series B decks, shown in full. Early slides count the first customers you can reach; later slides add sourced totals, the segments inside them and how the market grows over time.
TL;DR
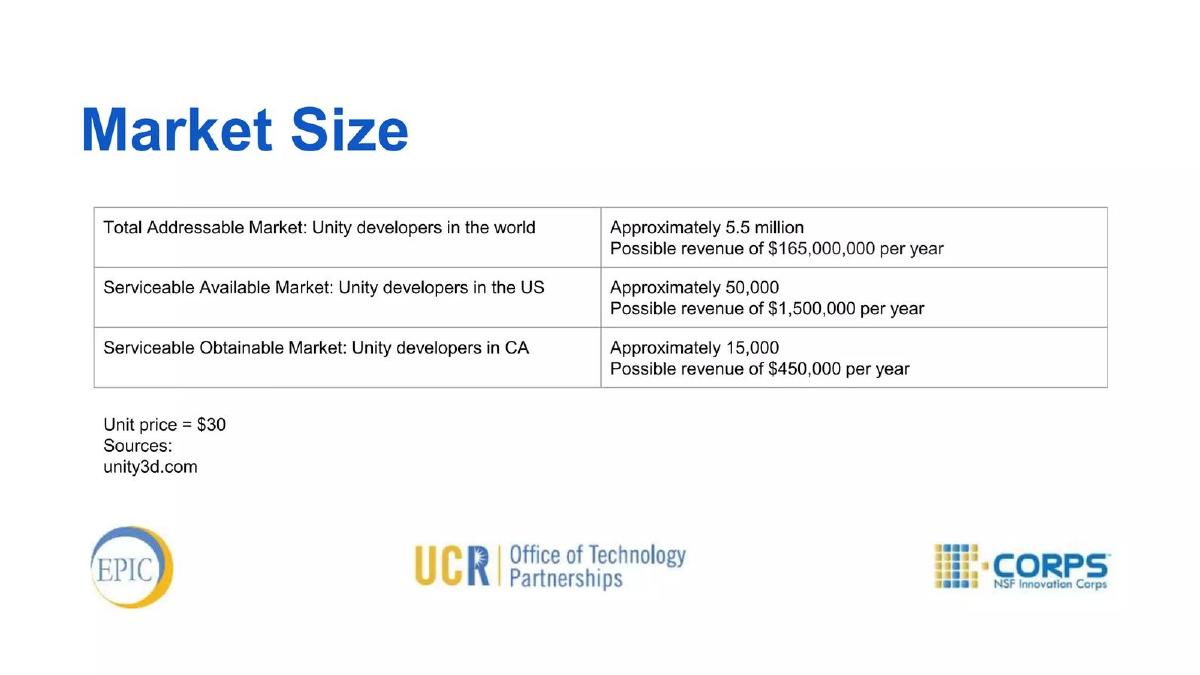
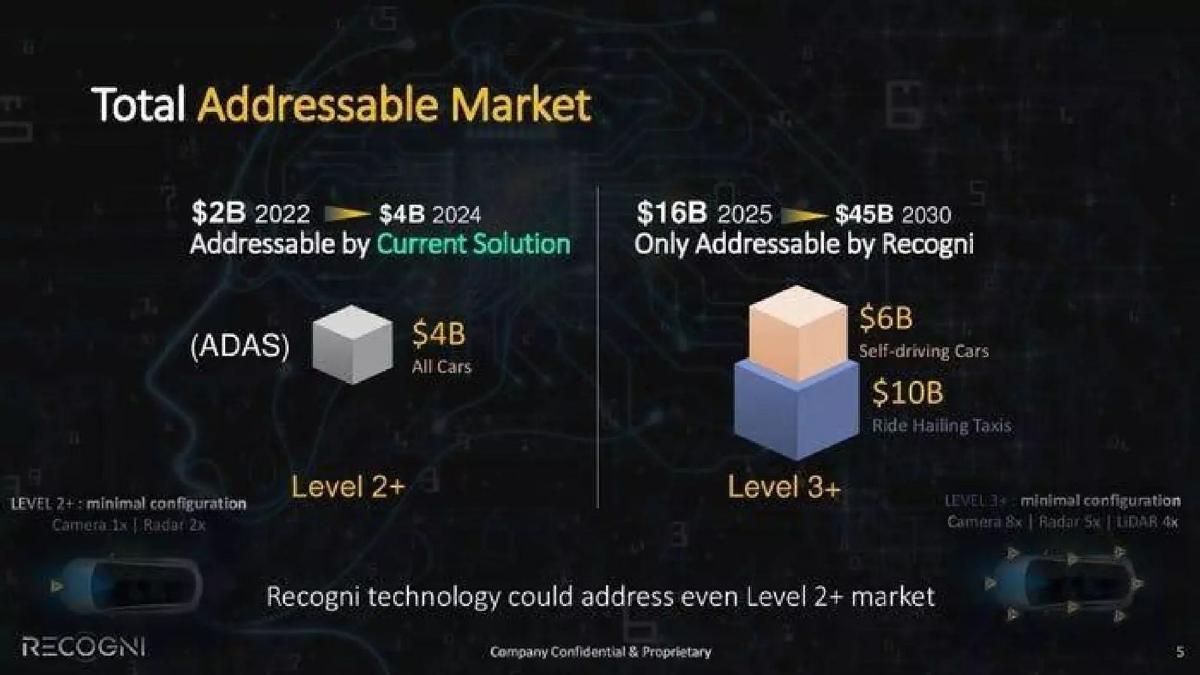
At every stage a market slide should show how the number was built, not just how big it is. What changes is the scope. Pre-seed slides count reachable customers: Gaming Arts Motivator multiplies "Unity developers in CA" (about 15,000) by a "Unit price = $30" to get $450,000 a year. Seed slides size the first local market or one deal: Monarch Farms uses Oregon's "293 active Producer Licensees vs. 625 in Colorado"; RoboForce shows "$200+ Million Labor Cost & Demand per 1GW Project". Series A slides split the total into TAM and SAM or segments: Acquco's "$450BN" TAM and "$250BN" US SAM, with sources. Series B slides show growth and which part only they can reach: Recogni's "$16B 2025 → $45B 2030 Only Addressable by Recogni".
Market size slides from pre-seed, seed, Series A and Series B decks
Each example shows the exact stored slide above its analysis and links to the full teardown. Pre-seed first, then seed, Series A and Series B. Figures are as shown on the slides; we have not verified them.
Gaming Arts Motivator market slide — slide 4
Pre-seed. Tool for Unity game developers. Three-row TAM/SAM/SOM table.
Gaming Arts Motivator deck, slide 4. Exact stored slide matched to this analysis.
Our analysis: A textbook bottom-up market at pre-seed: every figure is count × price.
Evidence and limitation: Customer counts, a stated price and a source.
What a founder can adapt: Build three rows: all possible customers, those you can serve, those you can reach first. Multiply each by your price.
Supporting analysis
What the deck claims: "Total Addressable Market: Unity developers in the world. Approximately 5.5 million. Possible revenue of $165,000,000 per year." "Serviceable Available Market: Unity developers in the US. Approximately 50,000. Possible revenue of $1,500,000 per year." "Serviceable Obtainable Market: Unity developers in CA. Approximately 15,000. Possible revenue of $450,000 per year." "Unit price = $30. Sources: unity3d.com."
Presentation choice: An investor can check each row, and the small obtainable market is honest.
When it does not fit: The obtainable market is one state with no reason given; say why California first and what share you expect.
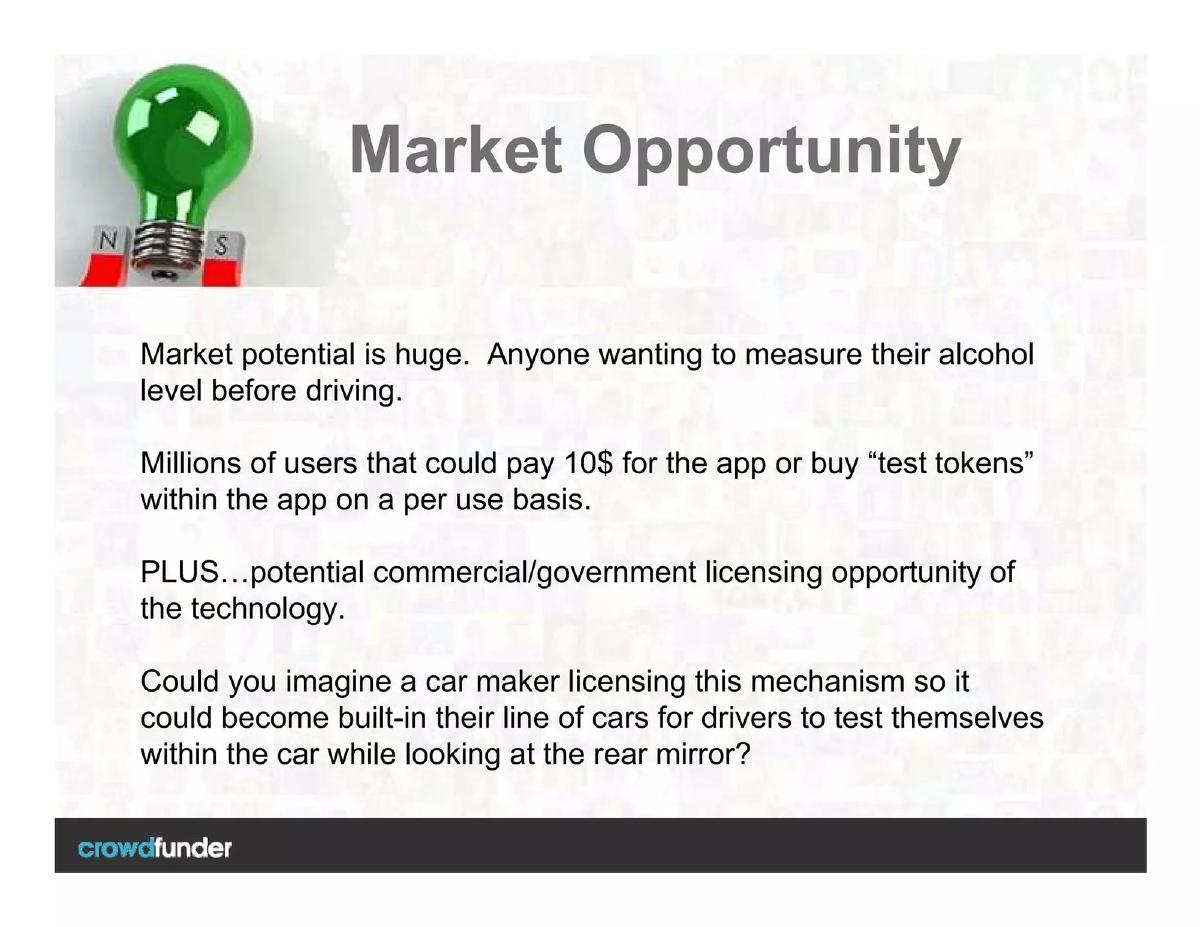
DUI App deck, slide 4. Exact stored slide matched to this analysis.
Our analysis: The weak example in this set: it asserts size instead of calculating it.
Evidence and limitation: A price ($10) but no customer count or source.
What a founder can adapt: Replace "millions" with a count from a source (for example, licensed drivers in one state) and multiply by the $10.
Supporting analysis
What the deck claims: "Market potential is huge. Anyone wanting to measure their alcohol level before driving." "Millions of users that could pay 10$ for the app or buy 'test tokens' within the app on a per use basis." "PLUS...potential commercial/government licensing opportunity of the technology."
Presentation choice: Included as a contrast; compare it with Gaming Arts Motivator at the same stage.
When it does not fit: "Huge" and "Could you imagine" invite doubt; one sourced number does more.
Seed. Cannabis producer. Four bullets plus a sales-by-category pie chart.
Monarch Farms deck, slide 3. Exact stored slide matched to this analysis.
Our analysis: The seed move: size the one market you are entering in detail rather than the national total.
Evidence and limitation: Price, competitor count, population and category sales for one state.
What a founder can adapt: Pick your first region or segment and give price, number of competitors and number of buyers.
Supporting analysis
What the deck claims: "Oregon Market." "Emerging recreational use cannabis market - Producer Licenses issued starting in Spring of 2016." "$9.20 average retail price per gram (higher than Colorado and Washington)." "Currently 293 active Producer Licensees vs. 625 in Colorado." "4 Million Oregon residents with a rising tourism trend." Pie: "Oregon 2015 Product Sales Category Breakdown".
Presentation choice: Comparing licences and prices with Colorado shows the gap is real and time-limited.
When it does not fit: No total for Oregon sales; add one line that sums the pie.
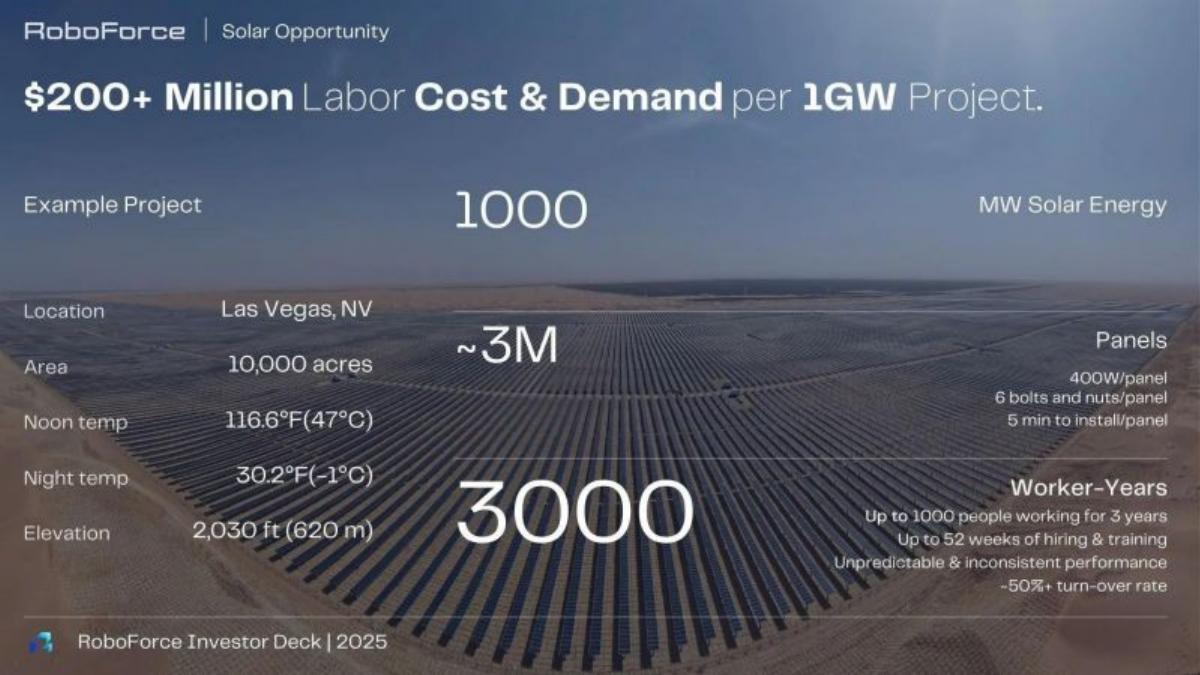
Seed. Robots for solar farm construction. One example project with its figures.
RoboForce deck, slide 6. Exact stored slide matched to this analysis.
Our analysis: Sizes the market one deal at a time: what a single customer project is worth.
Evidence and limitation: A worked example of one project's labour needs.
What a founder can adapt: Show one typical customer's spend in detail, then say how many such customers exist.
Supporting analysis
What the deck claims: "Solar Opportunity: $200+ Million Labor Cost & Demand per 1GW Project." "Example Project: Las Vegas, NV", "10,000 acres", "1000 MW Solar Energy", "~3M Panels", "5 min to install/panel", "3000 Worker-Years", "Up to 1000 people working for 3 years", "~50%+ turn-over rate".
Presentation choice: 3M panels × 5 minutes makes the labour cost concrete in a way a global TAM can't.
When it does not fit: Stops at one project; add how many 1GW projects are planned to turn it into a market.
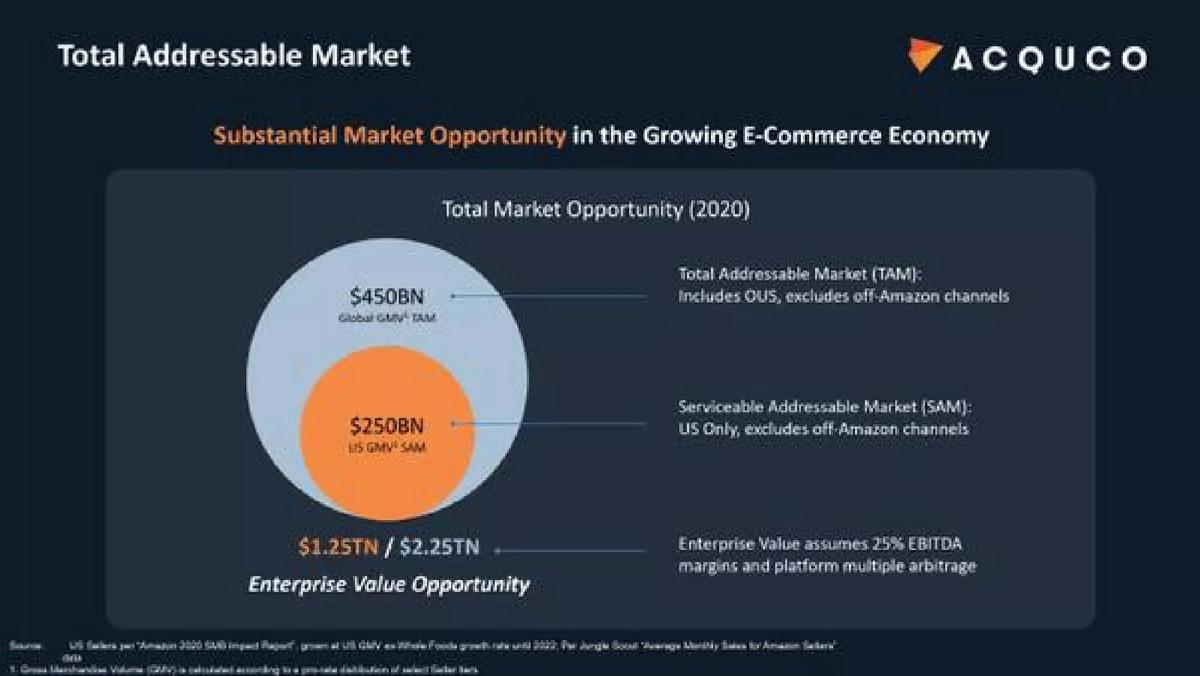
Series A. Buys and grows Amazon sellers. Nested TAM/SAM circles with footnoted sources.
Acquco deck, slide 6. Exact stored slide matched to this analysis.
Our analysis: The Series A move: a large total split into what the company can actually serve, with the rules stated.
Evidence and limitation: TAM and SAM with scope definitions, assumptions and a source.
What a founder can adapt: Define each circle in one line: what is in, what is out, and the source.
Supporting analysis
What the deck claims: "Substantial Market Opportunity in the Growing E-Commerce Economy." "$450BN Global GMV TAM: Includes OUS, excludes off-Amazon channels." "$250BN US GMV SAM: US Only, excludes off-Amazon channels." "$1.25TN / $2.25TN Enterprise Value Opportunity: Enterprise Value assumes 25% EBITDA margins and platform multiple arbitrage." Source note citing Amazon's 2020 SMB Impact Report.
Presentation choice: "Excludes off-Amazon channels" shows discipline; investors trust a market that says what it leaves out.
When it does not fit: The enterprise-value line mixes valuation with market size; keep it on another slide.
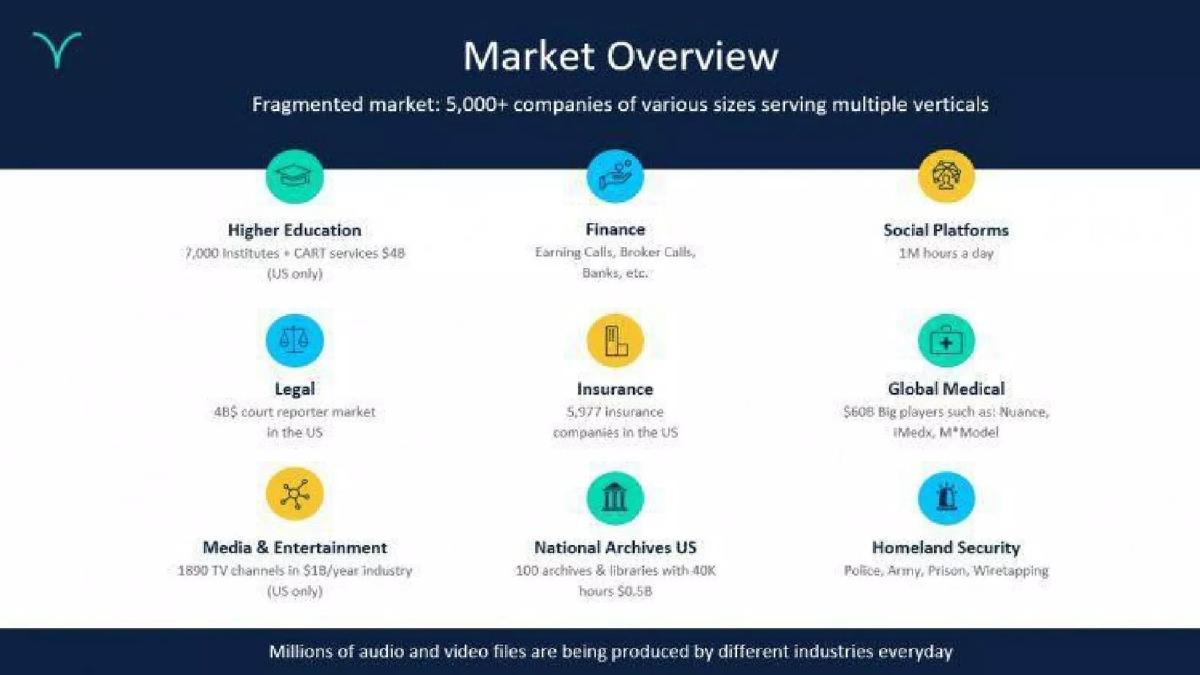
Verbit deck, slide 6. Exact stored slide matched to this analysis.
Our analysis: Sizes a horizontal product by showing each vertical it can sell into.
Evidence and limitation: Buyer counts or spend for each vertical; mixed units.
What a founder can adapt: If you sell across industries, give each one a buyer count or spend figure.
Supporting analysis
What the deck claims: "Market Overview. Fragmented market: 5,000+ companies of various sizes serving multiple verticals." Tiles include "Higher Education: 7,000 Institutes + CART services $4B (US only)", "Legal: 4B$ court reporter market in the US", "Insurance: 5,977 insurance companies in the US", "Media & Entertainment: 1890 TV channels in $18/year industry (US only)". "Millions of audio and video files are being produced by different industries everyday."
Presentation choice: Buyer counts per vertical (7,000 institutes, 5,977 insurers) are countable and credible.
When it does not fit: Units vary tile to tile and there is no total or source; pick one unit and add them up.
Series B. Carbon accounting software. Three demand figures.
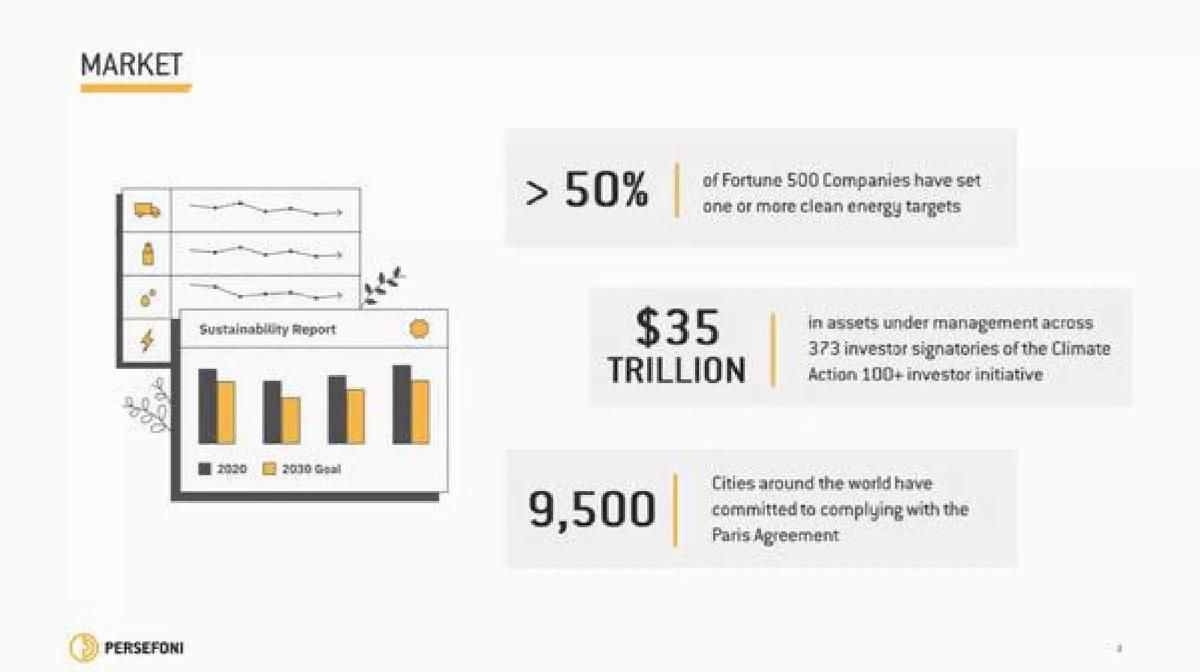
Persefoni deck, slide 2. Exact stored slide matched to this analysis.
Our analysis: Sizes the market through demand drivers: who must now buy, and why.
Evidence and limitation: Three counts of buyers under pressure to measure emissions; no dollar market size.
What a founder can adapt: If your market is new, count the buyers facing a deadline or rule.
Supporting analysis
What the deck claims: "Market." "> 50% of Fortune 500 Companies have set one or more clean energy targets." "$35 Trillion in assets under management across 373 investor signatories of the Climate Action 100+ investor initiative." "9,500 Cities around the world have committed to complying with the Paris Agreement."
Presentation choice: Each figure names a buyer group and the commitment that forces them to act.
When it does not fit: No revenue figure; add spend per buyer to turn the counts into a market size.
Before: Market potential is huge. Millions of users that could pay 10$ for the app.
After: [Number] licensed drivers in [state] (source: [DMV figure]) × $10 = [market]. We start with [city or group]: [count] × $10 = [obtainable].
What improved: Our illustrative rewrite; not DUI App's wording. It keeps the $10 price and leaves marked places for real counts and a source.
What this guide adds
The library covers problem, solution, traction and competition slides by stage. This guide does the same for market size slides, which founders most often get wrong by leading with a large top-down number.
Stage labels come from the stage recorded for each published teardown, all high confidence: two pre-seed, two seed, two Series A, two Series B. None of these eight decks appears in another guide.
What changes with stage, and what doesn't
The good examples all tie the market to a customer you can count (developers, licensed growers, solar projects, Amazon sellers, carmakers). That doesn't change with stage.
The scope does. Pre-seed decks size what they can reach first (Gaming Arts Motivator). Seed decks go deep on one market or one deal (Monarch Farms, RoboForce). Series A decks break a large total into what is serviceable (Acquco) or into verticals (Verbit). Series B decks add a timeline (Recogni) or the forces pulling buyers in (Persefoni).
Size without a method isn't a market slide. DUI App's "Market potential is huge" and "Millions of users" is the weakest example here; it names no count, no source and no share.
Common mistakes
Top-down only. A huge total with no calculation isn't credible.
No source. Cite every count and forecast.
Mixed units. Keep revenue, users and companies separate.
No obtainable market. Say which part you can reach first.
Valuation on the market slide. Keep company value out of market size.
Diagnostic checklist
A customer you can count.
Count × price shown.
The part you can reach first.
Scope that fits your stage.
Sources for every figure.
Frequently asked questions
How we chose these examples
Corpus: published pitch deck teardowns on StartupFundraising.com. Founder-uploaded private decks are excluded.
Selection (2026-09-25): we took teardowns whose recorded stage is pre-seed, seed, Series A or Series B with high confidence, found slides whose text begins with Market, TAM or Opportunity (about 128 seed, 53 Series A, 25 pre-seed and 25 Series B decks qualified), excluded any deck already used in another guide, and kept only slides with a stored image. From the remaining candidates we chose two per stage with readable, specific content, including one deliberately weak pre-seed example for contrast.
Stage is the round recorded for each teardown, not a judgment about the company today.
Review: stored slide images and extracted text were checked on 2026-09-25 and matched to company, deck and slide number (editorial model review). No person has yet completed an editorial review of this page.
Figures are as shown on the slides; we have not verified them. We make no claim that any slide caused a fundraising outcome.