Climate and Energy Market Size Slides: 7 Real Examples
How climate, energy and battery startups size their market: homes times install price, gigawatts of capacity, the component they replace.
Climate Market Slide: Size It in Homes, Gigawatts and Components
Climate and energy markets are usually measured in physical units: homes to retrofit, gigawatts to build, tonnes of material to process. The strongest climate market slides start from those units, narrow them to where the company's technology is cost-competitive, and apply a price. Weaker ones show a global transition figure or an adoption trend without saying which part the company sells into. This guide compares seven real climate and energy market slides, from a state-by-state home count to a slide about EV adoption.
TL;DR
Count the physical units your product serves, narrow to where it is cost-competitive, and multiply by your price. Dandelion Energy counts "33M homes in 32 states where Geo is cost competitive" and shows the maths: "33M x $30K". NuScale narrows 16,407 GW of required carbon-free capacity to 1,286 GW of small modular reactor additions. Blink's slide shows EV sales growth but not the charging market it sells into.
Climate and energy market slides from real pitch decks
Each example shows the slide above its analysis and links to the full teardown. Slides with a checkable calculation come first. Claims are as shown on the slides; comments are ours.
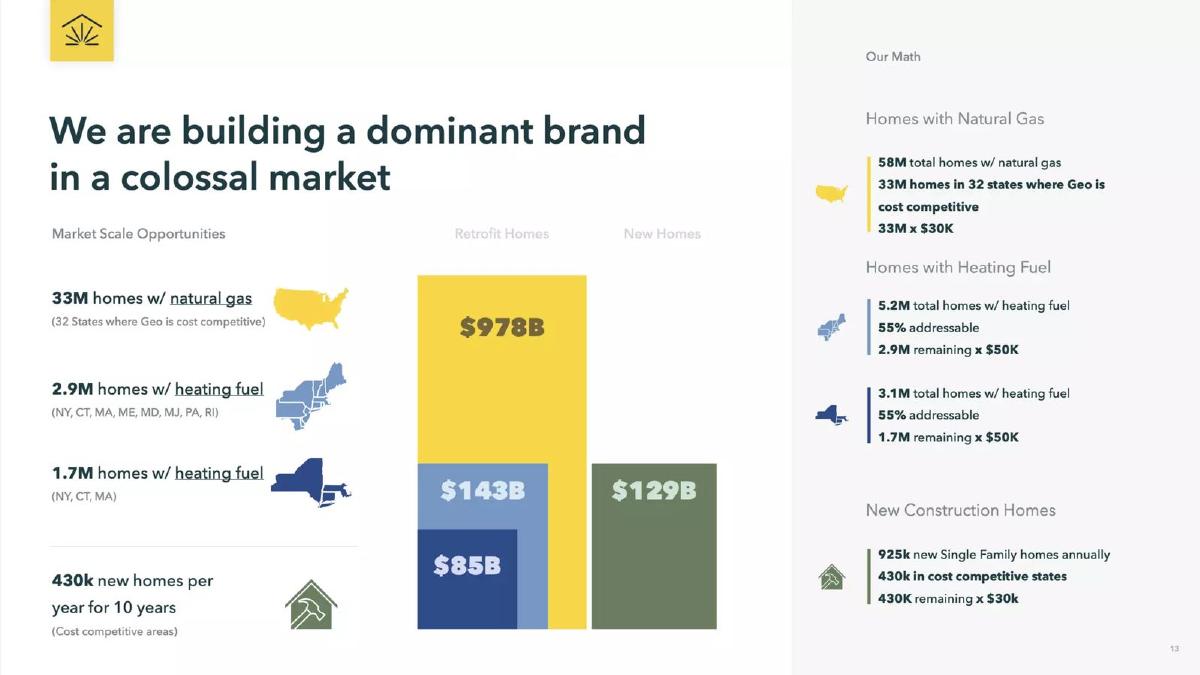
Dandelion Energy market slide — slide 13
Geothermal heat pumps for homes, US.
Dandelion Energy deck, slide 13. Exact stored slide matched to this analysis.
Our analysis: Homes × price, filtered by cost-competitiveness.
Evidence and limitation: Every figure is homes times an install price, filtered by where geothermal is cost-competitive, with the maths printed beside it. It gives no source for the home counts or prices.
What a founder can adapt: "[N] [homes/sites] where we're cost-competitive × $[price] = $[X]."
Supporting analysis
What the deck claims: "We are building a dominant brand in a colossal market." "33M homes w/ natural gas (32 States where Geo is cost competitive)." "2.9M homes w/ heating fuel (NY, CT, MA, ME, MD, NJ, PA, RI)." "1.7M homes w/ heating fuel (NY, CT, MA)." "430k new homes per year for 10 years." Bars: $978B, $143B, $85B retrofit; $129B new homes. "Our Math": "58M total homes w/ natural gas, 33M homes in 32 states where Geo is cost competitive, 33M x $30K"; "5.2M total homes w/ heating fuel, 55% addressable, 2.9M remaining x $50K".
Presentation choice: Investors can check each segment and see which comes first.
When it does not fit: Leaving out where the counts come from.
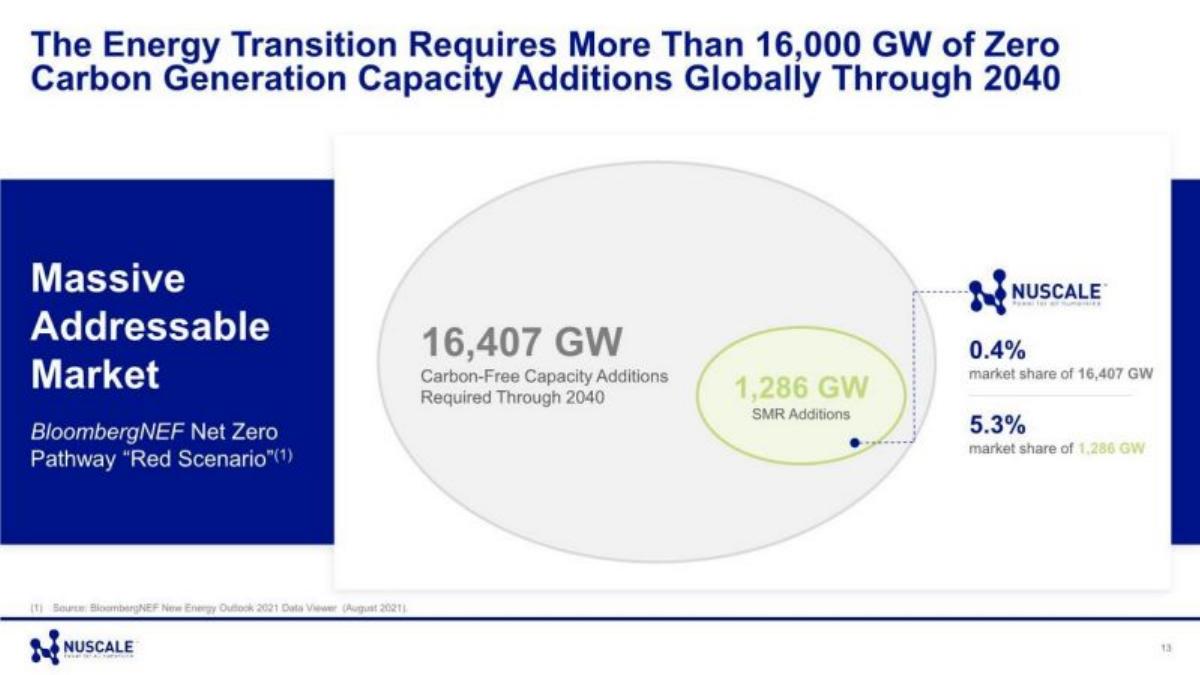
NuScale deck, slide 13. Exact stored slide matched to this analysis.
Our analysis: Transition narrowed to its technology, with a named scenario.
Evidence and limitation: It narrows the whole transition to its own technology's slice and names the scenario and source. It sizes in gigawatts without a price per gigawatt, so there is no dollar figure.
What a founder can adapt: "[N] GW needed ([source, scenario]). [Technology] share: [M] GW. At $[X]/GW = $[Y]."
Supporting analysis
What the deck claims: "The Energy Transition Requires More Than 16,000 GW of Zero Carbon Generation Capacity Additions Globally Through 2040." "Massive Addressable Market. BloombergNEF Net Zero Pathway 'Red Scenario'." "16,407 GW Carbon-Free Capacity Additions Required Through 2040." "1,286 GW SMR Additions." "0.4% market share of 16,407 GW", "5.3% market share of 1,286 GW".
Presentation choice: Naming the scenario lets investors judge how optimistic the figure is.
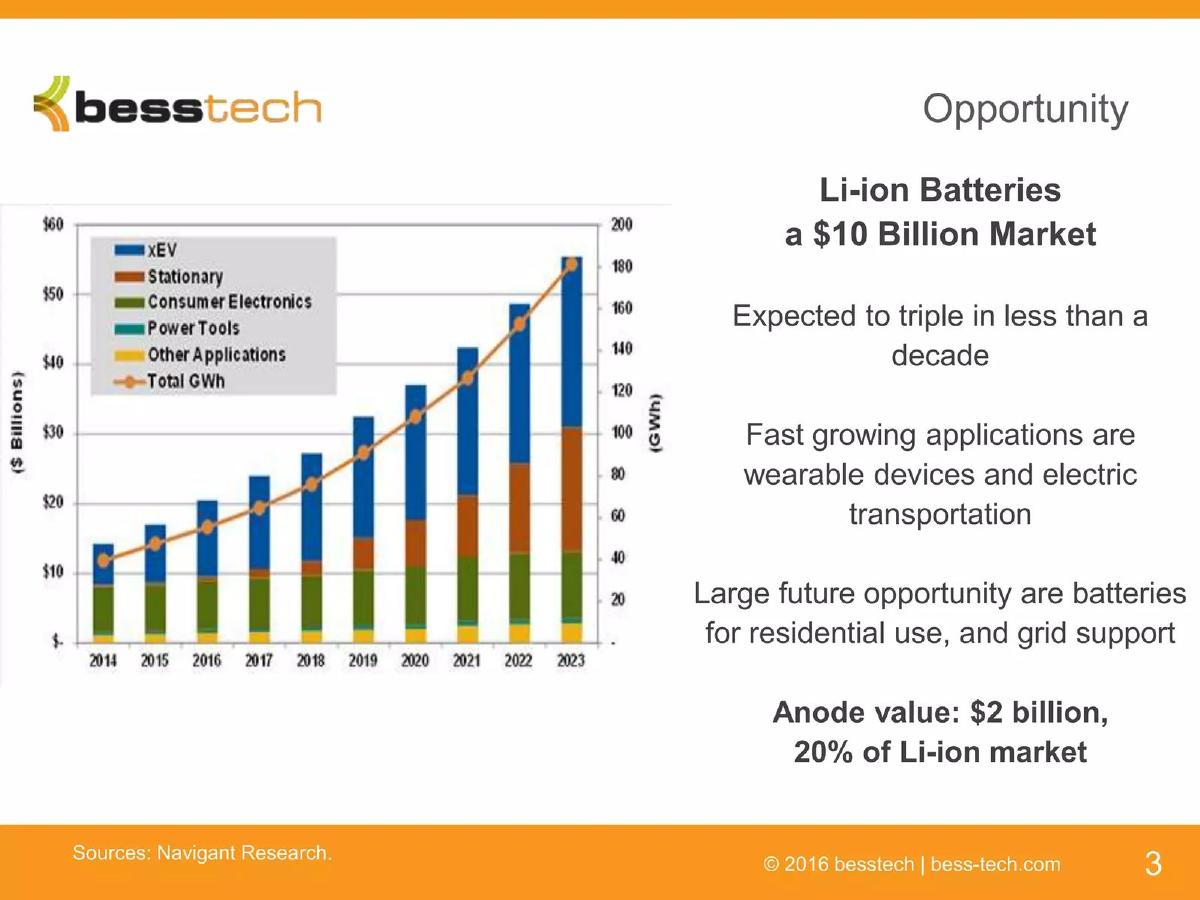
Silicon anode material for lithium-ion batteries, 2016 deck.
Besstech deck, slide 3. Exact stored slide matched to this analysis.
Our analysis: The component's value, split out of the system.
Evidence and limitation: It separates the component it makes (anodes, $2B) from the whole battery market ($10B) and names its source. It gives no share target.
What a founder can adapt: "[System] $[X]; [component] = [N]% = $[Y] ([source])."
Supporting analysis
What the deck claims: "Opportunity." "Li-ion Batteries a $10 Billion Market. Expected to triple in less than a decade." "Fast growing applications are wearable devices and electric transportation." "Anode value: $2 billion, 20% of Li-ion market." Chart by application (xEV, stationary, consumer electronics, power tools). "Sources: Navigant Research."
Presentation choice: A materials company sells one component, so that is its market.
When it does not fit: Claiming the whole system market.
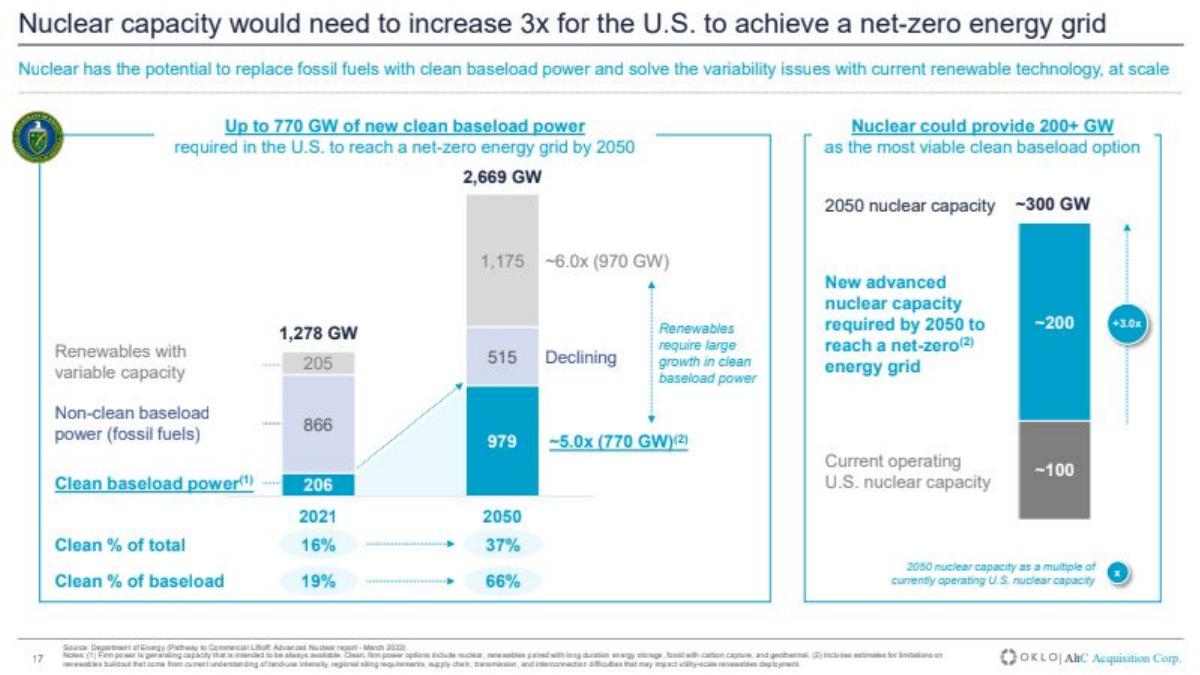
Oklo deck, slide 17. Exact stored slide matched to this analysis.
Our analysis: Capacity need narrowed to new nuclear, dated source.
Evidence and limitation: It narrows US capacity needs to clean baseload and then to new nuclear, with a dated government source. Like NuScale, it stays in gigawatts and doesn't say how much of the 200 GW Oklo's plant size could serve.
What a founder can adapt: "[Country] needs [N] GW of [type] by [year] ([source]). Our plants: [size] MW each."
Supporting analysis
What the deck claims: "Nuclear capacity would need to increase 3x for the U.S. to achieve a net-zero energy grid." "Up to 770 GW of new clean baseload power required in the U.S. to reach a net-zero energy grid by 2050." "Nuclear could provide 200+ GW as the most viable clean baseload option." "Current operating U.S. nuclear capacity ~100." Source: Department of Energy, Pathway to Commercial Liftoff: Advanced Nuclear (March 2023).
Presentation choice: A government source with a date makes the projection checkable.
When it does not fit: Stopping at the category's gigawatts.
Rainwater-powered home electricity generator for off-grid households.
Rainergy deck, slide 3. Exact stored slide matched to this analysis.
Our analysis: Households by country, no price.
Evidence and limitation: It names the buyer (low-income rural households) and the launch countries, and narrows in households. It doesn't say whether 1.5B is people or households, and gives no price or source.
What a founder can adapt: "[N] [households] in [countries] ([source]). Target [M] × $[price] = $[X]."
Supporting analysis
What the deck claims: "Market Size." "Total aviable Market 1.5 B+." "Servicable aviable Market 33 M+." "Share of Market 332 K+." "Low-income rural households in target segment (Indonesia, Philippine, India and 10 countries)."
Presentation choice: Naming the buyer and countries makes the funnel concrete.
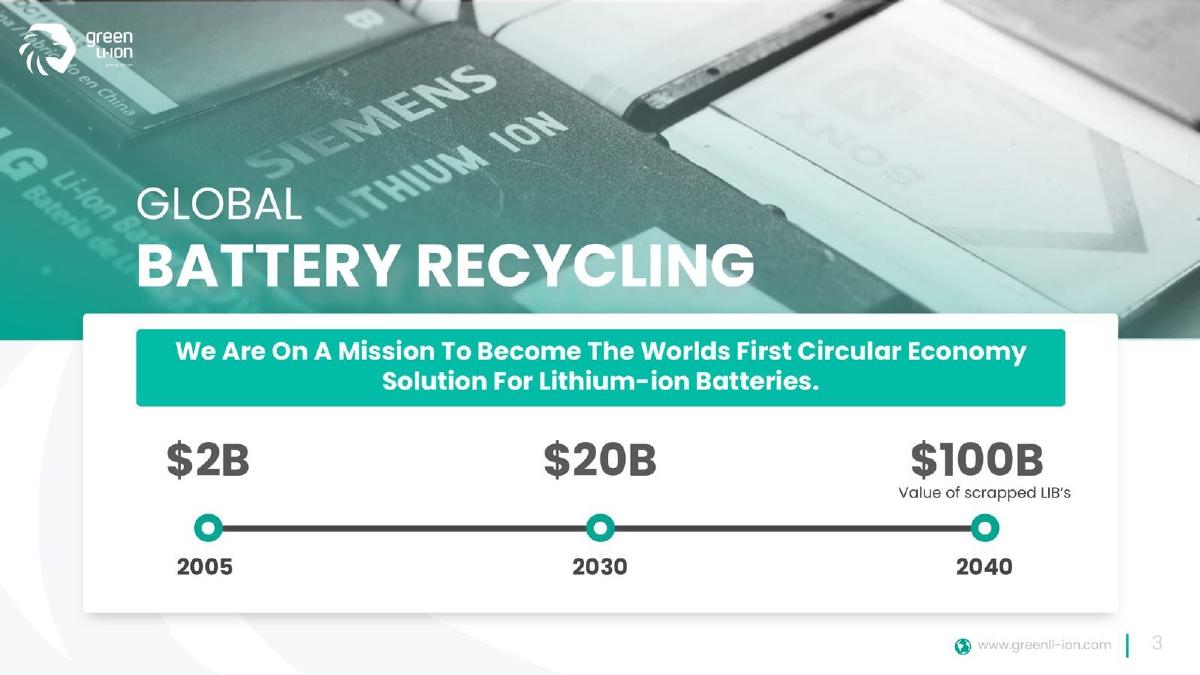
Green Li-ion deck, slide 3. Exact stored slide matched to this analysis.
Our analysis: Material value over time, no source.
Evidence and limitation: It names the material it processes and shows how that value grows. The figures have no source, and the last one is the value of scrapped batteries rather than what a recycler earns.
What a founder can adapt: "[N] tonnes of [material]/yr by [year] ([source]); our margin $[X]/tonne."
Supporting analysis
What the deck claims: "Global Battery Recycling." "We Are On A Mission To Become The Worlds First Circular Economy Solution For Lithium-ion Batteries." "$2B 2005", "$20B 2030", "$100B Value of scrapped LIB's 2040".
Presentation choice: For recycling, the value of the input material sets the ceiling.
When it does not fit: Using the material's value as your revenue.
EV charging equipment and networks, 2020 investor presentation.
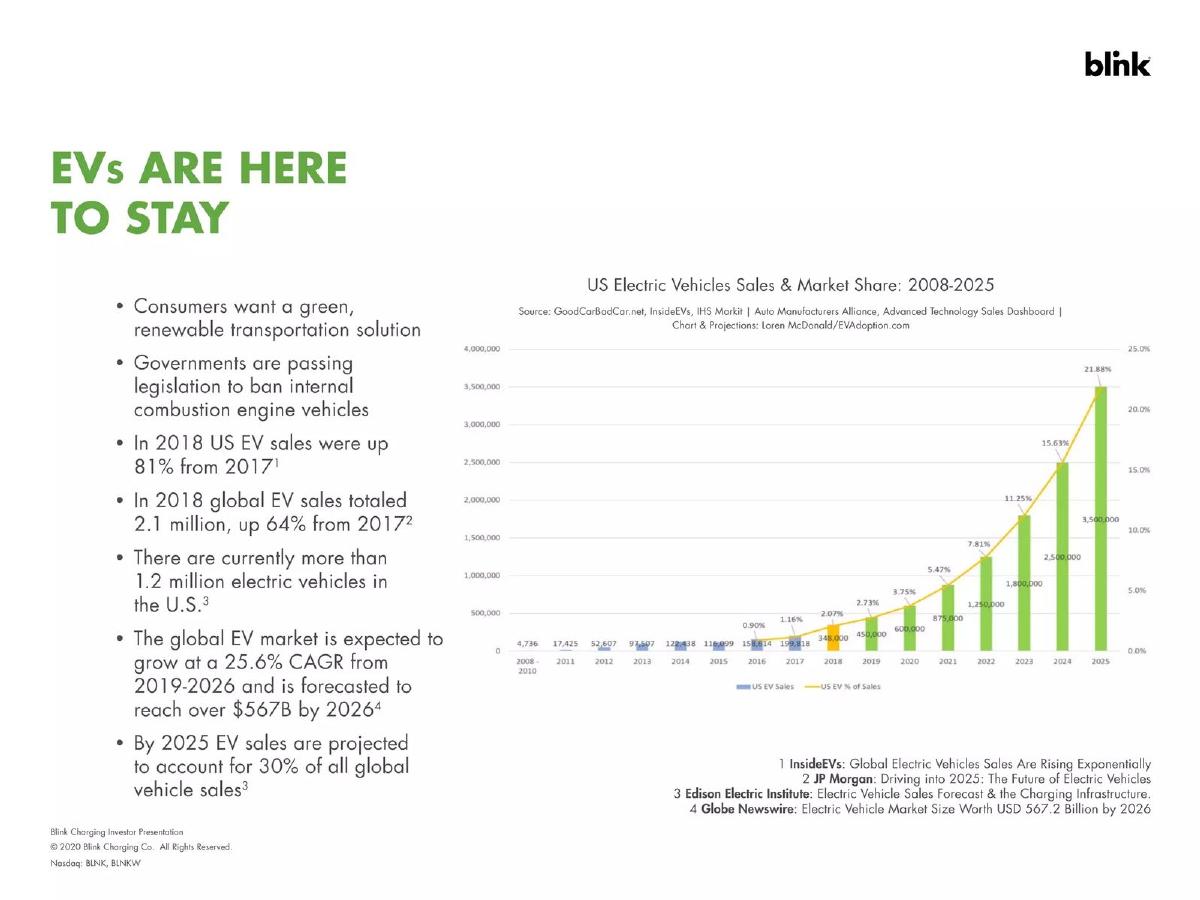
Blink Charging deck, slide 4. Exact stored slide matched to this analysis.
Our analysis: Adjacent market trend, not the company's own market.
Evidence and limitation: Weaker example. The adoption trend is sourced, but the $567B figure is the vehicle market, not charging, and the slide doesn't size chargers or charging revenue.
What a founder can adapt: "[N] EVs by [year] → [M] chargers needed × $[price] = $[X] ([source])."
Supporting analysis
What the deck claims: "EVs are here to stay." "In 2018 US EV sales were up 81% from 2017." "In 2018 global EV sales totaled 2.1 million, up 64% from 2017." "The global EV market is expected to grow at a 25.6% CAGR from 2019-2026 and is forecasted to reach over $567B by 2026." "By 2025 EV sales are projected to account for 30% of all global vehicle sales." Chart of US EV sales and share, 2008–2025, with sources.
Presentation choice: Investors need the charging market, which the trend only implies.
When it does not fit: Quoting the vehicle market for a charging company.
Which kind of climate market slide answers which question.
Approach
Example
Answers
Leaves open
Homes × price, cost filter
Dandelion Energy
Checkable segments
Source
Transition → technology slice
NuScale
Scenario-based share
Price per GW
Component value
Besstech
What the component is worth
Share target
Capacity need → new nuclear
Oklo
Dated national need
Company's share
Households by country
Rainergy
Buyer and geography
Units, price
Material value over time
Green Li-ion
Input ceiling
Source, revenue
Adjacent adoption trend
Blink Charging
Demand driver
Charging market size
Key Takeaways
Count homes, gigawatts or tonnes.
Narrow to where you are cost-competitive.
Multiply by your price.
Size the component you sell, not the whole transition.
Cite the scenario or source.
Write your climate market slide
Answer these before you design the slide.
Unit. What do you count: homes, gigawatts, tonnes, vehicles?
Filter. Where is your technology cost-competitive today?
Price. What do you earn per unit, or what is your component worth?
Source. Which scenario or dataset, and what year?
Copyable framework: [N] [units] where we're cost-competitive ([source]) × $[price] = $[X]. First market: [where].
Illustrative example 1 — written by us
Before: "The global EV market ... is forecasted to reach over $567B by 2026."
After: "[N] EVs in [country] by [year] need [M] public chargers × $[price] = $[X] ([source])."
What improved: Our illustrative rewrite of Blink's slide; bracketed text is a placeholder, not company fact.
What's different about climate market sizing
Energy transition totals are enormous and widely published, so a big number alone tells investors little. They want to know which slice the technology can win on cost today, which depends on geography, fuel prices and regulation. A slide that shows that narrowing is more convincing than one that quotes a net-zero scenario.
What investors check
Whether the unit matches the product (homes for a heat pump, gigawatts for a reactor). Whether the cost-competitive filter is explained. Whether the component value is separated from the full system. Whether projections name their scenario and date.
How we read each slide
We quote the text on the slide images. We have not checked any market figure or source. Page numbers are pages in the original deck file. Three images were already stored and were checked against the decks; four were rendered from the deck PDFs.
Common mistakes
Whole transition. Narrow to your technology's slice.
Units with no price. Gigawatts and homes need a price to become a market.
Adjacent market. Size what you sell, not what it enables.
No scenario. Name the forecast and its date.
Diagnostic checklist
Physical unit counted.
Cost-competitive filter explained.
Price applied.
Scenario and source cited.
Frequently asked questions
How should a climate startup size its market?
Count the units your product serves where it is cost-competitive and multiply by your price. Dandelion Energy shows 33M homes × $30K.
Is a net-zero scenario figure enough for a market slide?
Only as a starting point. NuScale narrows 16,407 GW of required capacity to the 1,286 GW its technology type could supply, and names the scenario.
How we chose these examples
Corpus: published pitch deck teardowns on StartupFundraising.com. Founder-uploaded private decks are excluded.
Selection (2026-09-26): we searched climate, energy, battery, recycling and EV teardowns for market size and market opportunity headings, scanned twelve candidate decks around the matching pages, and kept seven.
Excluded: Urjakart (home improvement, not climate), Metafuels and Ever Dye (matching pages were not market sizing), Eco World (problem pages), PVcase (installation growth for a software product; weaker than the seven kept). Teardown text numbering differed from deck-file pages for Dandelion Energy (teardown p12), NuScale (p11), Green Li-ion (teardown text p3 matched) and Blink (p2); pages were matched by eye.
Page numbers are pages in the original deck files. Besstech, Rainergy and Blink images were already stored and were checked against the decks; the other four were rendered from the deck PDFs. All seven decks were confirmed as published teardowns on 2026-09-26.
Market figures and sources are quoted from the slides and not independently verified.
Review: slide images were checked on 2026-09-26 and matched to company, deck and page (editorial model review). No person has yet completed an editorial review of this page. We make no claim that any slide caused a fundraising outcome.