NuScale’s SPAC deck is a sophisticated exercise in risk mitigation for a high-stakes industry. Facing the multi-billion dollar hurdle of nuclear development, the company successfully pivoted the investor narrative from 'infrastructure builder' to 'technology licensor.' The presentation emphasizes their status as the first and only SMR to receive NRC Standard Design Approval (Slide 7), effectively de-risking the regulatory path. By highlighting a 'near-zero capex' and 'no inventory' business model (Slide 25), NuScale addressed the primary deterrent for energy investors: the crushing weight of…
Key takeaways
- NuScale positions itself as a technology provider that holds no inventory and requires near-zero capex for plant construction (Slide 25).
- The company leverages 14 years of R&D and $1.3 billion in cumulative capital invested to demonstrate maturity (Slide 7).
- Regulatory de-risking is central, highlighting the first-ever NRC Standard Design Approval for an SMR (Slide 7).
- The management team boasts an average of 36 years of energy industry experience, emphasizing operational stability (Slide 9).
- Market sizing is framed through a 'Red Scenario' requiring 16,407 GW of carbon-free capacity by 2040 (Slide 13).
- The deck introduces 'Cash Revenue' as a non-GAAP metric to account for long-lead payment cycles in nuclear construction (Slide 35).
- A robust pipeline of 114 customer opportunities is categorized by 'Class' to show lead progression (Slide 29).
- The transaction overview details a $1.866 billion pro-forma implied enterprise value at closing (Slide 39).
Executive Summary: The Pivot to Technology Licensing
NuScale Power’s investor presentation for its 2022 SPAC merger with Spring Valley Acquisition Corp is a masterclass in framing. Nuclear energy is historically associated with massive cost overruns, decade-long construction timelines, and intense regulatory hurdles. NuScale uses these 45 slides to systematically dismantle those perceptions. By presenting themselves as a technology licensor rather than a construction firm, they successfully marketed a $1.9 billion transaction. The deck focuses heavily on their 14-year R&D history and their unique status as the only Small Modular Reactor (SMR) with U.S. Nuclear Regulatory Commission (NRC) approval.
Slides 1-5: The SPAC Leadership and Foundation
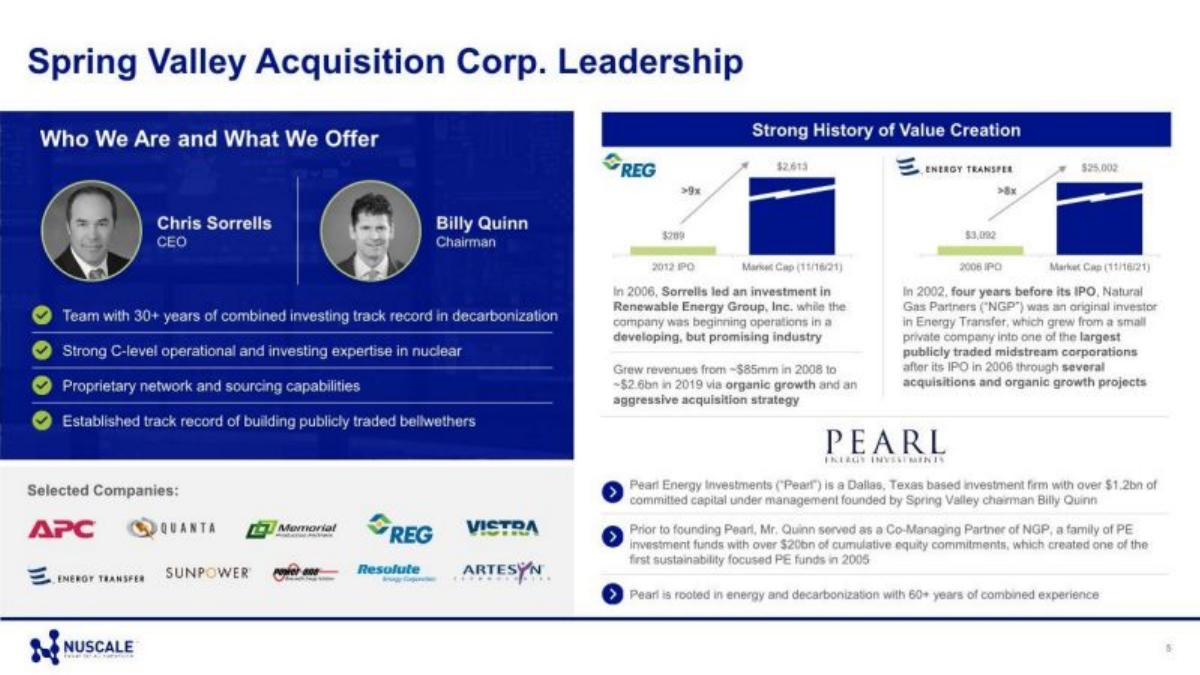
The presentation opens with a standard title slide and a dense legal disclaimer. Slide 5 introduces the leadership of Spring Valley Acquisition Corp, specifically CEO Chris Sorrells and Chairman Billy Quinn. This slide serves to establish the 'smart money' behind the deal, highlighting their 30+ years of investing in decarbonization and their history with companies like Renewable Energy Group (REG) and Energy Transfer. By showing a 9x return on REG and an 8x return on Energy Transfer, the sponsors are signaling to investors that they have a track record of picking winners in the complex energy transition space.
Slides 7-9: NuScale by the Numbers and Management
Slide 7 is the 'traction' slide of the deck. It lists several high-impact metrics: 14 years of R&D, $1.3 billion in cumulative capital invested, and 628 patents. The most critical piece of data here is the '1st and Only SMR to Receive NRC Standard Design Approval.' For investors, the NRC is the ultimate gatekeeper; showing a formal approval letter on the right side of the slide is a powerful visual proof of de-risking. Slide 9 introduces the NuScale management team, emphasizing an average of 36 years of energy industry experience. The presence of former leaders from Fluor, GE, and the U.S. Navy suggests a team that understands both the commercial and technical rigors of nuclear power.
Slides 11-15: Market Opportunity and Competitive Advantage
The market overview begins on Slide 13, using BloombergNEF data to project a need for 16,407 GW of carbon-free capacity by 2040. NuScale conservatively claims a 0.4% share of that total market, which still equates to a massive 1,286 GW SMR opportunity. Slide 15 is a direct head-to-head comparison between NuScale SMRs and large-scale nuclear. It highlights a $3.3 billion upfront capex for NuScale versus $9.0+ billion for traditional plants, and a 3-year construction window versus 6+ years. This slide is designed to position SMRs as a more 'digestible' investment for utilities that cannot afford the balance sheet risk of traditional nuclear mega-projects.
Slides 19-21: Intellectual Property and Safety Standards
Slide 19 focuses on the 'moat.' With 418 issued patents and a workforce where 20% of engineers are veterans (primarily from the U.S. Navy's nuclear program), NuScale emphasizes that their value is in their brains and IP, not just steel and concrete. Slide 21 introduces the 'Triple Crown of Nuclear Plant Safety.' It claims an 'unlimited coping period' during a station blackout, meaning the reactor can shut down and cool itself indefinitely without human intervention or external power. This is a direct response to the safety concerns that have plagued the industry since Fukushima.
Slides 25-27: The Business Model and Applications
Slide 25 is perhaps the most important slide for a financial analyst. It explicitly states that NuScale 'owns patents and intellectual property,' has 'near-zero capex,' and 'holds no inventory.' This is the 'asset-light' pitch. They aren't building the plants; they are selling the modules (77 MWe each) and the designs. Slide 27 expands the use cases beyond just the power grid, including coal plant replacement, hydrogen production, and carbon capture. By positioning the SMR as a versatile tool for the entire 'Energy Transition,' they broaden their potential customer base from just electric utilities to industrial giants.
Slides 29-31: The Sales Pipeline and UAMPS
Slide 29 visualizes a pipeline of 114 customer opportunities. They use a 'Class' system to categorize leads, with Class 1 being a signed contract and Class 5 being initial leads. This transparency helps investors understand the sales cycle. Slide 31 focuses on their most advanced project: the Utah Associated Municipal Power Systems (UAMPS) Carbon Free Power Project. It provides a concrete timeline, showing a target LCOE (Levelized Cost of Energy) of $58/MWh and a $1.4 billion DOE grant. This project serves as the 'proof of concept' that the theoretical benefits of SMRs can be realized in a commercial setting.
Slides 35-37: Financial Profile and Cash Metrics
Because of the long lead times in nuclear construction, traditional GAAP accounting doesn't tell the whole story. Slide 35 introduces 'Cash Revenue' and 'Cash COGS.' It shows that NuScale expects to collect 100% of cash revenue by the 'COD' (Commercial Operation Date), while GAAP revenue recognition lags significantly. Slide 37 provides a multi-year projection through 2030. It shows GAAP revenue growing from $14 million in 2022 to $5.5 billion in 2030, while 'Cash Revenue' hits $13.1 billion in the same period. This distinction is vital for justifying the company's valuation during the long pre-operational phase.
Slides 39-41: Transaction Overview and Valuation
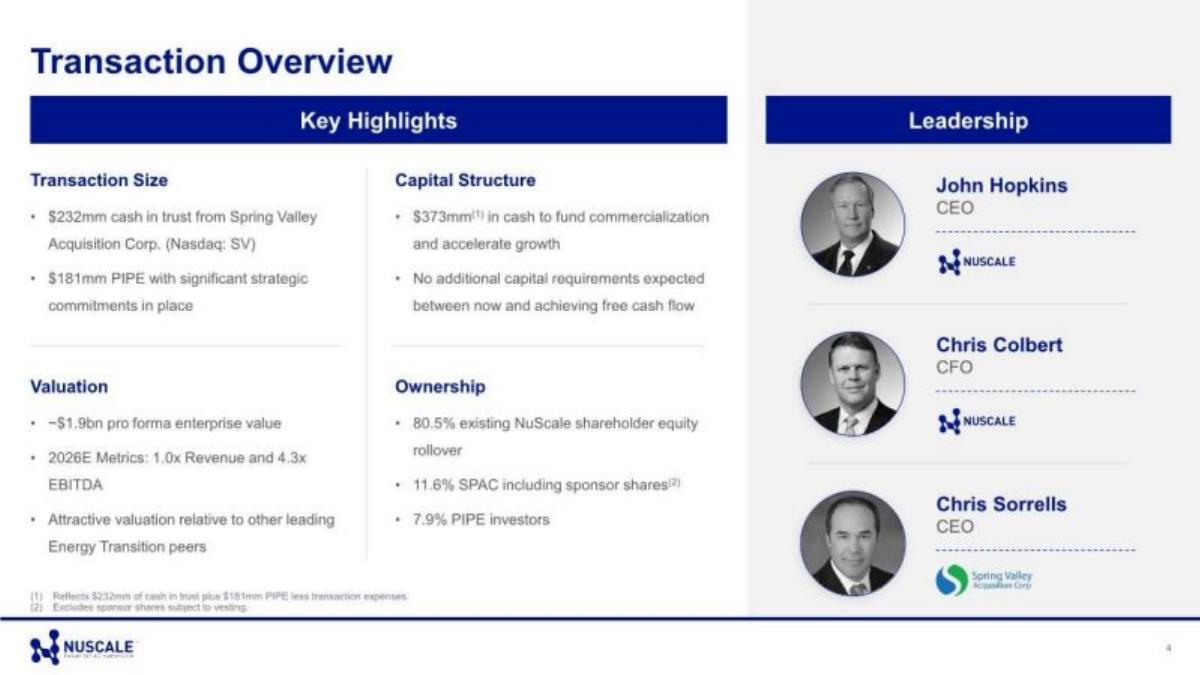
Slide 39 breaks down the SPAC deal. The total sources of $2.288 billion include $232 million from SVAC equity and $181 million in PIPE financing. The 'Pro-Forma Implied Enterprise Value' is set at $1.866 billion. Slide 41 provides valuation benchmarking against 'Energy Transition' peers (like Enphase and Plug Power) and 'Nuclear' peers (like Cameo and BWXT). NuScale argues that its 2025E EV/EBITDA multiple of 9.8x is a significant discount compared to the energy transition median of 37.5x, suggesting significant upside for SPAC investors.
Slide 43: Key Investment Highlights Recap
The deck concludes with a summary of the six core pillars: massive market, first-to-market advantage, expanding pipeline, strategic partners, visionary team, and the capex-light model. It reiterates the four brand keywords: Smarter, Cleaner, Safer, and Cost Competitive. This slide serves as the final 'elevator pitch' for the entire 45-slide presentation.
What NuScale Does Well
Regulatory De-risking: By placing the NRC approval front and center, they address the single biggest risk in nuclear energy immediately. · Business Model Innovation: Framing a nuclear company as an 'IP-heavy, capex-light' business is a brilliant way to attract tech and ESG investors who would normally avoid infrastructure-heavy plays. · Visual Proof: The use of actual letters from the NRC and photos of the test facilities (Slide 7, Slide 25) makes the technology feel 'real' rather than theoretical. · Non-GAAP Clarity: The explanation of 'Cash Revenue' (Slide 35) is essential for an industry with such long payment cycles, preventing investors from being spooked by low GAAP numbers in the early years.
What is Missing from the Deck
Decommissioning Costs: While the deck focuses on construction and operation, it omits the long-term costs and liabilities associated with nuclear waste and plant decommissioning. · Detailed Competitor Analysis: Slide 41 compares valuations, but there is no slide detailing the technical differences between NuScale and other SMR competitors like TerraPower or X-energy. · Supply Chain Specifics: While they mention partners like Doosan and Samsung, they don't detail the risks associated with sourcing specialized nuclear-grade components or fuel (HALEU).
What Other Founders Should Copy
The 'Class' Pipeline: Categorizing leads by maturity (Slide 29) is a great way for any B2B company with a long sales cycle to show progress without over-promising. · The Head-to-Head Comparison: Slide 15 is a perfect example of how to position a 'new way' against an 'old way' by using clear, check-marked metrics. · Sponsor Credibility: If you are raising a large round, dedicate space to the track record of your lead investors (Slide 5). It borrows authority and builds trust. · The 'Why Now' Slide: Slide 13 uses global macro trends (Net Zero targets) to create a sense of urgency, making the investment feel like a necessity rather than an option.
Frequently asked questions
- What is NuScale's core business model?
- NuScale operates as a B2B technology licensor. According to Slide 25, they sell NuScale Power Modules (77 MWe each) and standard plant designs to utility and industrial customers. Crucially, they emphasize owning the IP while maintaining a 'near-zero capex' profile and holding no inventory, shifting the heavy lifting of construction costs to the customers and partners.
- How does NuScale compare to traditional large-scale nuclear power?
- Slide 15 outlines several advantages: NuScale's SMRs have a 3-year construction time versus 6+ years for large-scale plants. Upfront capex is estimated at $3.3 billion for a 924 MWe plant, compared to $9.0+ billion for traditional 2.2 GWe plants. Additionally, NuScale claims an 'unlimited' safety coping period without operator action, whereas traditional reactors require action within hours.
- What is the significance of the UAMPS project mentioned in the deck?
- The Utah Associated Municipal Power Systems (UAMPS) project is NuScale's flagship commercial deployment. Slide 31 shows a timeline starting in 2013, with the first power module scheduled for installation in 2029. This project serves as the 'Class 1' contract in their pipeline, proving the commercial viability of their SMR technology with a target LCOE of $58/MWh.
- How does NuScale handle its long revenue cycles in its financials?
- Because nuclear projects take years to build, NuScale uses 'Cash Revenue' and 'Cash EBITDA' to show liquidity. Slide 35 explains that they collect cash significantly faster than GAAP revenue recognition allows. For example, by year T-4 of a project, they expect to have collected 31% of cash revenue, while GAAP recognition remains at 3%.
- Who are NuScale's primary strategic partners?
- Slide 7 lists several major industrial and energy players as existing investors and supply chain partners, including Fluor, Doosan, JGC, GS Energy, Sarens, IHI, and Samsung C&T. These partnerships are vital for NuScale's 'capex-light' strategy, as these firms provide the manufacturing and construction muscle.