How education startups size their market: learners times price, priority segments by country, and the category they compete in.
Edtech Market Slide: Count the Learners Who Will Pay
Education markets are easy to make look huge: billions of students, trillions in global education spending. Investors discount those figures because most learners never pay a startup. The stronger edtech market slides count the specific learners or professionals who pay, say who pays (the learner, an employer, a lender), and apply a price. This guide compares seven real edtech market slides, from a three-number formula to a total built on youth unemployment.
TL;DR
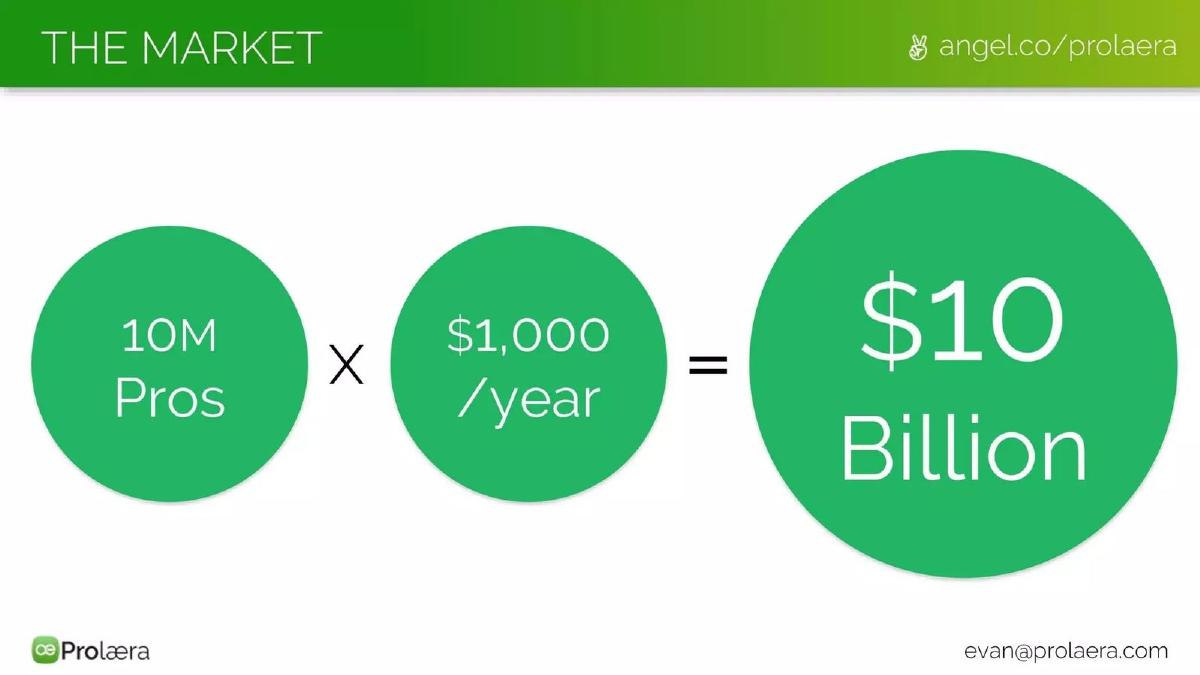
Count the learners who will pay, and multiply by what they pay. Prolaera's slide is the whole formula: "10M Pros x $1,000/year = $10 Billion". CodersTrust splits 43.5M students into first- and second-priority segments by country and by how they pay. MBE Academy's total counts unemployed and under-employed youth without saying how many would pay for training.
Edtech market slides from real pitch decks
Each example shows the slide above its analysis and links to the full teardown. Slides with a checkable calculation come first. Claims are as shown on the slides; comments are ours.
Prolaera market slide — slide 6
Continuing-education compliance and course platform for accounting professionals.
Prolaera deck, slide 6. Exact stored slide matched to this analysis.
Evidence and limitation: The whole market is one multiplication of paying professionals by annual spend. It doesn't say which professions or countries the 10M covers, or where the $1,000 comes from.
What a founder can adapt: "[N] [learners] in [where] ([source]) × $[price]/year = $[X]."
Supporting analysis
What the deck claims: "The Market." "10M Pros" "X" "$1,000 /year" "=" "$10 Billion".
Presentation choice: Investors can check both inputs at a glance.
When it does not fit: Leaving the count and price unsourced.
Online tech-skills training for freelancers, funded upfront or by student finance; Bangladesh, Malaysia and India.
CodersTrust deck, slide 6. Exact stored slide matched to this analysis.
Our analysis: Learners by payment route, country and priority.
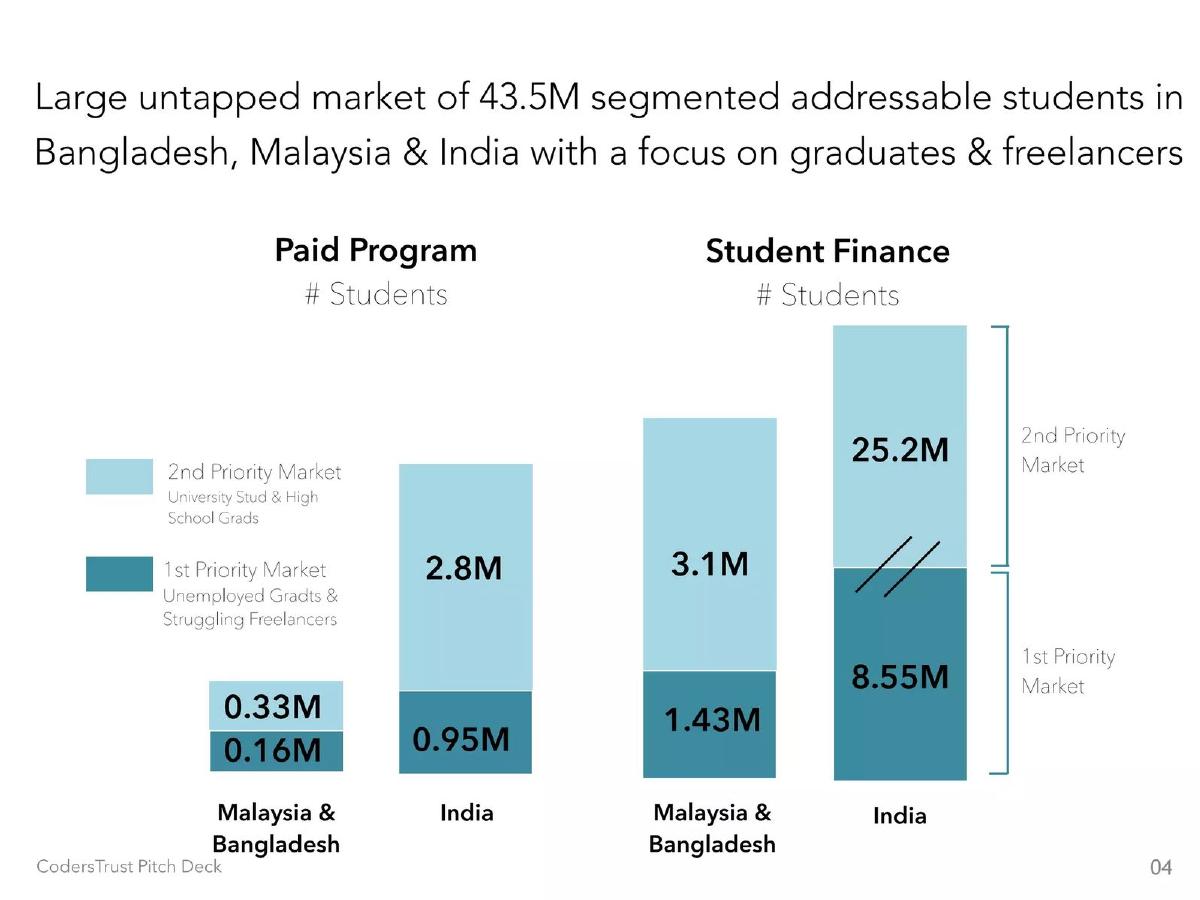
Evidence and limitation: It splits learners by country, by how they pay (upfront or financed) and by priority. It counts students but gives no price, so there is no revenue figure, and names no source.
What a founder can adapt: "First: [N] [segment] in [country], paying [how]. Then [M] [segment]."
Supporting analysis
What the deck claims: "Large untapped market of 43.5M segmented addressable students in Bangladesh, Malaysia & India with a focus on graduates & freelancers." "Paid Program # Students": Malaysia & Bangladesh 0.16M / 0.33M, India 0.95M / 2.8M. "Student Finance # Students": Malaysia & Bangladesh 1.43M / 3.1M, India 8.55M / 25.2M. "1st Priority Market: Unemployed Gradts & Struggling Freelancers"; "2nd Priority Market: University Stud & High School Grads."
Presentation choice: Investors can see which group comes first and how each pays.
Online coding bootcamp for people on the autism spectrum, US.
Coding Autism deck, slide 10. Exact stored slide matched to this analysis.
Our analysis: Category size plus the population served, with a target.
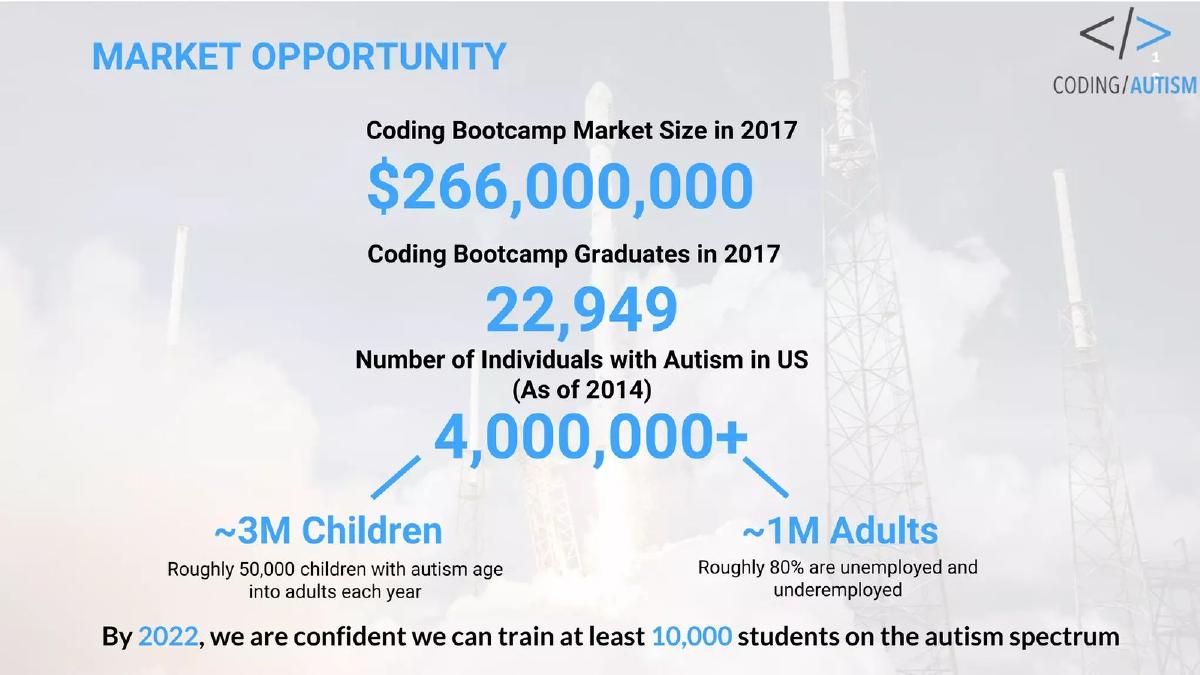
Evidence and limitation: It pairs the category's spend and graduate count with the population it serves, and states a five-year student target. It doesn't connect the two: how many of the 1M adults could pay bootcamp prices, or what 10,000 students would earn.
What a founder can adapt: "[Category] $[X] ([source]). Our learners: [N]. Target [M] × $[price] by [year]."
Supporting analysis
What the deck claims: "Market Opportunity." "Coding Bootcamp Market Size in 2017 $266,000,000." "Coding Bootcamp Graduates in 2017 22,949." "Number of Individuals with Autism in US (As of 2014) 4,000,000+": "~3M Children" ("Roughly 50,000 children with autism age into adults each year"), "~1M Adults" ("Roughly 80% are unemployed and underemployed"). "By 2022, we are confident we can train at least 10,000 students on the autism spectrum."
Presentation choice: Investors see both the category and the specific learner group.
When it does not fit: Leaving the category and population unconnected.
Accredited online university for applied sciences.
Tomorrow University deck, slide 8. Exact stored slide matched to this analysis.
Our analysis: Global education narrowed to its own category.
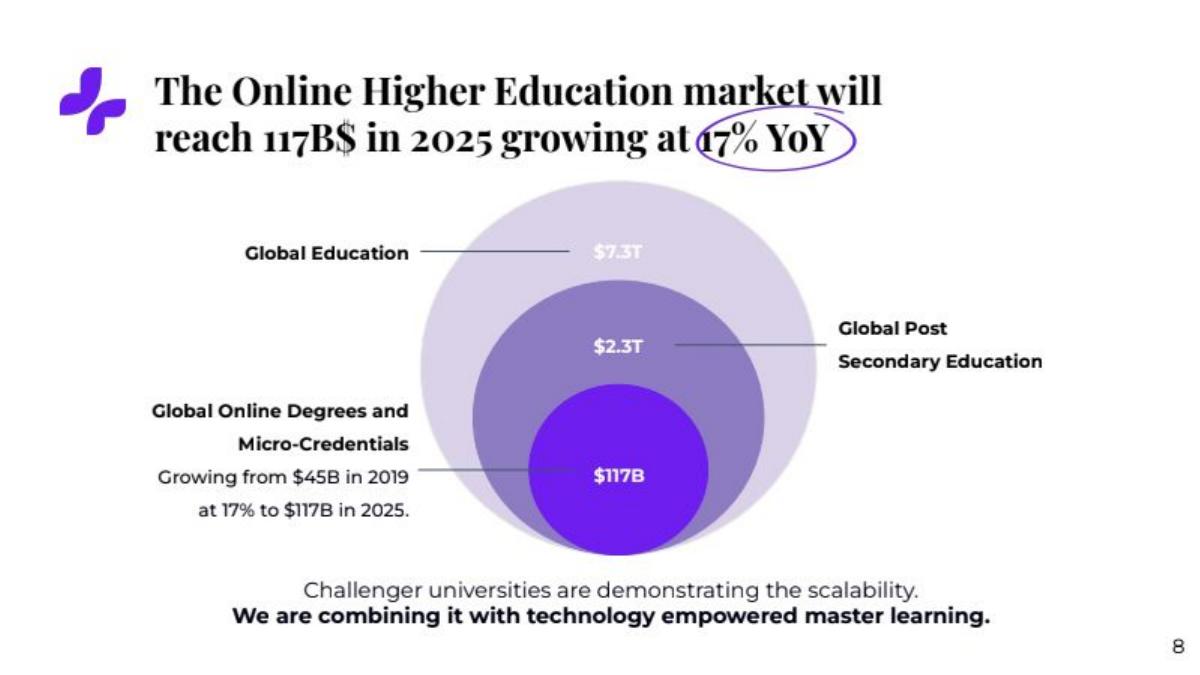
Evidence and limitation: It narrows global education to the online-degrees slice it competes in and gives the growth rate. It names no source and doesn't estimate how many students it could enrol.
What a founder can adapt: "[Category] $[X] in [year], growing [N]% ([source]). Our first programme: [M] students × $[fee]."
Supporting analysis
What the deck claims: "The Online Higher Education market will reach 117B$ in 2025 growing at 17% YoY." Circles: "Global Education $7.3T", "Global Post Secondary Education $2.3T", "Global Online Degrees and Micro-Credentials Growing from $45B in 2019 at 17% to $117B in 2025." "Challenger universities are demonstrating the scalability."
Presentation choice: The narrowing shows which spending the company is after.
When it does not fit: Ending at the category total.
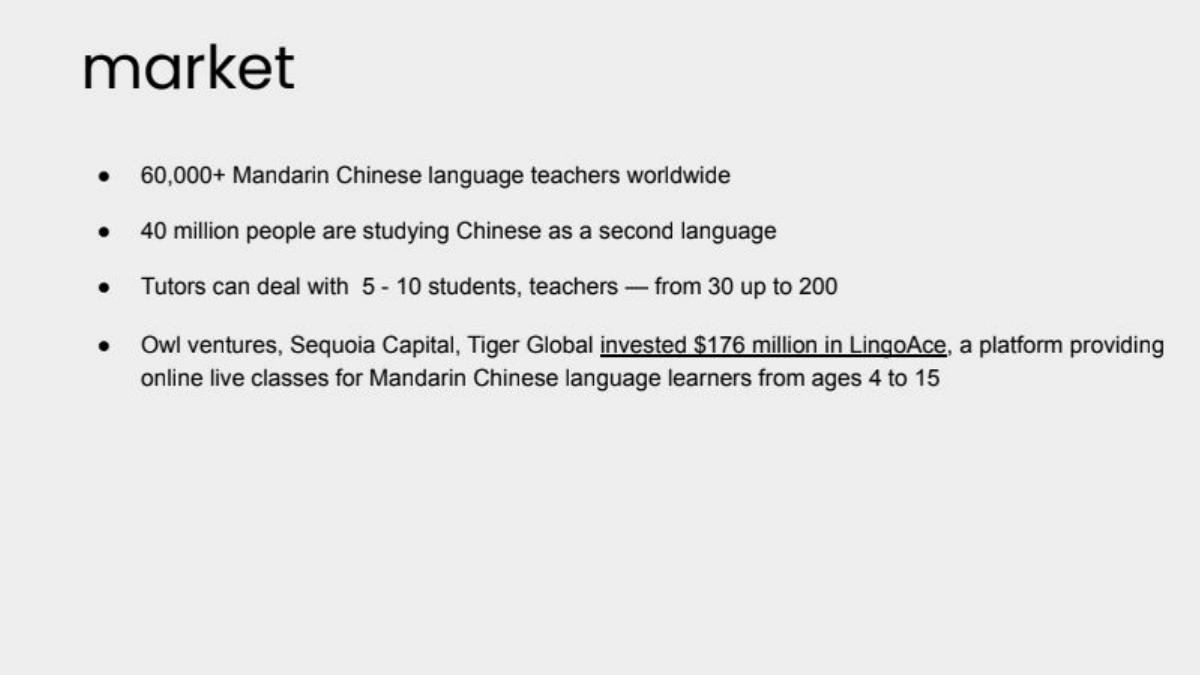
Laoshi deck, slide 3. Exact stored slide matched to this analysis.
Our analysis: Buyer count and learner ratio, no price.
Evidence and limitation: It counts its actual buyer (teachers) as well as learners, and explains the ratio between them. It gives no price per teacher and cites a competitor's funding in place of a market figure.
What a founder can adapt: "[N] [teachers] ([source]) × $[price]/year = $[X]."
Supporting analysis
What the deck claims: "market." "60,000+ Mandarin Chinese language teachers worldwide." "40 million people are studying Chinese as a second language." "Tutors can deal with 5 - 10 students, teachers — from 30 up to 200." "Owl ventures, Sequoia Capital, Tiger Global invested $176 million in LingoAce."
Presentation choice: Counting the buyer, not just learners, fits a teacher tool.
When it does not fit: Using a competitor's round as market size.
International startup-learning trips for Indian students.
Learning While Travelling deck, slide 5. Exact stored slide matched to this analysis.
Our analysis: Events × attendees, no price.
Evidence and limitation: Weaker example. It builds a learner count from events × attendance, which is a bottom-up start, but gives no trip price, conversion rate or source.
What a founder can adapt: "[N] events × [M] attendees × [conversion]% × $[price] = $[X]."
Supporting analysis
What the deck claims: "Market Size." "1000+ startup events spread across PAN India schools & Colleges." "100 participants/event." "Age 15-25 years." "Target audience of one lakh+ startup enthusiasts across whole India."
Presentation choice: A reachable audience helps, but it isn't a market until priced.
Vocational skills training for young people, Nigeria.
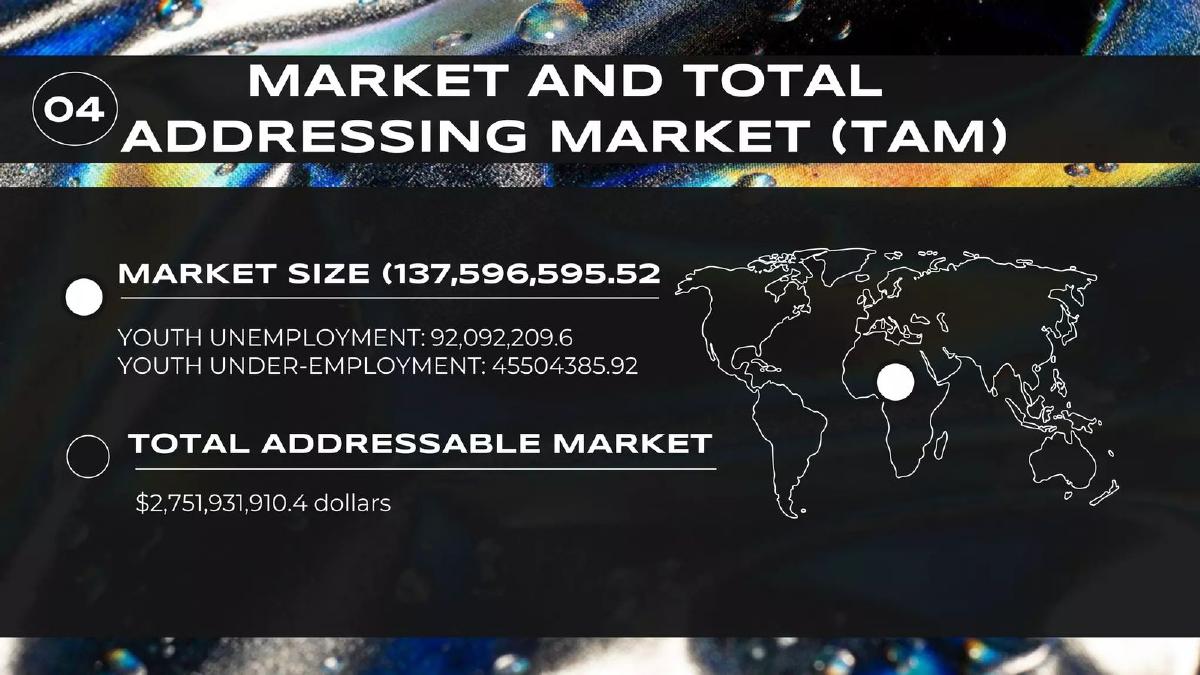
MBE Academy deck, slide 7. Exact stored slide matched to this analysis.
Our analysis: Social need counted, not paying learners.
Evidence and limitation: Weaker example. The total is built from youth unemployment counts, but the slide doesn't say which region, what price produces the dollar figure, or how many unemployed young people would pay for training. Decimal places imply precision the inputs can't have.
What a founder can adapt: "[N] young people in [region] ([source]); payer: [who]; [M] × $[price] = $[X]."
Supporting analysis
What the deck claims: "Market and Total Addressing Market (TAM)." "Market Size (137,596,595.52." "Youth Unemployment: 92,092,209.6." "Youth Under-Employment: 45504385.92." "Total Addressable Market $2,751,931,910.4 dollars."
Presentation choice: Investors need to know who pays for the training.
When it does not fit: False precision and no payer.
After: "[N] unemployed graduates in [state] ([source]); [payer] funds training at $[price]; first year target [M]."
What improved: Our illustrative rewrite of MBE Academy's slide; bracketed text is a placeholder, not company fact.
What's different about edtech market sizing
In education, the person learning is often not the person paying. Schools, employers, governments and lenders all pay for learning, and each has a different budget and sales cycle. A market slide that names the payer and counts only the learners that payer funds is far more credible than a global education total.
What investors check
Whether the count is learners who pay or everyone in the age group. Whether the price is annual, per course or per learner. Whether the first segment and country are named. Whether a category figure (online degrees, bootcamps) is the company's category or a broader one.
How we read each slide
We quote the text on the slide images. We have not checked any market figure or source. Page numbers are pages in the original deck file. Four images were already stored and were checked against the decks; three were rendered from the deck PDFs.
Common mistakes
All students. Count the learners who pay.
No payer. Say whether learners, employers or lenders pay.
Counts with no price. Multiply by what you charge.
False precision. Round, and cite where figures come from.
Diagnostic checklist
Paying learners counted.
Payer named.
Price applied.
Source cited.
Frequently asked questions
How should an edtech startup size its market?
Count the learners or professionals who pay and multiply by your price. Prolaera shows 10M professionals × $1,000 a year = $10B.
Is a global education spending figure useful on a market slide?
Only as a starting point. Tomorrow University narrows $7.3T of global education to the $117B online-degrees category it competes in.
How we chose these examples
Corpus: published pitch deck teardowns on StartupFundraising.com. Founder-uploaded private decks are excluded.
Selection (2026-09-26): we searched education, learning and training teardowns for market size and market opportunity headings, scanned eleven candidate decks around the matching pages, and kept seven.
Excluded: CloudAcademy (cloud computing market, not education), Quambase (mixes LMS and AI markets), Floqq (matching pages were product video frames), Protrainy (market text too sparse to analyse). Teardown text numbering differed from deck-file pages for several decks; pages were matched by eye.
Page numbers are pages in the original deck files. Prolaera, CodersTrust, Laoshi and Learning While Travelling images were already stored and were checked against the decks; the other three were rendered from the deck PDFs. All seven decks were confirmed as published teardowns on 2026-09-26.
Market figures and sources are quoted from the slides and not independently verified.
Review: slide images were checked on 2026-09-26 and matched to company, deck and page (editorial model review). No person has yet completed an editorial review of this page. We make no claim that any slide caused a fundraising outcome.