How real estate and construction startups size their market: the fee pool they take a cut of, not the value of the property.
Proptech Market Slide: Size the Fees, Not the Property
Real estate figures are the biggest numbers a founder can put on a slide: trillions in property value, trillions in annual sales. But a proptech company never earns the value of the building. It earns a fee, a subscription or a share of spend on something around the property: appraisals, title, advertising, fit-out, bookings. The stronger proptech market slides size that fee pool. This guide compares seven real proptech and construction market slides, from a square-foot build-up to a single industry total.
TL;DR
Size the fees or spend your product captures, not the value of the property. Real Matters adds the US appraisal market ($3.2B) to the title and closing market ($13B) for a $16B addressable market, with footnoted sources. Domatic builds $20B from square feet built or renovated each year times revenue per square foot. Buildcon's slide says the construction industry is over $10T without saying what share its software could earn.
Proptech market slides from real pitch decks
Each example shows the slide above its analysis and links to the full teardown. Slides that size a fee pool come first. Claims are as shown on the slides; comments are ours.
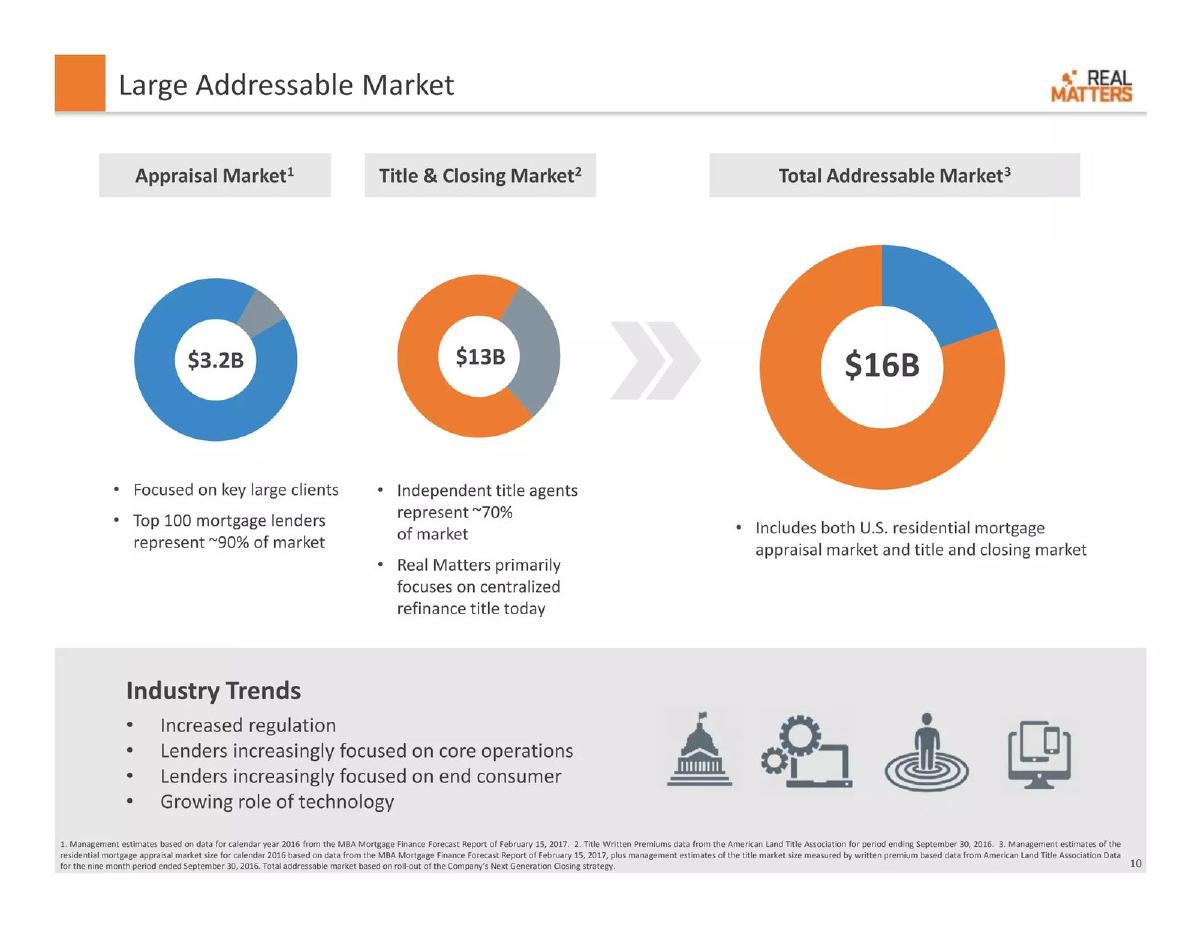
Real Matters market slide — slide 10
Appraisal and title-and-closing services platform for US mortgage lenders.
Real Matters deck, slide 10. Exact stored slide matched to this analysis.
Our analysis: Two fee pools added, sourced, with current focus.
Evidence and limitation: It sizes the two service fee pools it sells into, adds them, and footnotes each source. It also says which part of each market it serves today.
What a founder can adapt: "[Service A] $[X] + [Service B] $[Y] = $[Z] ([sources]). Today we serve [slice]."
Supporting analysis
What the deck claims: "Large Addressable Market." "Appraisal Market $3.2B": "Focused on key large clients", "Top 100 mortgage lenders represent ~90% of market." "Title & Closing Market $13B": "Independent title agents represent ~70% of market", "Real Matters primarily focuses on centralized refinance title today." "Total Addressable Market $16B": "Includes both U.S. residential mortgage appraisal market and title and closing market." Footnotes cite MBA Mortgage Finance Forecast and American Land Title Association data.
Presentation choice: Investors see exactly which fees the company earns.
When it does not fit: Using mortgage volume instead of fees.
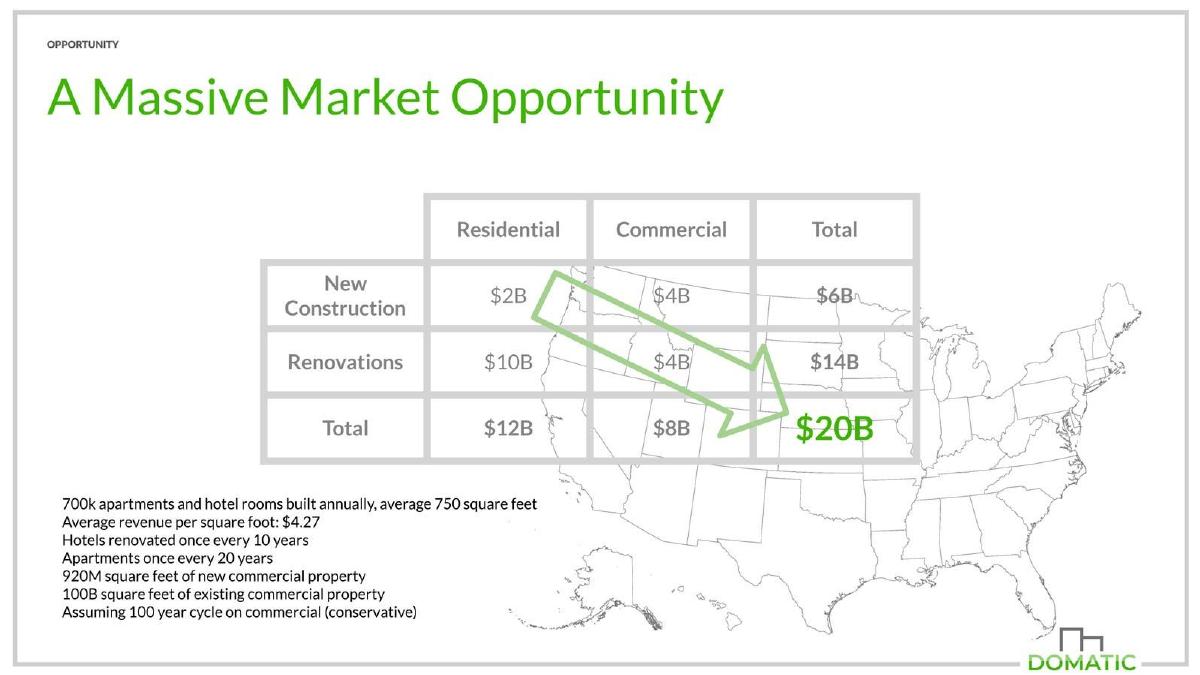
Domatic deck, slide 8. Exact stored slide matched to this analysis.
Our analysis: Square feet per year × revenue per square foot.
Evidence and limitation: It builds the market from square feet built or renovated each year times its own revenue per square foot, and prints every assumption. It gives no source for the square-foot figures.
What a founder can adapt: "[N] sq ft built/renovated per year × $[revenue]/sq ft = $[X]. Assumptions: [list]."
Supporting analysis
What the deck claims: "A Massive Market Opportunity." Table: New Construction residential $2B, commercial $4B, total $6B; Renovations residential $10B, commercial $4B, total $14B; Total $12B, $8B, "$20B". Assumptions: "700k apartments and hotel rooms built annually, average 750 square feet", "Average revenue per square foot: $4.27", "Hotels renovated once every 10 years", "Apartments once every 20 years", "920M square feet of new commercial property", "100B square feet of existing commercial property", "Assuming 100 year cycle on commercial (conservative)."
Presentation choice: Every cell can be recomputed from the listed assumptions.
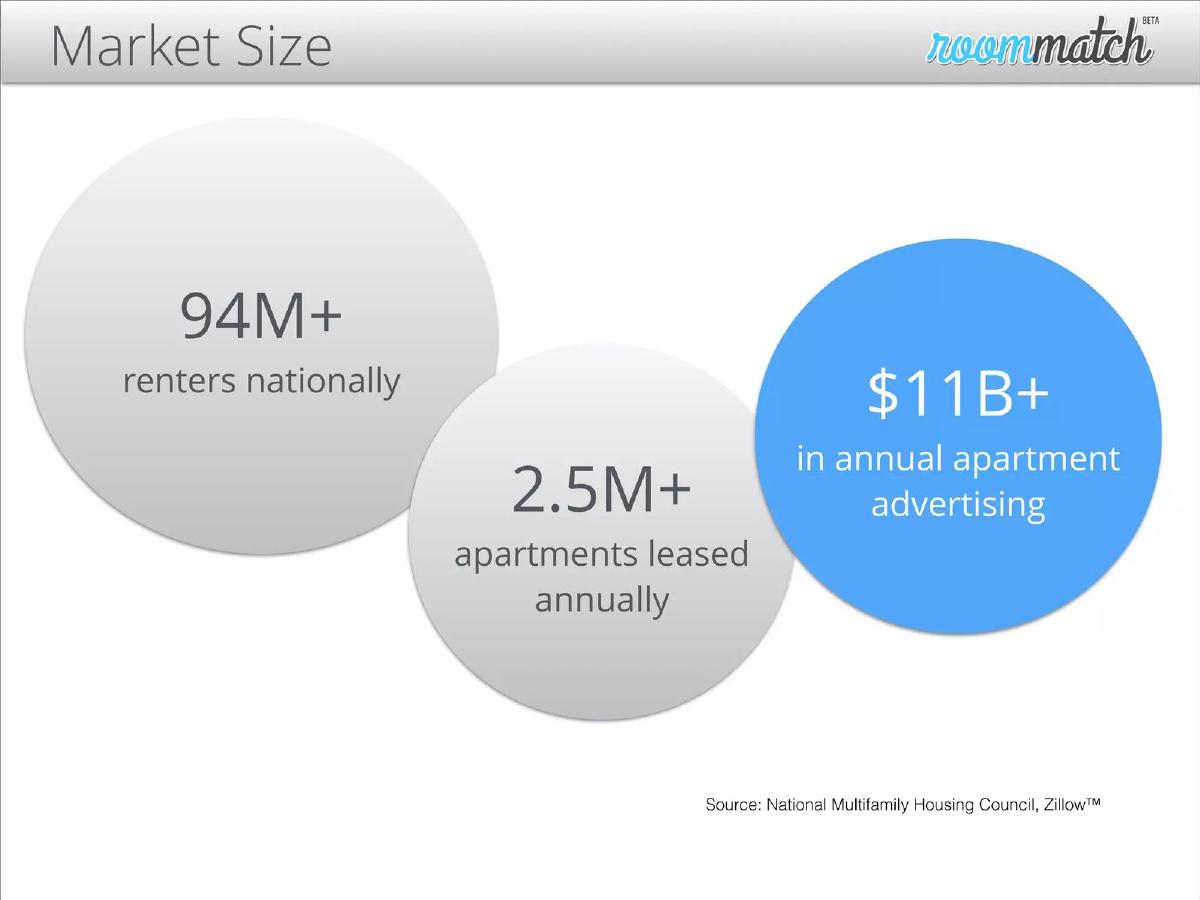
RoomMatch deck, slide 7. Exact stored slide matched to this analysis.
Our analysis: Renters → leases → the ad spend it competes for.
Evidence and limitation: It moves from renters to annual leases to the advertising spend landlords pay, which is the budget the company competes for, and names its sources. It doesn't say what share of that spend it expects.
What a founder can adapt: "[N] [transactions]/year; [payers] spend $[X] on [budget] ([source])."
Supporting analysis
What the deck claims: "Market Size." "94M+ renters nationally." "2.5M+ apartments leased annually." "$11B+ in annual apartment advertising." "Source: National Multifamily Housing Council, Zillow."
Presentation choice: Ending on landlord ad spend points to the company's revenue.
Recommendation engine for real estate, starting with vacation rentals.
Smart Host deck, slide 3. Exact stored slide matched to this analysis.
Our analysis: First vertical named, then expansion, but in volumes.
Evidence and limitation: It names its first vertical and shows the larger verticals it could expand into. The figures are booking and sales volumes, not the fees a recommendation engine would earn, and there is no source.
What a founder can adapt: "First: [vertical] $[volume] → [fee]% = $[X]. Later: [verticals]."
Supporting analysis
What the deck claims: "Our first vertical is vacation rentals." "70% of vacation rental bookings happen via phone call or email. The hosts are the only ones with this fragmented data." Bars: "$85 billion Vacation Rentals", "$473 billion Apartment Rentals", "$12.1 trillion Residential Sales."
Presentation choice: Investors see where it starts and where it could go.
When it does not fit: Quoting sales volume as your market.
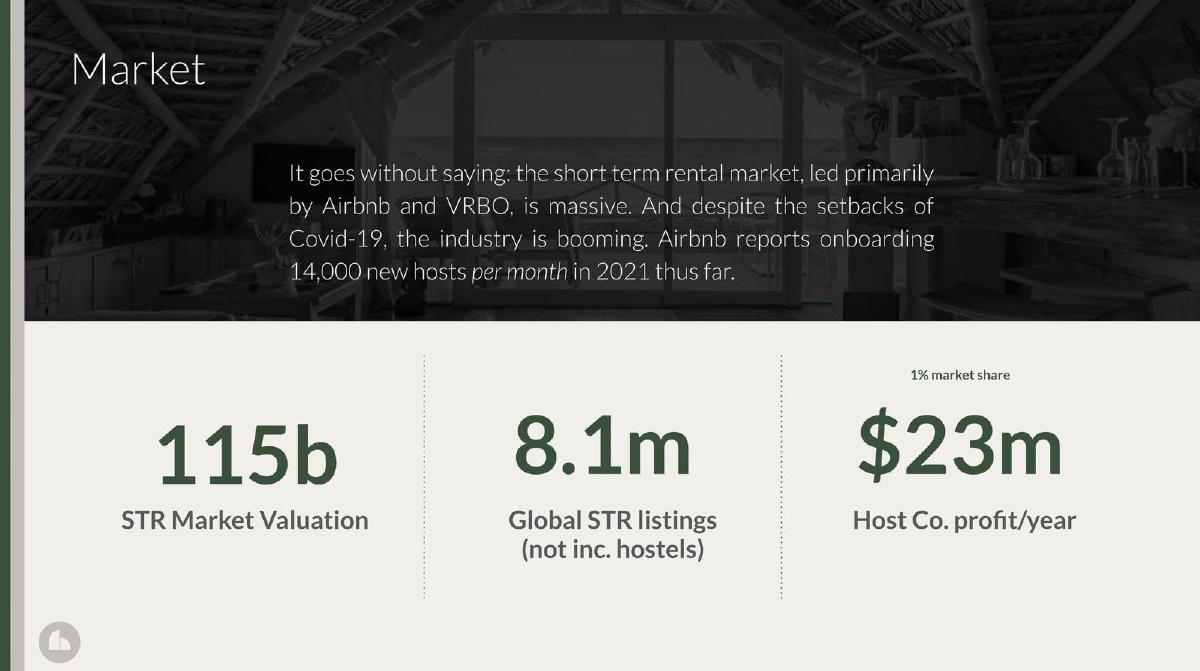
Evidence and limitation: It counts listings, the units it serves, and states what a 1% share would earn. It doesn't show how the $23m is calculated from 8.1m listings, and "market valuation" is not a revenue figure.
What a founder can adapt: "[N] listings × [share]% × $[profit per listing] = $[X]."
Supporting analysis
What the deck claims: "Market." "It goes without saying: the short term rental market, led primarily by Airbnb and VRBO, is massive... Airbnb reports onboarding 14,000 new hosts per month in 2021 thus far." "115b STR Market Valuation." "8.1m Global STR listings (not inc. hostels)." "1% market share: $23m Host Co. profit/year."
Presentation choice: A share-to-profit figure invites investors to check it.
When it does not fit: Leaving out the calculation.
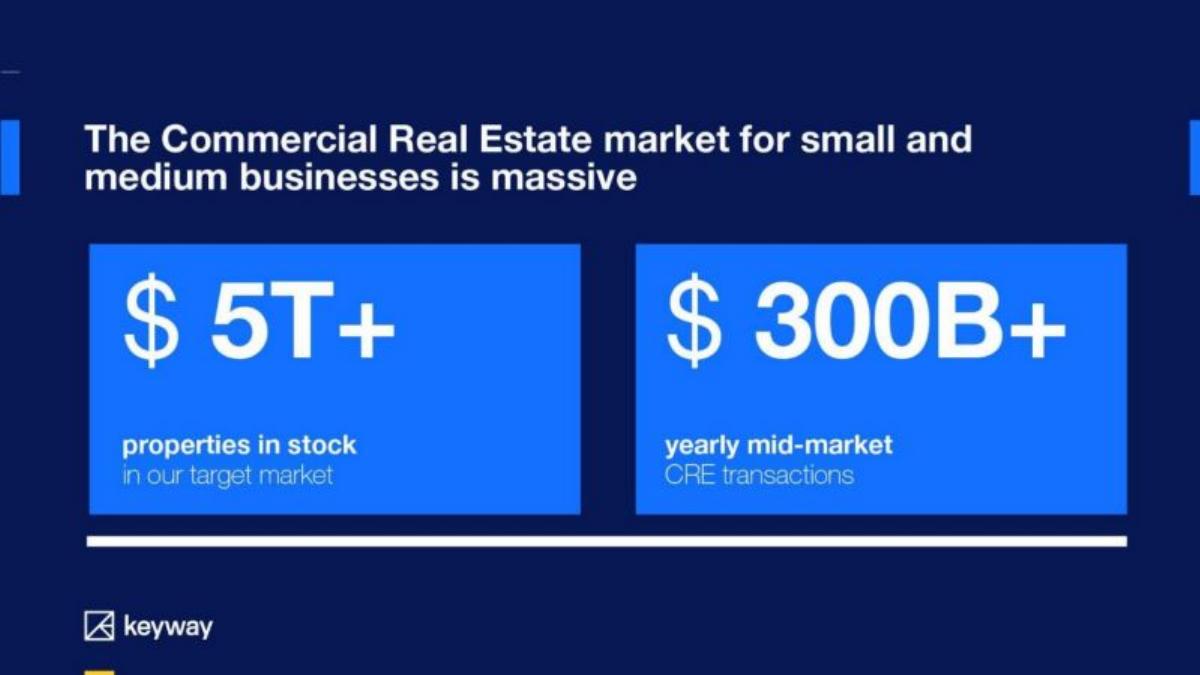
Commercial real estate transactions for small and medium businesses.
Keyway deck, slide 4. Exact stored slide matched to this analysis.
Our analysis: Segment named; asset values, not fees.
Evidence and limitation: It narrows commercial real estate to the small and mid-market segment and separates property stock from yearly transactions. Both are asset values, not the fees or spread Keyway earns, and no source is given.
What a founder can adapt: "$[N] yearly [segment] transactions × [take rate]% = $[X] ([source])."
Supporting analysis
What the deck claims: "The Commercial Real Estate market for small and medium businesses is massive." "$5T+ properties in stock in our target market." "$300B+ yearly mid-market CRE transactions."
Presentation choice: Annual transactions are closer to revenue than stock, but still not revenue.
When it does not fit: Property stock as a market size.
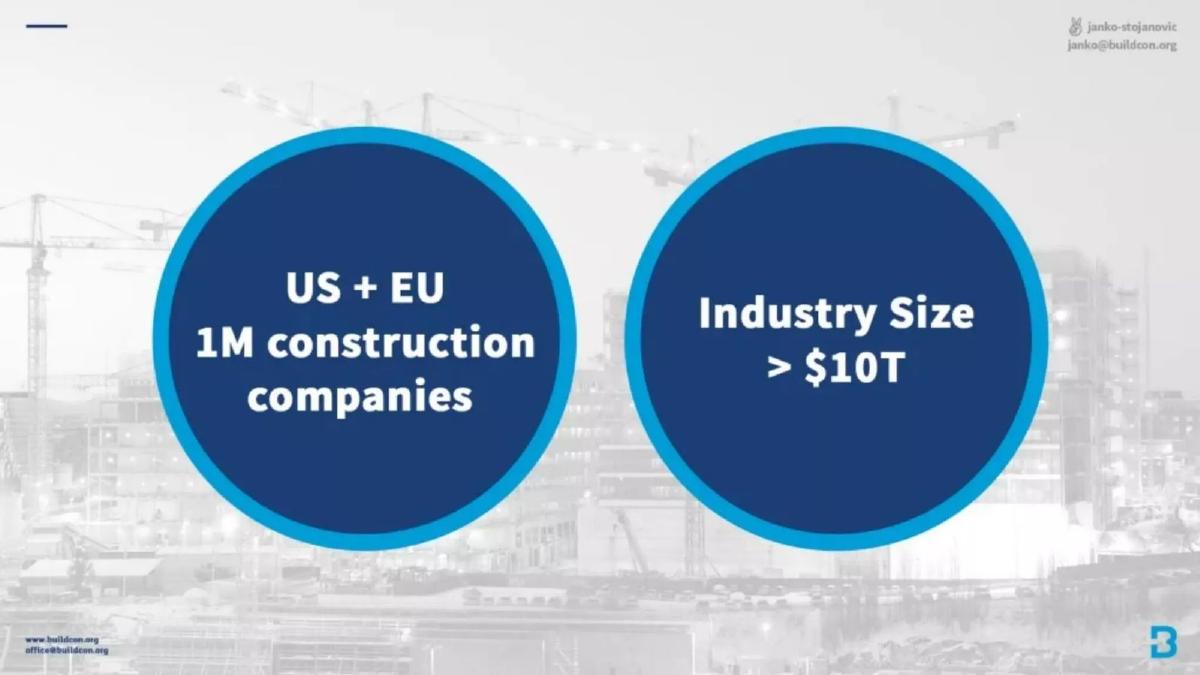
Buildcon deck, slide 7. Exact stored slide matched to this analysis.
Our analysis: Right unit, wrong dollar figure.
Evidence and limitation: Weaker example. The company count is the right unit for software, but the slide pairs it with total construction output rather than a price per company, and gives no source.
What a founder can adapt: "[N] construction companies in [region] × $[price]/year = $[X] ([source])."
Supporting analysis
What the deck claims: "US + EU 1M construction companies." "Industry Size > $10T."
Presentation choice: Investors need companies × subscription price.
When it does not fit: Industry output as a software market.
Which kind of proptech market slide answers which question.
Approach
Example
Answers
Leaves open
Fee pools added, sourced
Real Matters
Which fees it earns
Share target
Square feet × revenue per sq ft
Domatic
Recomputable total
Source
Renters → ad spend
RoomMatch
Budget it competes for
Share
First vertical + expansion
Smart Host
Where it starts
Fees, source
Listings + share outcome
The Host Co
Units served
Calculation
Segment asset values
Keyway
Which segment
Take rate
Company count + industry output
Buildcon
Right unit
Price, source
Key Takeaways
Size the fee pool, not property value.
Name the transaction or spend you take a cut of.
Show units × price when you can.
Separate your first vertical from the rest.
Cite the source.
Write your proptech market slide
Answer these before you design the slide.
Spend. Which fee, commission or budget do you take a share of?
Unit. What do you count: transactions, listings, square feet, companies?
Price. What do you earn per unit, or what is your take rate?
Source. Where do the figures come from, and what year?
Copyable framework: [N] [units] per year × $[price or fee] = $[X] ([source]). First vertical: [where].
Illustrative example 1 — written by us
Before: "US + EU 1M construction companies." "Industry Size > $10T."
After: "[N] contractors in [first country] × $[price]/year = $[X] ([source]). Then US + EU: 1M companies."
What improved: Our illustrative rewrite of Buildcon's slide; bracketed text is a placeholder, not company fact.
What's different about proptech market sizing
Property value, transaction volume and the fees around them differ by orders of magnitude. A $12 trillion residential sales figure might support a few hundred billion in commissions and a few billion in software spend. Investors look for the slide to make that step down explicit, from the asset to the spend the company actually touches.
What investors check
Whether the headline is property value, transaction volume or fees. Whether the fee rate or price per unit is shown. Whether the first vertical or geography is separated from later ones. Whether the figures have sources and dates.
How we read each slide
We quote the text on the slide images. We have not checked any market figure or source. Page numbers are pages in the original deck file. Two images were already stored and were checked against the decks; five were rendered from the deck PDFs.
Common mistakes
Property value as market. Size the fees you earn.
Sales volume as market. Apply your take rate.
Hidden maths. Show units × price.
No source. Cite each figure.
Diagnostic checklist
Fee pool or budget named.
Units and price shown.
First vertical separated.
Sources cited.
Frequently asked questions
How should a proptech startup size its market?
Size the fees or spend you capture, not property value. Real Matters adds the $3.2B appraisal and $13B title-and-closing markets for $16B.
Can I use total real estate value on my market slide?
Only as context. Keyway's $5T property stock and Smart Host's $12.1T residential sales are asset values; investors will ask what share becomes revenue.
How we chose these examples
Corpus: published pitch deck teardowns on StartupFundraising.com. Founder-uploaded private decks are excluded.
Selection (2026-09-26): we searched real estate, property, rental and construction teardowns for market size and market opportunity headings, scanned twelve candidate decks around the matching pages, and kept seven.
Excluded: Vizcab (market figures are placeholders on the slide), Bespoke Habitat and Wreno (matching pages are not market sizing), Guest House (dark pages without market figures), OneStockHome (deck file unavailable). Smart Host's market slide is deck-file page 3; pages were matched by eye.
Page numbers are pages in the original deck files. Keyway and Smart Host images were already stored and were checked against the decks; the other five were rendered from the deck PDFs. All seven decks were confirmed as published teardowns on 2026-09-26.
Market figures and sources are quoted from the slides and not independently verified.
Review: slide images were checked on 2026-09-26 and matched to company, deck and page (editorial model review). No person has yet completed an editorial review of this page. We make no claim that any slide caused a fundraising outcome.