The May 2015 Summer Infant investor presentation serves as a roadmap for a company in transition. Facing a net loss of $242,000 for the quarter ending April 4, 2015, the management team presented a strategy centered on 'Earnings Expansion' and 'Channel Diversification.' The deck highlights significant growth in specific product lines, such as a 51% increase in Gear (3D Lite Strollers), while simultaneously reporting a reduction in reliance on top customers. By emphasizing new product development—which accounts for at least 20% of annual revenue—and a 40% year-over-year increase in e-commerce,…
Key takeaways
- The company reported a net loss of $242,000 for the three months ending April 4, 2015, compared to a $189,000 profit in the prior year period (Slide 11).
- New product introductions are a critical growth driver, representing at least 20% of annual revenue (Slide 7).
- The 'Gear' category saw the most significant growth at +51%, driven by the 3D Lite Strollers (Slide 5).
- E-commerce is a primary focus area, showing 40% year-over-year growth and accounting for 20% of 2014 sales (Slide 7).
- The company is actively reducing its reliance on licensed brands to focus on higher-profit owned brands like Summer, SwaddleMe, and Born Free (Slide 7).
- Customer concentration is slowly decreasing, with the top 7 customers representing 74% of sales in 2014, down from 78% in 2013 (Slide 7).
- Adjusted EBITDA fell from $3.75 million in Q1 2014 to $2.57 million in Q1 2015 (Slide 13).
- The deck identifies Millennial parents with higher disposable income as a key positive industry dynamic (Slide 3).
Executive Summary: The Turnaround Narrative
The Summer Infant investor presentation from May 2015 is a study in corporate stabilization. Rather than a seed-stage pitch for capital, this deck functions as a progress report for a public or late-stage entity attempting to navigate a changing retail landscape. The narrative arc moves from 'Investor Highlights' (the promise) to 'Recent Financials' (the reality), concluding with a summary of 2015 as a 'Year of Stability.' The company leans heavily on its owned brands—Summer, SwaddleMe, and Born Free—to distance itself from lower-margin licensing deals that previously weighed down the balance sheet.
Slide 1: Title Slide
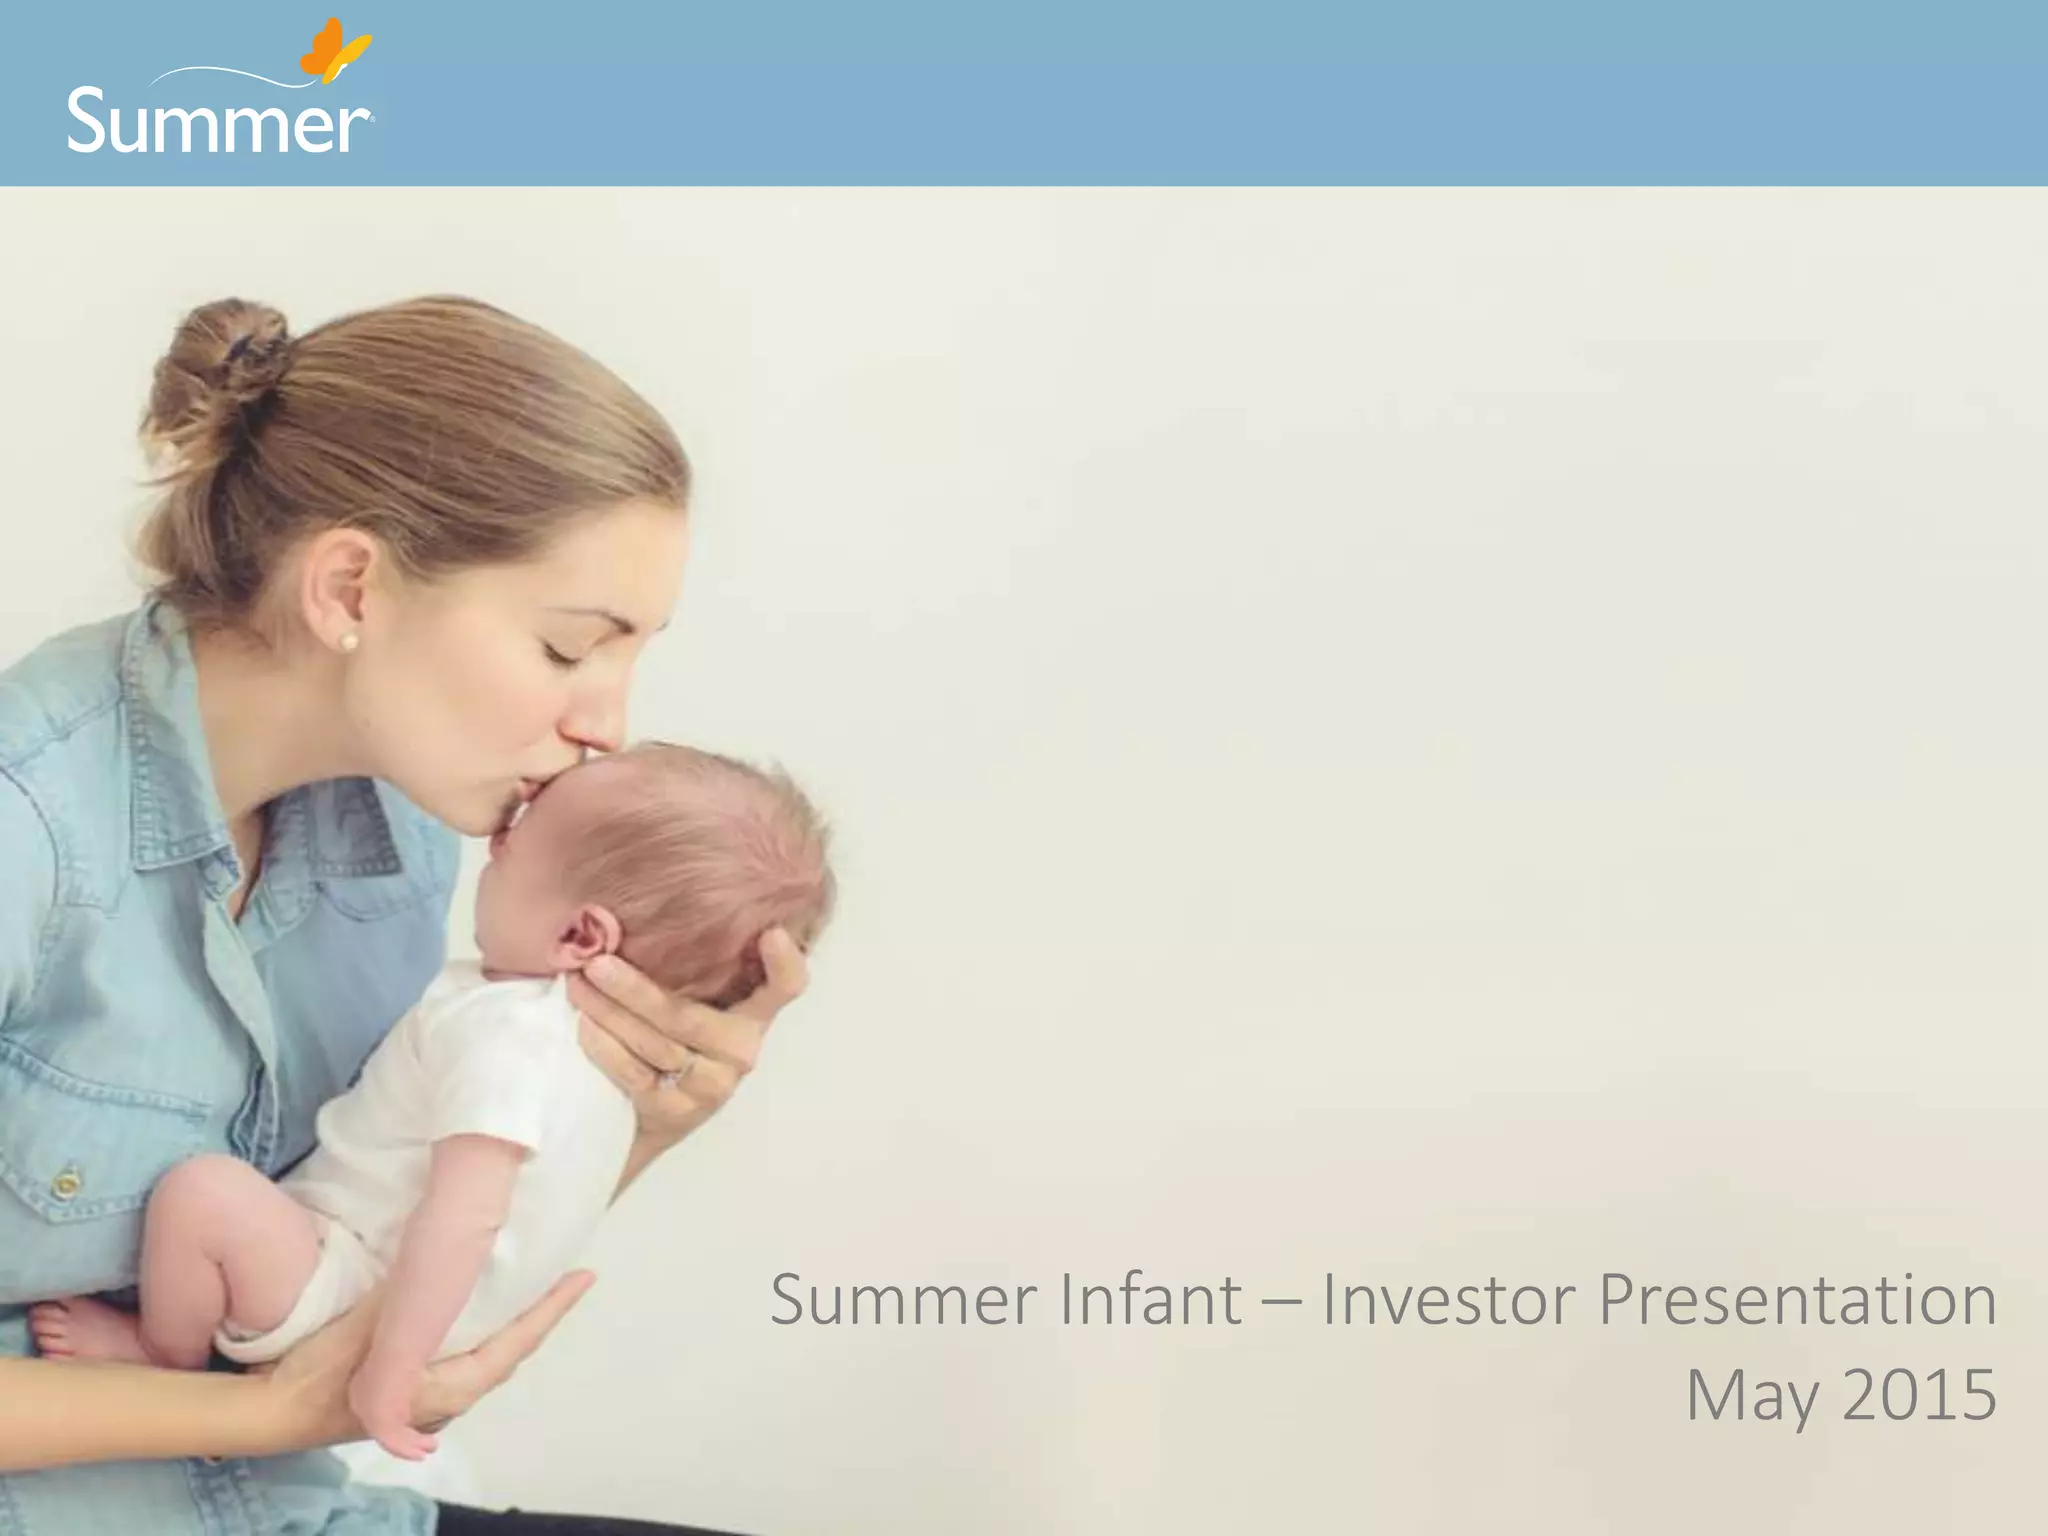
The presentation opens with a minimalist title slide featuring the Summer logo and a high-quality lifestyle image of a mother and infant. The branding is soft and approachable, consistent with the juvenile products sector. The date 'May 2015' establishes the context of the data that follows.
Slide 3: Investor Highlights
This slide serves as the 'Why Now' and 'Executive Summary' combined. It identifies five pillars of the investment thesis: Leading provider of juvenile products , Positive industry dynamics (specifically citing Millennial parents), New management , Expanding revenue potential , and Earnings expansion . Notably, the slide mentions a focus on 'reducing debt' and 'exiting poorly performing products,' signaling to investors that the company is in a restructuring phase.
Slide 5: Product Priorities
Slide 5 provides a visual roadmap of the product lifecycle, moving from Monitors to Nursery, Feeding, Safety, and 'On-the-Go' (Gear). The company highlights specific growth metrics for each category: Monitors +4% , SwaddleMe +10% , Safety +5% , and a standout +51% growth in Gear attributed to the 3D Lite Strollers. This slide effectively demonstrates that while the company as a whole faces headwinds, specific product innovations are gaining significant market traction.
Slide 7: Focus on Core Brands & Channel Diversification
This is arguably the most data-dense slide in the deck. It utilizes a bar chart to show the decline of 'Licensed Brands' and 'Private Label' revenue in favor of 'Summer Owned Brands.' A pie chart breaks down 2014 Sales by Channel, showing a healthy spread: Baby Specialty (28%) , Mass (21%) , E-Commerce (20%) , and International (16%) . The bullet points emphasize that e-commerce is up 40% year-over-year, which was a critical metric for traditional consumer packaged goods (CPG) companies in 2015.
Slide 9: Expanding Digital Strategy
To support the e-commerce growth claims, Slide 9 showcases tactical executions. It includes screenshots of video content, email blasts, social media sweepstakes, and online reviews. The inclusion of five-star review snippets ('Better than the pack and play!') is intended to prove consumer sentiment and brand equity in a digital environment.
Slide 11: Recent Financials
The 'Recent Financials' slide presents a challenging quarter. For the three months ending April 4, 2015, net sales were $53,013,000 , up from $50,814,000 the previous year. However, the company swung from a $189,000 net income in 2014 to a $242,000 net loss in 2015. The bottom banner attempts to soften this blow by highlighting that 'Core Product Sales' were actually up 12.9% year-over-year, suggesting that the loss was driven by non-core segments or restructuring costs.
Slide 13: Adjusted EBITDA & EPS Reconciliation
This slide provides the necessary accounting adjustments to show 'Adjusted EBITDA.' The company reports an Adjusted EBITDA of $2,570,000 for the quarter, down from $3,755,000 in the prior year. The reconciliation includes 'permitted add-backs' of $599,000, which are often used in turnaround decks to show what earnings would look like without one-time restructuring expenses.
Slide 15: Investor Highlights (Summary)
Slide 15 repeats the core themes of the presentation: experienced management, leading design, and strong brands. It explicitly labels 2015 as a 'Year of Stability & Earnings & Balance sheet Improvement.' This repetition is a classic investor relations tactic to ensure the 'Turnaround' message is the final takeaway.
Slide 17: Conclusion
The deck ends with a 'Thank you' slide featuring another lifestyle image of a child. It includes a footer stating 'Confidential Information Summer Infant – Do Not Distribute,' though the source listing indicates this was a public-facing investor presentation.
What Summer Infant Does Well
The deck is exceptionally clear about its segmentation . By breaking down growth by product category (Slide 5) and revenue by brand type (Slide 7), the management team makes it easy for investors to see where the business is winning (Gear and Owned Brands) and where it is intentionally shrinking (Licensed Brands). The emphasis on e-commerce growth (40% YoY) was highly relevant for the 2015 market and showed that the company was adapting to the decline of traditional 'Mass' retail.
What is Missing from the Deck
The most glaring omission is a detailed Team slide . While 'New Management' is mentioned as a highlight on Slide 3, there are no bios, names, or track records provided in the reviewed slides. For a turnaround story, the pedigree of the leadership team is usually the most important factor. Additionally, there is no specific 'Ask' . We do not know if the company is looking for a specific amount of capital, a debt restructuring, or simply providing a quarterly update to existing shareholders. Finally, there is a lack of competitive analysis ; the deck assumes the 'Summer' brand is well-known but does not show how it stacks up against competitors like Graco or Chicco in terms of market share.
Founder Takeaways: What to Copy
Visualizing the Mix: Use Slide 7 as a template for showing how your revenue is shifting from low-margin to high-margin channels. · Product-Level Metrics: If your overall growth is flat, follow Slide 5's lead by highlighting 'pockets of excellence' where specific products are seeing 50%+ growth. · Digital Proof Points: Slide 9 is a great way to show that your marketing isn't just 'spend'—it's an integrated strategy involving reviews, social, and email. · Financial Transparency: Even when the news is bad (a net loss), providing a clear reconciliation to Adjusted EBITDA (Slide 13) shows professional financial management and helps investors understand the underlying health of the operations.
Frequently asked questions
- What is Summer Infant's primary strategy for improving profitability?
- According to Slide 3 and Slide 7, the company is focusing on 'Earnings Expansion' by exiting poorly performing licensed products and focusing on high-margin owned categories. They are also streamlining operations and implementing more effective pricing strategies to offset rising costs.
- How does the company view its competitive advantage in product development?
- Slide 5 and Slide 7 highlight a 'Demonstrated Strength in New Product Development.' The company claims that new products account for at least 20% of their annual revenue, with specific success in the Gear (+51%) and SwaddleMe (+10%) categories.
- What does the sales channel mix look like for Summer Infant?
- As of 2014, the sales mix was dominated by Baby Specialty stores (28%), followed by Mass retail (21%) and E-Commerce (20%). International sales accounted for 16%, while other channels like Discount/Outlet and Department stores made up the remainder (Slide 7).
- Why did the company report a net loss despite sales growth?
- Slide 11 shows that while net sales grew from $50.8 million to $53.0 million, operating income dropped significantly. This was driven by increased Cost of Goods Sold (COGS) and higher General and Administrative (G&A) expenses, which rose by nearly $1 million year-over-year.
- What specific digital strategies are being employed?
- Slide 9 details a 'Digital Strategy' involving video content for social media and retailer sites, email marketing to 'Summer Circle' subscribers, social media sweepstakes, and active seeding of online reviews to drive e-commerce growth.