Revenue Mix on a Pitch Deck: Do the Streams Add Up
How startups show revenue mix on a pitch deck: splits by product, channel, region and customer type.
How to Show Your Revenue Mix on a Pitch Deck So the Split Can Be Checked
Fifteen slides from real pitch decks that split revenue into parts: by product line, by sales channel, by region, by customer type, by old and new plan. For each, we record what the split is measured on (revenue, orders, recurring revenue or customers), whether the parts add to the whole, what period it covers, and whether the headline matches the chart underneath.
TL;DR
A revenue mix slide shows where the money comes from. It answers questions a single revenue figure cannot: does the business depend on one product, one channel, one country or one type of customer, and is that changing? A credible split states its base (revenue, not orders or users), covers a named period, adds to 100%, and gives at least one absolute figure so the percentages can be turned back into money. When the headline quotes a share, the chart should show the same share.
In this set, Health Cuisine's plan adds up to the euro; Joey York's chair economics reconcile to its revenue range; Rohlik shows how its share of products differs from its share of revenue; Schola ties its plan mix to churn. The problems: Rohlik's category column adds to 105%; Super Coffee's subtitle says 35% of online sales come from Amazon while its own 2020 bar gives about 45%; Glamour Cosmetic titles an order split as a revenue split; Beam's 12% headline sits on a chart of projected recurring revenue; Tstix's actuals are all forecasts and its caption names the wrong second stream; Lago accounts for only 58% of revenue by region; Ethos shows a revenue mix chart with no numbers at all.
Revenue mix slides from real pitch decks
Each example records the exact slide, the split it shows, what it is measured on, and whether the parts reconcile. Checks and implied figures are our calculations.
Health Cuisine business model slide — slide 25
Cookbook publisher. 2012 revenue plan.
Health Cuisine deck, slide 25. Exact stored slide matched to this analysis.
Our analysis: A planned mix where every line adds up.
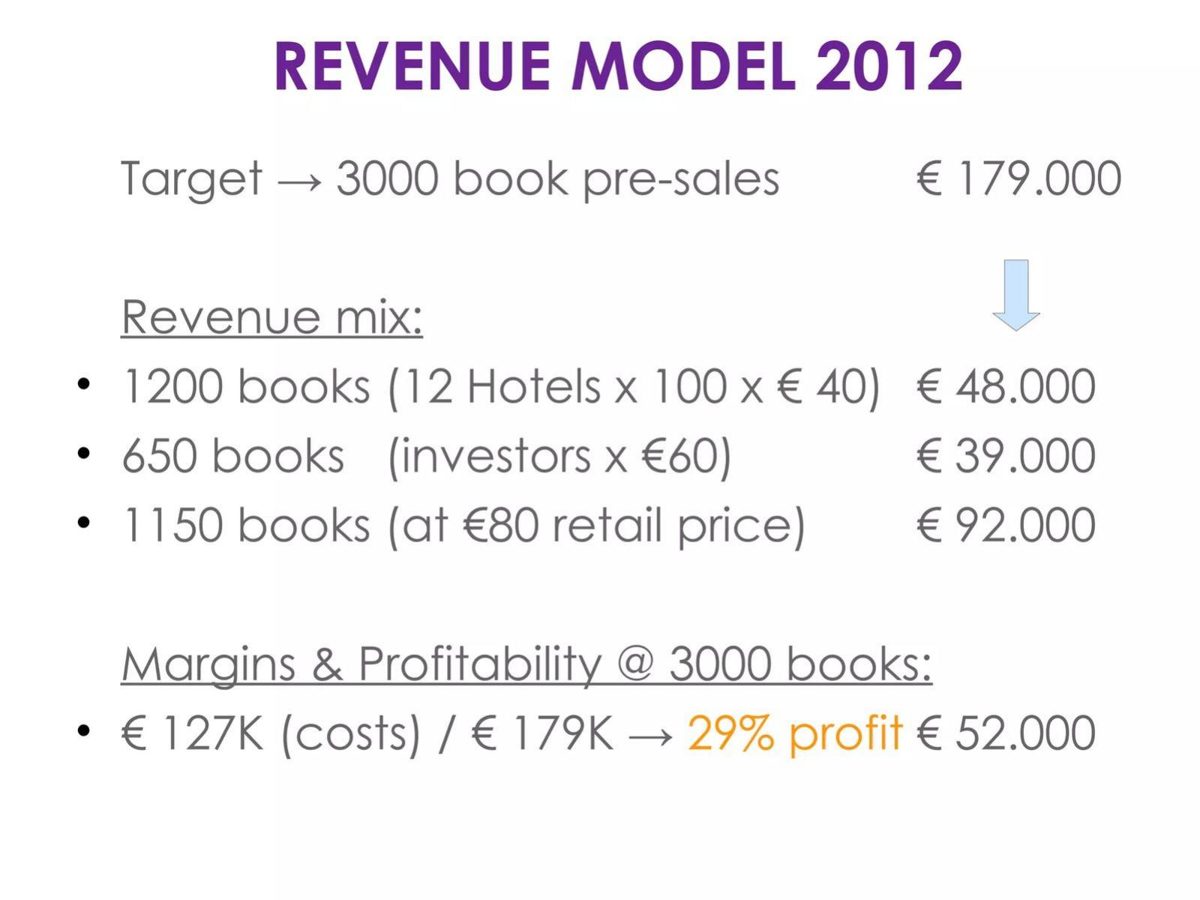
Evidence and limitation: Our checks: books, revenue and profit all reconcile; retail is 38% of books and 51% of revenue.
What a founder can adapt: Show volume, price and amount for each stream.
Supporting analysis
What the deck claims: 3,000 pre-sales target, €179,000: hotels 1,200 books €48,000; investors 650 at €60, €39,000; retail 1,150 at €80, €92,000; costs €127K, profit €52,000 (29%).
Presentation choice: Units, prices and amounts make each share checkable.
When it does not fit: Don't present a target mix as achieved sales.
Joey York deck, slide 10. Exact stored slide matched to this analysis.
Our analysis: Reconciles; 15% of revenue depends on manufacturers.
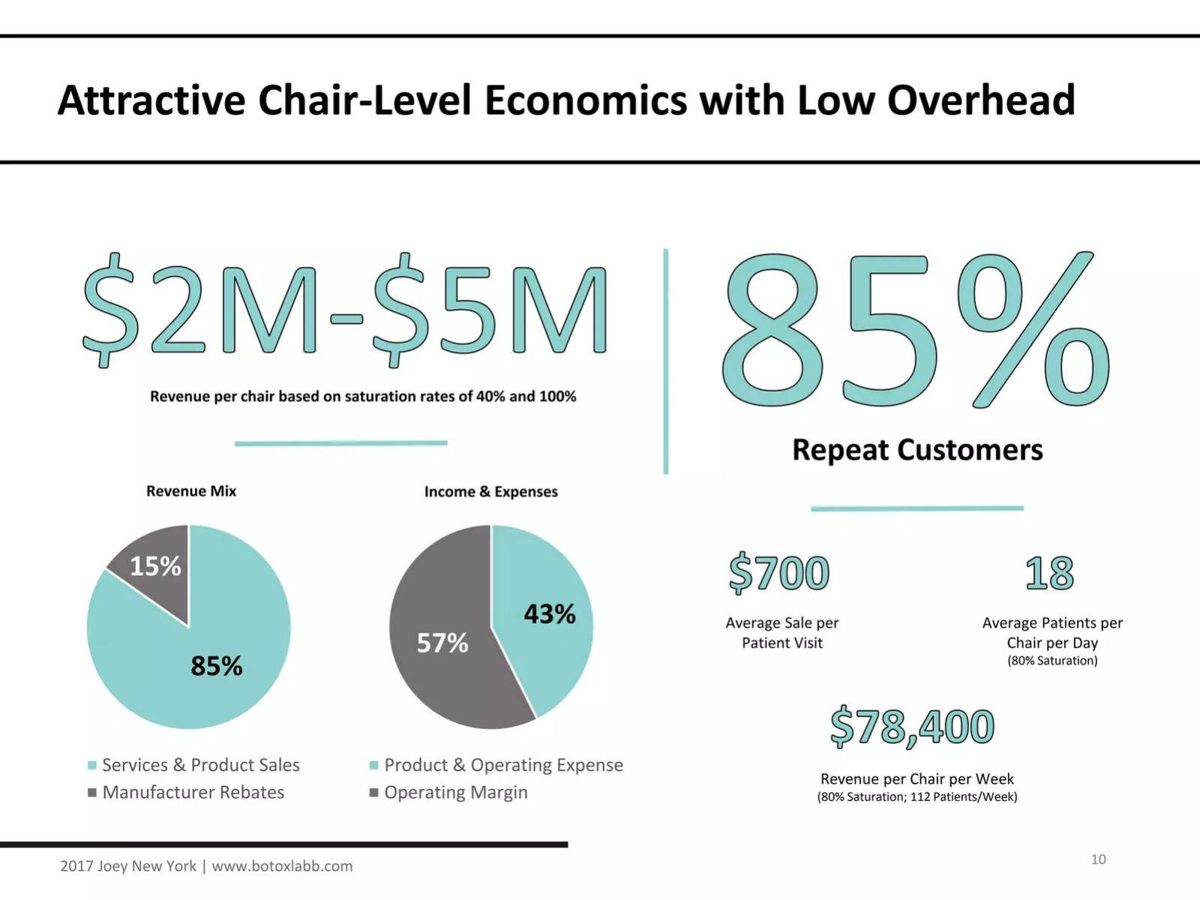
Evidence and limitation: Our checks: 112 × $700 is $78,400; about $4.1M a year at 80%, consistent with the range.
What a founder can adapt: Say how secure the rebate income is.
Supporting analysis
What the deck claims: Revenue mix 85% services and product sales, 15% manufacturer rebates; $2M-$5M per chair at 40%-100% saturation; $700 average sale; $78,400 per chair per week at 112 patients.
Presentation choice: The mix exposes a revenue source outside patient spending.
When it does not fit: Don't bury a third-party revenue stream inside a margin.
Titan Labs deck, slide 8. Exact stored slide matched to this analysis.
Our analysis: Clear product split without scale.
Evidence and limitation: Our check: shares add to 99%; no period or total given.
What a founder can adapt: Add the period and total revenue.
Supporting analysis
What the deck claims: 41% of revenue from Perseus streak cameras, 37% from Cronos, 21% from Hyperion comb generators; margins 30-45% in the first three years of production.
Presentation choice: Investors cannot size a slice without a total.
When it does not fit: Don't give shares with no amount anywhere.
Front deck, slide 15. Exact stored slide matched to this analysis.
Our analysis: Diversified by revenue, with bases labelled.
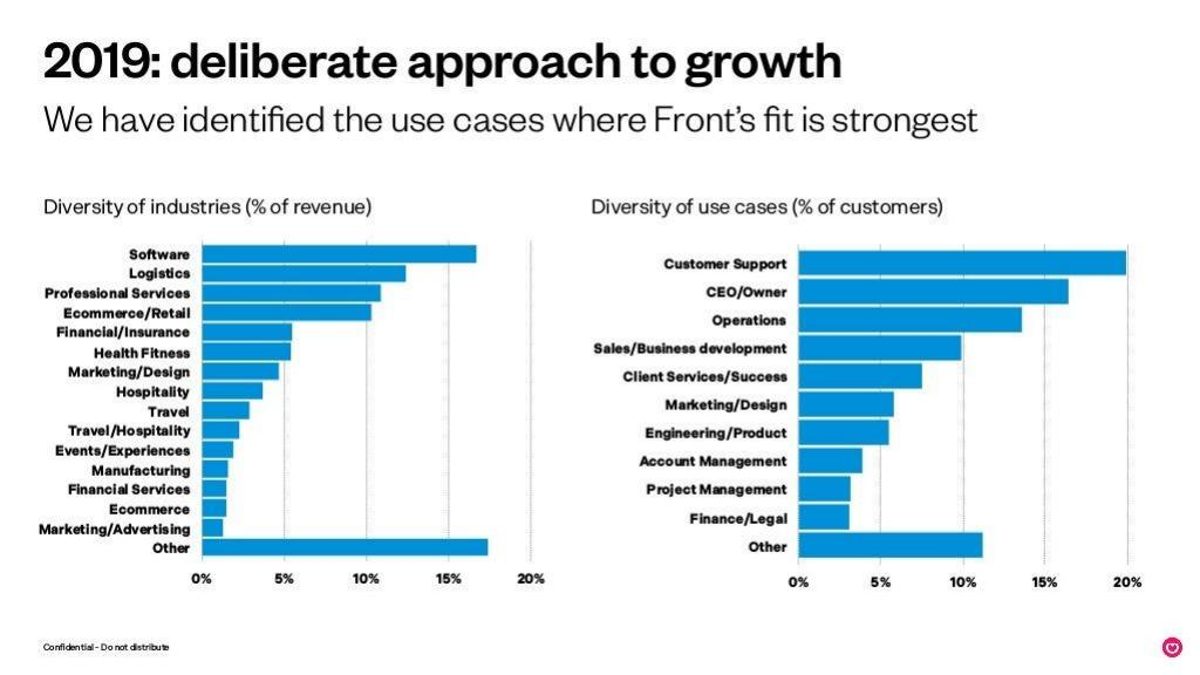
Evidence and limitation: Values read from bars; each chart states its base.
What a founder can adapt: Label the base on every split.
Supporting analysis
What the deck claims: "Diversity of industries (% of revenue)": software about 17%, "Other" slightly larger; "Diversity of use cases (% of customers)": customer support about 20%.
Presentation choice: Revenue and customer splits are kept separate.
When it does not fit: Don't mix revenue and customer shares on one axis.
Rohlik deck, slide 9. Exact stored slide matched to this analysis.
Our analysis: Insightful comparison; one table overshoots.
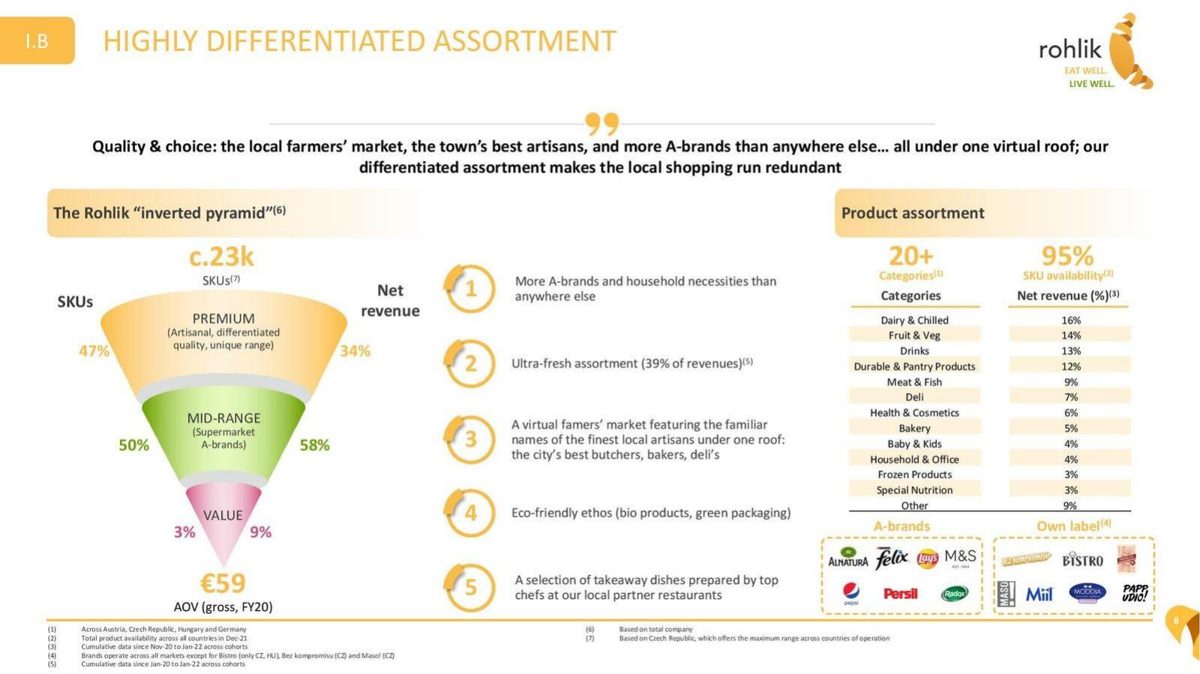
Evidence and limitation: Our checks: pyramid revenue adds to 101%; category column adds to 105%.
What a founder can adapt: Keep the side-by-side; re-total the table.
Supporting analysis
What the deck claims: Products vs net revenue: premium 47% vs 34%, mid-range 50% vs 58%, value 3% vs 9%; 13 categories from dairy 16% to other 9%; ultra-fresh 39% of revenues.
Presentation choice: Products vs revenue shows where money concentrates.
When it does not fit: Don't publish a split over 100%.
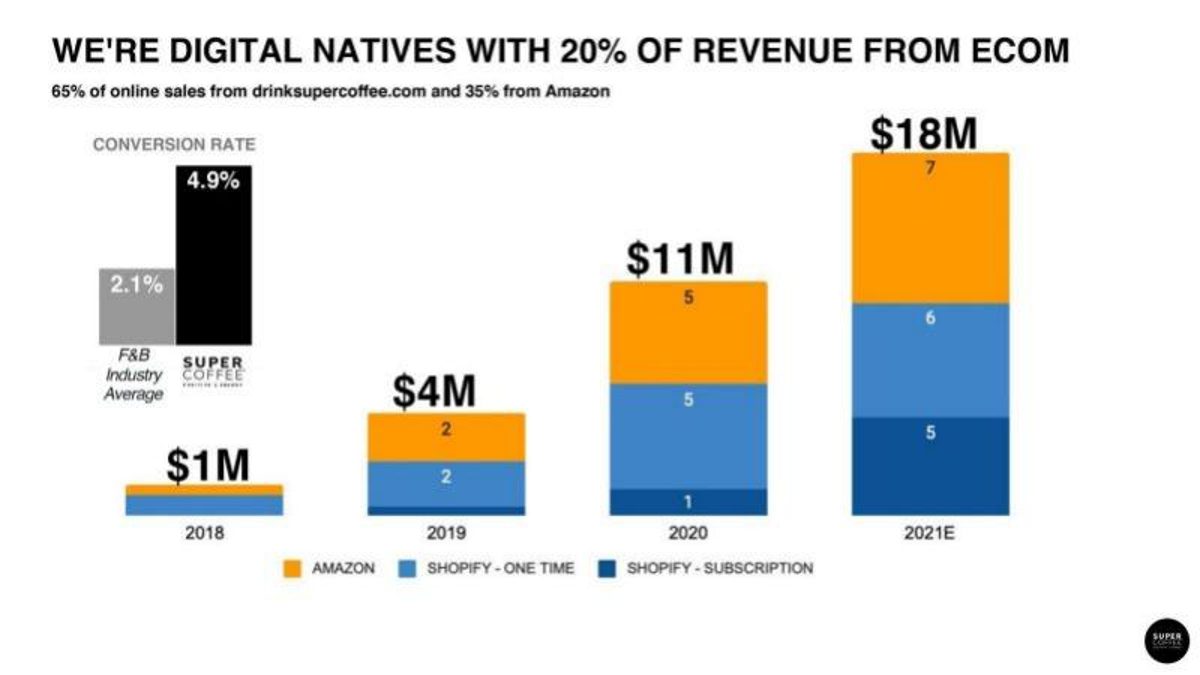
Super Coffee deck, slide 27. Exact stored slide matched to this analysis.
Our analysis: Useful chart; subtitle doesn't match it.
Evidence and limitation: Our calculations: Amazon about 45% in 2020 and 39% in 2021E; subscriptions 9% to 28%.
What a founder can adapt: Date the subtitle's split or quote the bars.
Supporting analysis
What the deck claims: "20% of revenue from ecom"; "65% of online sales from drinksupercoffee.com and 35% from Amazon"; online $1M, $4M, $11M, $18M (2021E) by Amazon, Shopify one-time and subscription.
Presentation choice: A headline share should come from the chart.
When it does not fit: Don't give a share with no period.
Glamour Cosmetic India business model slide — slide 16
Beauty brand. Category slide.
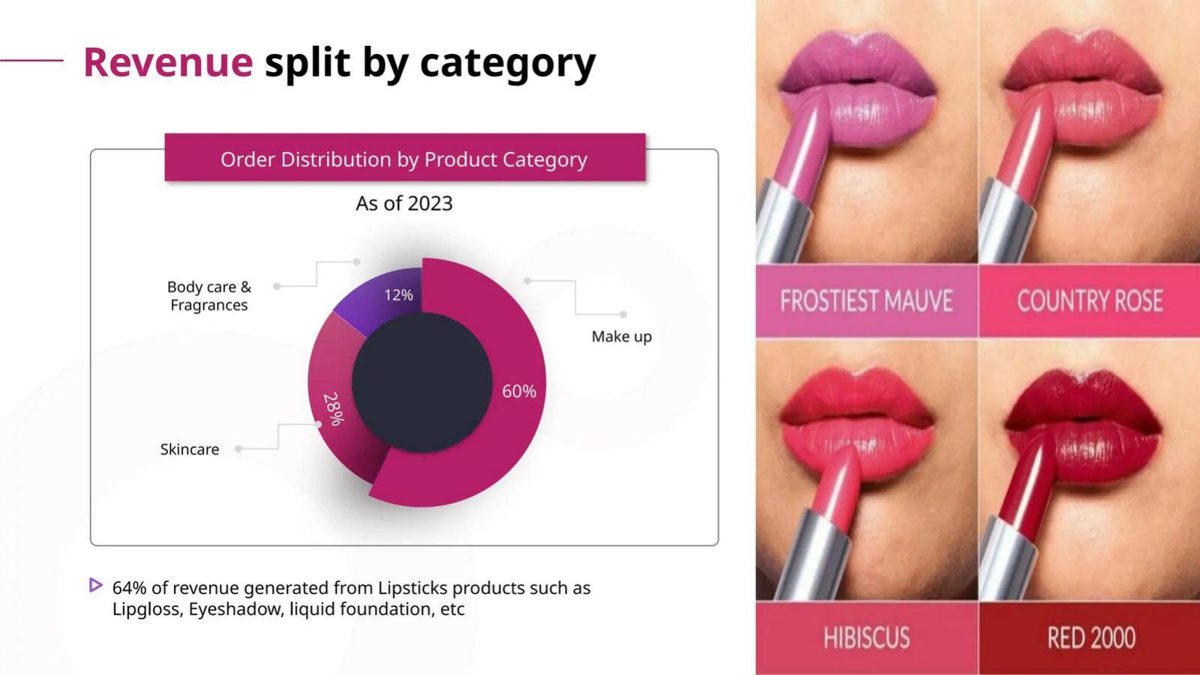
Glamour Cosmetic India deck, slide 16. Exact stored slide matched to this analysis.
Our analysis: Base changes between title, chart and text.
Evidence and limitation: Orders and revenue on one slide; 60% vs 64%.
What a founder can adapt: Show revenue by category and label it.
Supporting analysis
What the deck claims: Title "Revenue split by category"; chart "Order Distribution by Product Category, As of 2023": make-up 60%, skincare 28%, body care 12%; "64% of revenue generated from Lipsticks products".
Presentation choice: The reader cannot tell which split is revenue.
When it does not fit: Don't title an order split as revenue.
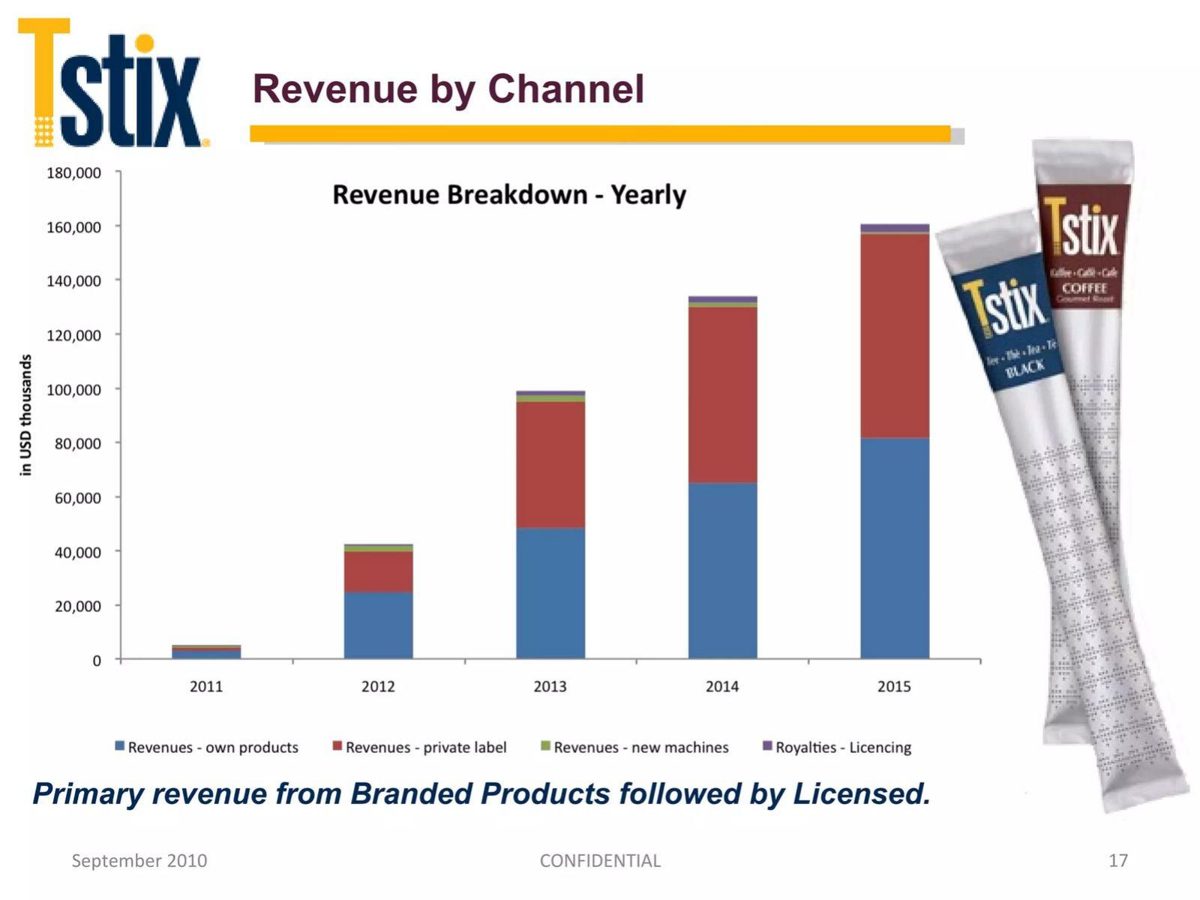
Evidence and limitation: All years are forecasts; private label, not licensing, is second.
What a founder can adapt: Mark projected years and fix the caption.
Supporting analysis
What the deck claims: Yearly revenue 2011-2015 by own products, private label, new machines, licensing; about $5M to $160M; "Primary revenue from Branded Products followed by Licensed".
Presentation choice: Forecast mix read as history misleads.
When it does not fit: Don't describe a stream the chart barely shows.
Ethos deck, slide 12. Exact stored slide matched to this analysis.
Our analysis: A mix chart that cannot be read.
Evidence and limitation: No numbers or segment labels on the chart.
What a founder can adapt: Label each channel with its share.
Supporting analysis
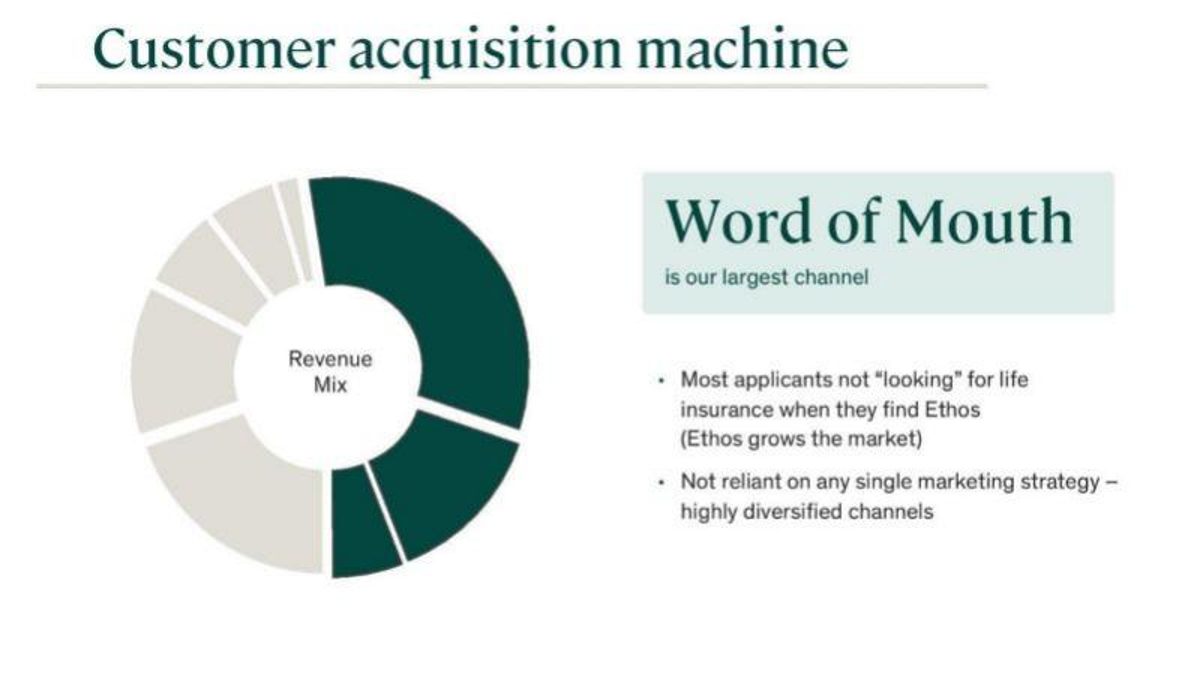
What the deck claims: Donut labelled "Revenue Mix" with no values or legend; "Word of Mouth is our largest channel"; "not reliant on any single marketing strategy".
What improved: Uses Super Coffee's own 2020 bar, with a period and total (our calculation from the chart).
What a revenue mix tells an investor
Total revenue says how big a business is; the mix says what kind of business it is. A company earning most of its money from recurring subscriptions is valued differently from one earning the same amount from one-off hardware sales. A company with half its revenue from one marketplace, one distributor or one country carries a risk that the total hides. A shift in the mix over time, toward a higher-margin product or away from a legacy plan, is often the real story behind a growth chart.
Investors therefore read a mix slide with three questions. First, what is being split? Revenue, gross profit, orders, units and customers can all be shown as a pie, and they give different answers: a cheap product can be most of the orders and little of the revenue. Second, which period? A split for one strong quarter, a cumulative split since launch and a forecast for three years out are not interchangeable. Third, how much money is behind each slice? A 70% share of a small total and of a large total are different facts, so at least one absolute figure should appear somewhere on the slide or the one next to it.
The arithmetic check is simple and often skipped. The shares should add to 100%, allowing a point either way for rounding. If they add to much more, categories overlap or figures from different periods were combined; if they add to much less, part of the revenue is missing and the reader will want to know what it is. When the slide gives amounts as well as shares, each amount divided by the total should give its share. When the headline quotes a share, the chart below should show it.
Mix slides also carry a quieter test: does the split fit the story the rest of the deck tells? A deck that calls itself a software company should show software revenue growing as a share. A deck that claims to be global should show revenue outside the home market. A caption that says branded products lead, followed by licensing, should sit on a chart where licensing is actually second. Several slides below fail exactly this test.
Revenue mixes that add up
Health Cuisine's page 25, "Revenue Model 2012", is a plan for a cookbook: "Target → 3000 book pre-sales, € 179.000". The revenue mix lists 1,200 books sold to hotels (12 hotels × 100 × €40) for €48,000, 650 books to investors at €60 for €39,000 and 1,150 books at the €80 retail price for €92,000, then "€ 127K (costs) / € 179K → 29% profit, € 52.000". Our checks: 1,200 + 650 + 1,150 is 3,000 books; €48,000 + €39,000 + €92,000 is €179,000; €179,000 − €127,000 is €52,000, which is 29% of €179,000. Every line reconciles. The mix is also informative: retail is 38% of books but 51% of revenue, while hotels take 40% of books for 27% of revenue (our calculations). The one thing to note is that all of it is a target, which the slide says plainly.
Joey York's page 10, "Attractive Chair-Level Economics with Low Overhead", shows a revenue mix pie of 85% "Services & Product Sales" and 15% "Manufacturer Rebates", an income-and-expenses pie in which the slice labelled operating margin is 57%, "$2M-$5M revenue per chair based on saturation rates of 40% and 100%", 85% repeat customers, a $700 average sale, 18 patients per chair per day at 80% saturation and "$78,400 revenue per chair per week (80% saturation; 112 patients/week)". Our checks: 112 patients × $700 is $78,400; over 52 weeks that is about $4.1M a year at 80% saturation, which scales to about $5.1M at 100% and $2.0M at 40%, matching the range. The mix matters here: 15% of revenue comes from product manufacturers rather than patients, and a 57% margin partly rests on that rebate income continuing.
Titan Labs' page 8, "Our Business Model", says the company "earns revenue primarily through the direct sale of its line of streak cameras and comb generators": 41% from Perseus streak cameras, 37% from Cronos streak cameras and 21% from Hyperion comb generators, with "profit margins ranging from 30-45% during first three years of production". The shares add to 99%, a normal rounding gap. The split is clear by product, but it has no period and no total, so an investor cannot tell whether 41% means a handful of cameras or a steady line of sales.
Revenue mix as a diversification or concentration signal
Front's page 15, "2019: deliberate approach to growth", shows two bar charts: "Diversity of industries (% of revenue)", with software the largest named industry at roughly 17% and an "Other" bar slightly larger, followed by logistics, professional services and ecommerce; and "Diversity of use cases (% of customers)", led by customer support at about 20%. Values have to be read from the bars. The slide does the useful thing of stating the base for each chart, and the two bases differ, which is right: industry exposure is a revenue question, use cases a customer question. No single industry is more than about a sixth of revenue, which is what the headline is claiming.
Rohlik's page 9, "Highly differentiated assortment", has two splits. The "inverted pyramid" compares share of about 23,000 products with share of net revenue: premium 47% of products and 34% of revenue, mid-range 50% and 58%, value 3% and 9%. A table lists net revenue by category: dairy and chilled 16%, fruit and vegetables 14%, drinks 13%, durable and pantry 12%, meat and fish 9%, deli 7%, health and cosmetics 6%, bakery 5%, baby and kids 4%, household and office 4%, frozen 3%, special nutrition 3%, other 9%. The pyramid is the model: showing products and revenue side by side reveals that the small value range earns three times its share. Our check on the table: the categories add to 105%, not 100%. The pyramid's revenue shares add to 101%, within rounding. A 5-point excess is more than rounding and suggests the column mixes periods or double-counts a category.
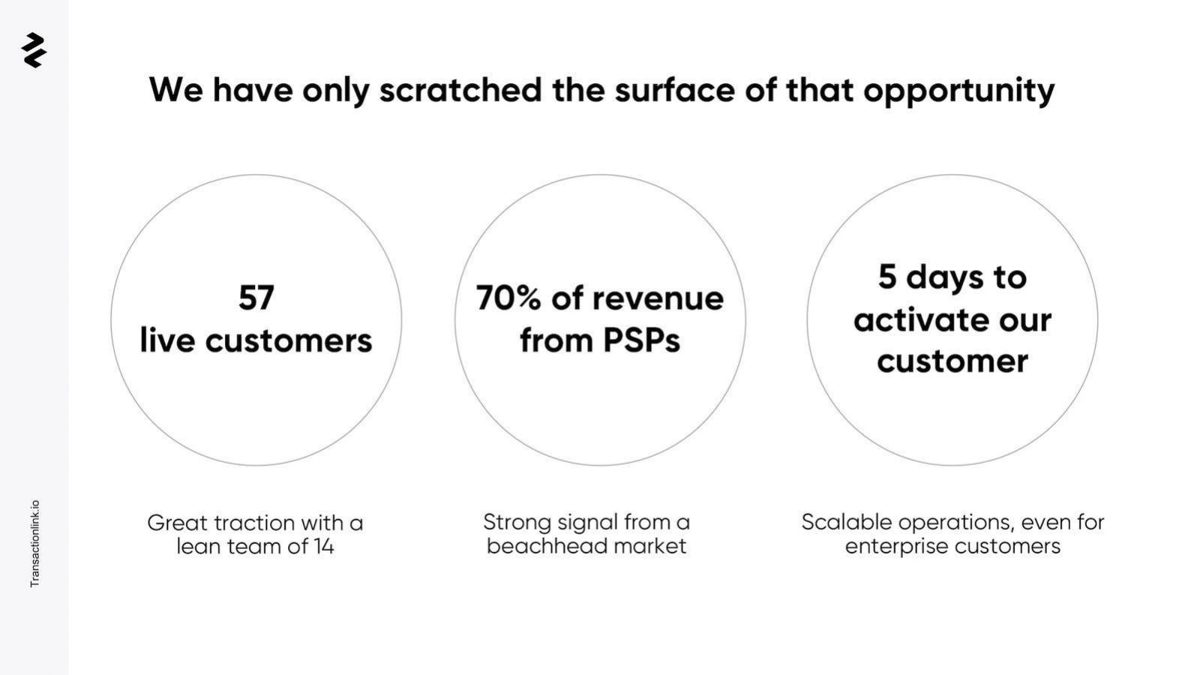
Transactionlink's page 3, "We have only scratched the surface of that opportunity", gives three circles: "57 live customers", "70% of revenue from PSPs" (payment service providers) captioned "Strong signal from a beachhead market", and "5 days to activate our customer". A single customer-type share is useful, but the slide does not say how many of the 57 customers are PSPs. Seventy per cent of revenue from forty PSPs is a beachhead; seventy per cent from three is concentration. One more number would tell the reader which.
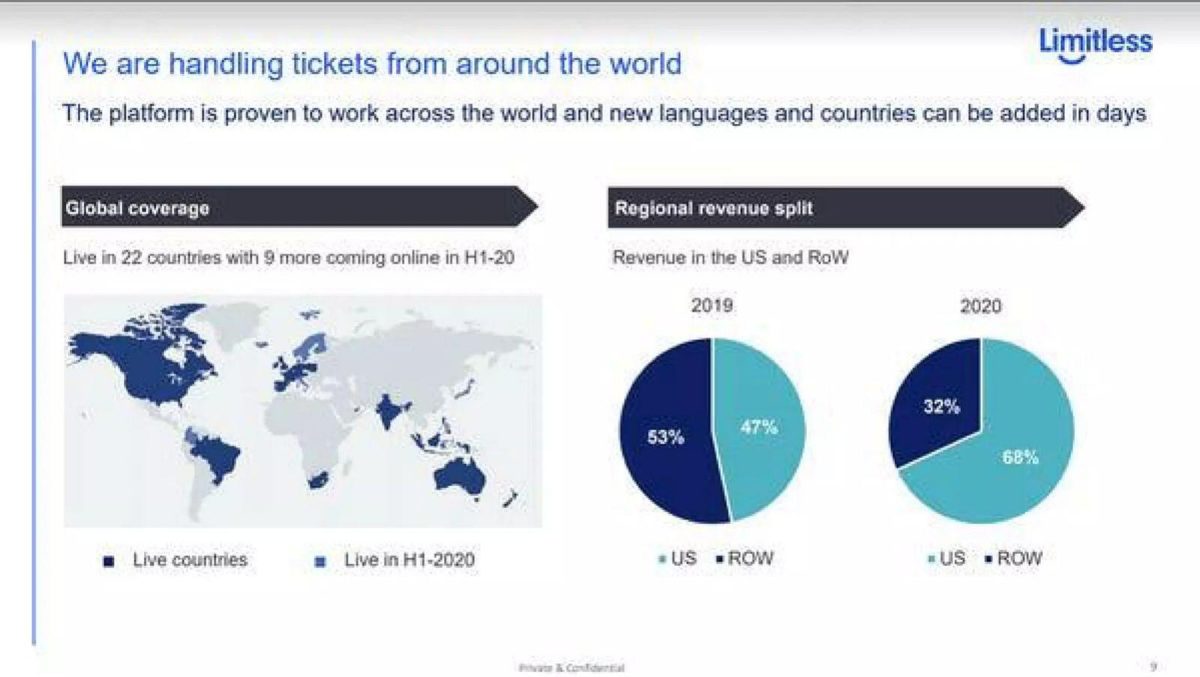
Limitless's page 7, "We are handling tickets from around the world", pairs a coverage map ("Live in 22 countries with 9 more coming online in H1-20") with a "Regional revenue split" for 2019 and 2020. Reading the legend's shading, the US share rises from 47% in 2019 to 68% in 2020 while the rest of the world falls from 53% to 32%. The headline is about global reach, but the chart shows revenue concentrating in one market. The slide gives no revenue totals, and since it describes countries coming online in the first half of 2020, the 2020 split is probably partial or forecast, which the chart does not say.
Revenue mix that tracks a shift
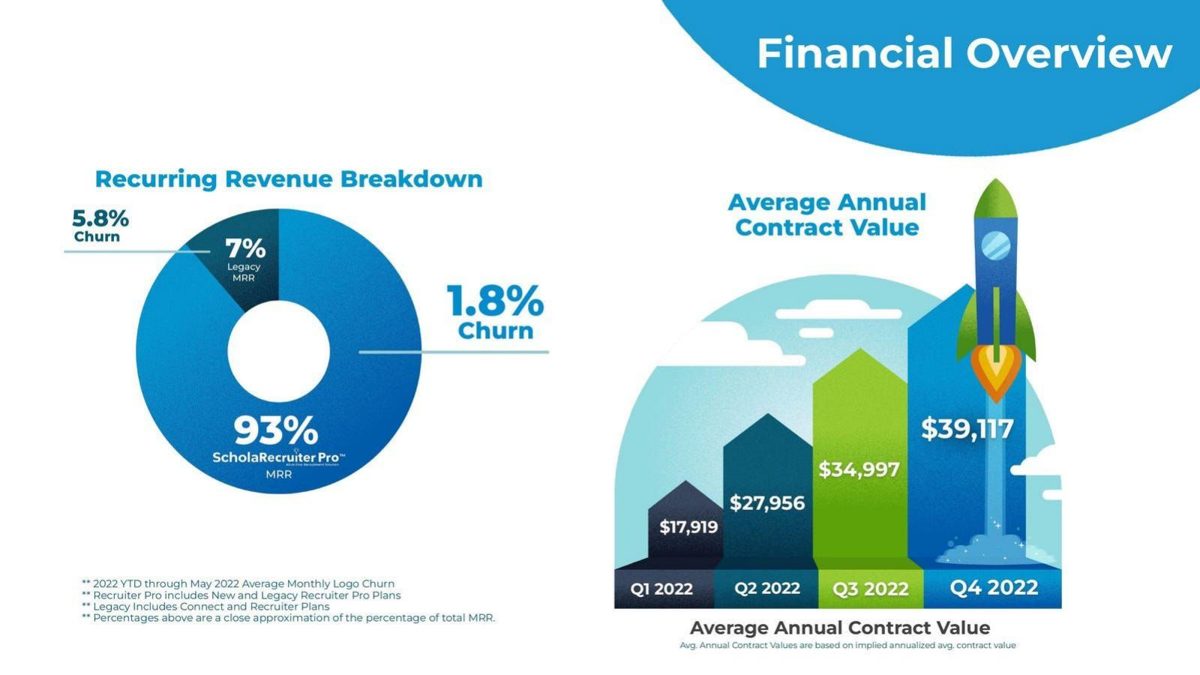
Schola's page 10, "Financial Overview", shows "Recurring Revenue Breakdown": 93% ScholaRecruiter Pro MRR with 1.8% churn and 7% legacy MRR with 5.8% churn, footnoted as "2022 YTD through May 2022 average monthly logo churn" and "percentages above are a close approximation of the percentage of total MRR". Beside it, average annual contract value rises from $17,919 in Q1 2022 to $27,956, $34,997 and $39,117 in Q4 2022, about 2.2 times in a year (our calculation). Pairing each slice with its churn turns a mix into an argument: the new plan is most of the revenue and loses customers at about a third of the legacy rate. What the slide leaves unclear is timing: the churn footnote runs only to May 2022, and the chart does not say whether its Q3 and Q4 figures are complete quarters.
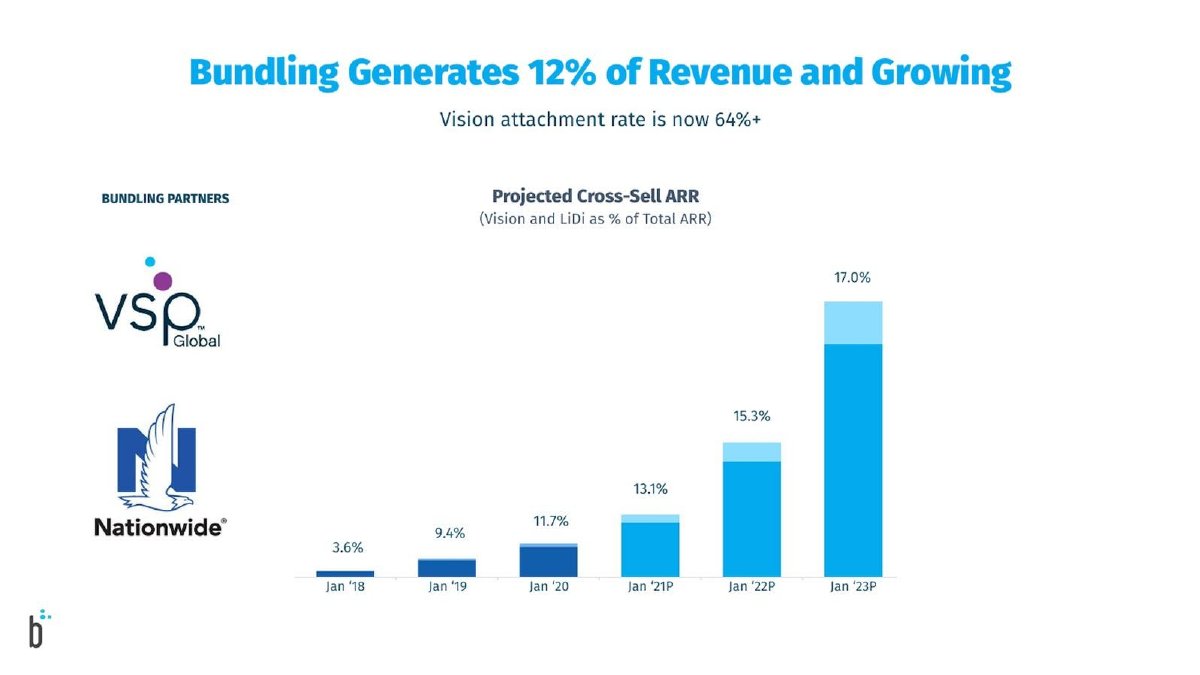
Beam's page 12, "Bundling Generates 12% of Revenue and Growing", notes "Vision attachment rate is now 64%+", names VSP Global and Nationwide as bundling partners, and charts "Projected Cross-Sell ARR (Vision and LiDi as % of Total ARR)": 3.6% in January 2018, 9.4% in 2019, 11.7% in 2020, then 13.1%, 15.3% and 17.0% marked as projections for 2021 to 2023. The trend is clear and the projected years are labelled. The headline, though, quotes 12% of revenue, while the chart measures annual recurring revenue and its last actual value is 11.7%. Revenue and ARR can differ, and a headline should quote the figure on the chart.
Super Coffee's page 27 (Kitu Life), "We're digital natives with 20% of revenue from ecom", has the subtitle "65% of online sales from drinksupercoffee.com and 35% from Amazon" over stacked bars of online sales: $1M in 2018, $4M in 2019 (Amazon 2, Shopify one-time 2), $11M in 2020 (Amazon 5, Shopify one-time 5, Shopify subscription 1) and $18M forecast for 2021 (7, 6 and 5). Our calculations: Amazon is 5 of 11, about 45% of 2020 online sales, and 7 of 18, about 39%, in the 2021 forecast, not the 35% in the subtitle, which gives no period. Subscriptions grow from about 9% to 28% of online sales. The chart is informative; the subtitle does not match it, and the 20% headline implies total revenue about five times the online figure, which the slide never shows.
Splits that measure something else, or nothing
Glamour Cosmetic India's page 16 is titled "Revenue split by category", but its chart is headed "Order Distribution by Product Category, As of 2023": make-up 60%, skincare 28%, body care and fragrances 12%. Below it: "64% of revenue generated from Lipsticks products such as Lipgloss, Eyeshadow, liquid foundation, etc". Orders and revenue are different bases, so the title and the chart disagree; the 64% line quotes a third figure, and its list of "lipsticks products" includes eyeshadow and foundation. An investor cannot tell which split describes the money.
Tstix's page 17, "Revenue by Channel", shows yearly revenue in USD thousands from 2011 to 2015, split into own products, private label, new machines and licensing royalties, rising from about $5M to about $160M. The footer is dated September 2010, so every bar is a forecast, but nothing on the chart says so. The caption reads "Primary revenue from Branded Products followed by Licensed"; on the chart, private label is the second stream (roughly $75M of 2015's total, read from the bars) and licensing is the thin top layer. The chart and its caption describe different businesses.
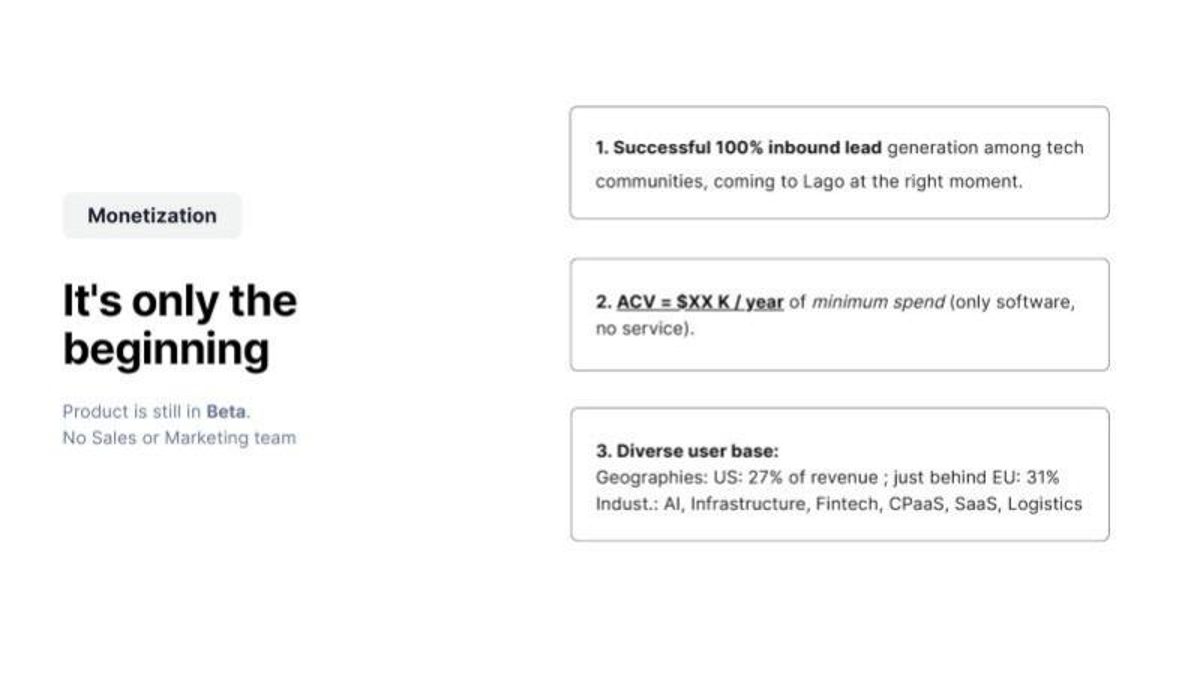
Lago's page 12, headed "Monetization" and "It's only the beginning", says the product is still in beta with no sales or marketing team, notes 100% inbound lead generation and "ACV = $XX K / year of minimum spend" (a placeholder), and describes a diverse user base: "Geographies: US: 27% of revenue; just behind EU: 31%", with industries listed but not quantified. Our calculation: the two regions account for 58% of revenue, leaving 42% unexplained, which is larger than either region named. The placeholder ACV removes the only figure that could size the split.
Artcorgi's page 4, "Numbers", says "18% of Revenue from Reorders", with an average order of $120 and "We take a 30% cut". Our calculation: a 30% cut of a $120 order is about $36 of company revenue per order. The reorder share is a useful retention signal, but the slide does not say whether the 18% is of order value or of the company's cut, or over what period; with a constant cut the share is the same either way, but the reader has to assume that.
Ethos's page 12, "Customer acquisition machine", shows a donut labelled "Revenue Mix" with about seven segments and no numbers, legend or labels, beside the claim that word of mouth "is our largest channel" and that the company is "not reliant on any single marketing strategy". The chart shape suggests one segment of roughly a third, but nothing on the slide says which channel it is or what it measures. A revenue mix without values cannot support a diversification claim.
How to show your revenue mix
Name the base in the title and on the chart. If the split is of revenue, say revenue; if it is of orders, customers or recurring revenue, say that, and don't title it as something else. Front's two charts, one by revenue and one by customers, each labelled, are the example to follow.
Add the shares before you share the slide. They should total 100% within a point. If they do not, find the overlap or the missing slice; Rohlik's category column and Lago's regions both leave a gap an investor will notice.
Give at least one amount. Health Cuisine's euro figures and Joey York's weekly revenue let every percentage be turned back into money. Percentages alone cannot show whether a slice is material.
Date the split and label forecasts. A split for a named year or quarter is evidence; a split for a future year is a plan. Beam labels its projected years; Tstix's 2010 deck does not.
Make the headline quote the chart. If the title says 35% or 12%, the chart should show 35% or 12%. When Super Coffee's subtitle and bars disagree, the reader trusts neither.
Show what the mix means. The strongest mix slides tie each slice to something that matters: churn (Schola), margin (Rohlik's premium and value ranges), dependence on a partner (Joey York's rebates, Transactionlink's PSPs). A pie on its own is a description; a pie with one consequence is an argument.
Common mistakes
Shares don't total 100%. Re-add before sharing.
Wrong base. Don't title orders or ARR as revenue.
No amounts. Give at least one total.
Headline off the chart. Quote the chart's figure.
Forecast unlabelled. Mark projected periods.
Unlabelled pie. Every slice needs a name and value.
Diagnostic checklist
The base (revenue, ARR, orders) is named in the title and chart.
Shares add to 100% within rounding.
At least one absolute figure is given.
The period is stated and forecasts are labelled.
The headline share matches the chart.
The largest slice's consequence (risk, margin, churn) is stated.
Frequently asked questions
What should a revenue mix slide show?
Where revenue comes from, by the split that matters most for your business, with shares that add to 100%, a period and a total. Health Cuisine's plan shows units, prices and amounts for each stream.
Can I show an order or customer split instead?
Yes, if you label it. Front labels one chart by revenue and one by customers. Glamour Cosmetic's order chart titled as revenue is the mistake to avoid.
How do I show concentration honestly?
Give the share and the number of customers or partners behind it. Transactionlink's 70% from PSPs needs the PSP count to be read.
Should I show how the mix changes over time?
If the shift is your story, yes. Beam and Super Coffee chart the change year by year; label which years are projections.
How do I check my own slide?
Add the shares, divide each amount by the total, and compare the headline with the chart. Rohlik's categories and Super Coffee's subtitle both fail one of these checks.
How we chose these examples
Search (2026-09-30): the durable corpus index (docs/seo/artifacts/corpus-search, 70,729 unique pages, deduplicated by deck-file sha256 + page) was searched for revenue mix, revenue split, revenue breakdown, revenue by segment, stream, product or channel, and "% of revenue"; 184 pages matched. Public companies, investor-relations, SPAC and IPO presentations, expense-ratio pages and industry statistics were excluded.
Sixteen candidate pages were rendered from the original public deck files and read from the images; fifteen are used: Health Cuisine 25, Joey York 10, Titan Labs 8, Front 15, Rohlik 9, Transactionlink 3, Limitless 7, Schola 10, Beam 12, Super Coffee (Kitu Life) 27, Glamour Cosmetic India 16, Tstix 17, Lago 12, Artcorgi 4 and Ethos 12.
Left out after reading: Sesh 4 (an industry statistic about superfans, not the company's revenue). Not read: Leafly 17 and eToro 38 (SPAC-stage presentations), and investor presentations from listed companies such as Daseke, Diplomat Pharmacy, Atento and Instructure.
Figures are as printed on each slide; values read from charts are approximate, and we did not have the companies' underlying data. How we built this: drafted and checked with AI assistance (editorial model review against the original slide images); no human editor has reviewed this guide.