GMV vs Revenue on a Pitch Deck: Does the Take Rate
How marketplaces and payment startups show gross merchandise value (GMV), gross bookings and their own revenue on a pitch deck: take rate.
How to Show GMV and Revenue on Your Pitch Deck Without Blurring Them
Thirteen slides from real pitch decks that show gross merchandise value, gross bookings or transaction volume. For each, we record what the slide says, whether it separates the money that passes through the platform from the money the company keeps, whether a take rate is stated, and whether the volume, rate and revenue multiply through.
TL;DR
Gross merchandise value (GMV) is the total value of the transactions that pass through a platform. Revenue is the part the company keeps. Investors value a marketplace on revenue and gross profit, so they want three things on the slide: the volume, the take rate (revenue divided by volume) and the revenue itself, with a clear label for which figure is which. When the three are shown and they multiply through, an investor can trust the headline volume. When only the volume is shown, or when volume is labelled "revenue", the investor has to guess how much of the money the company actually earns.
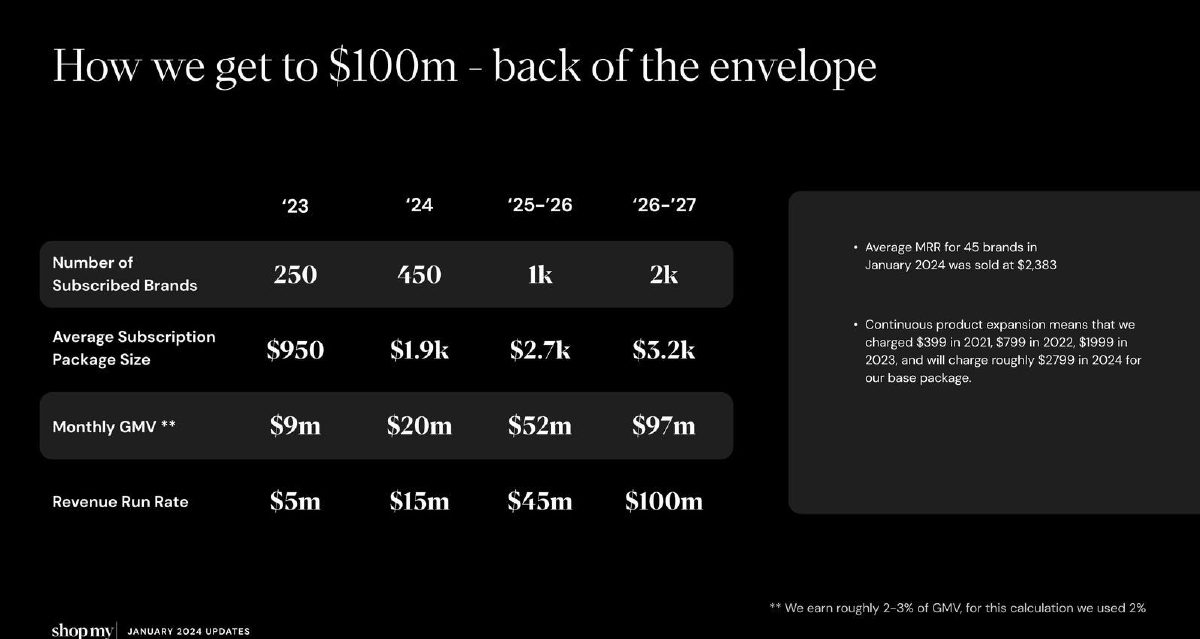
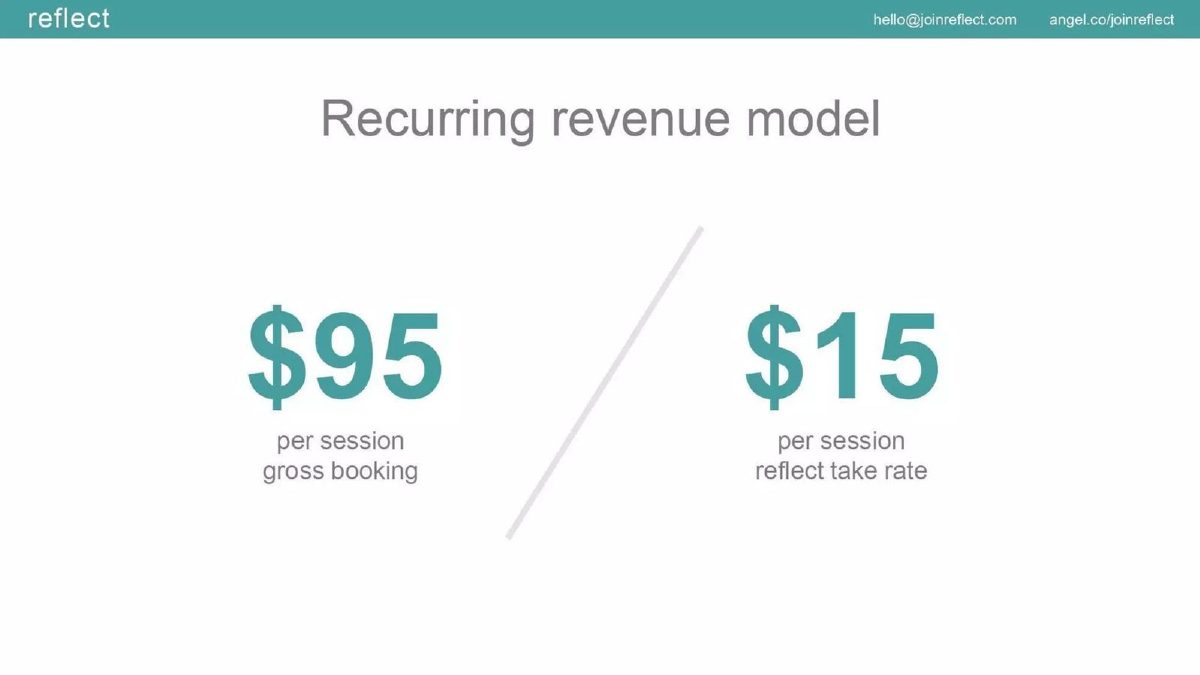
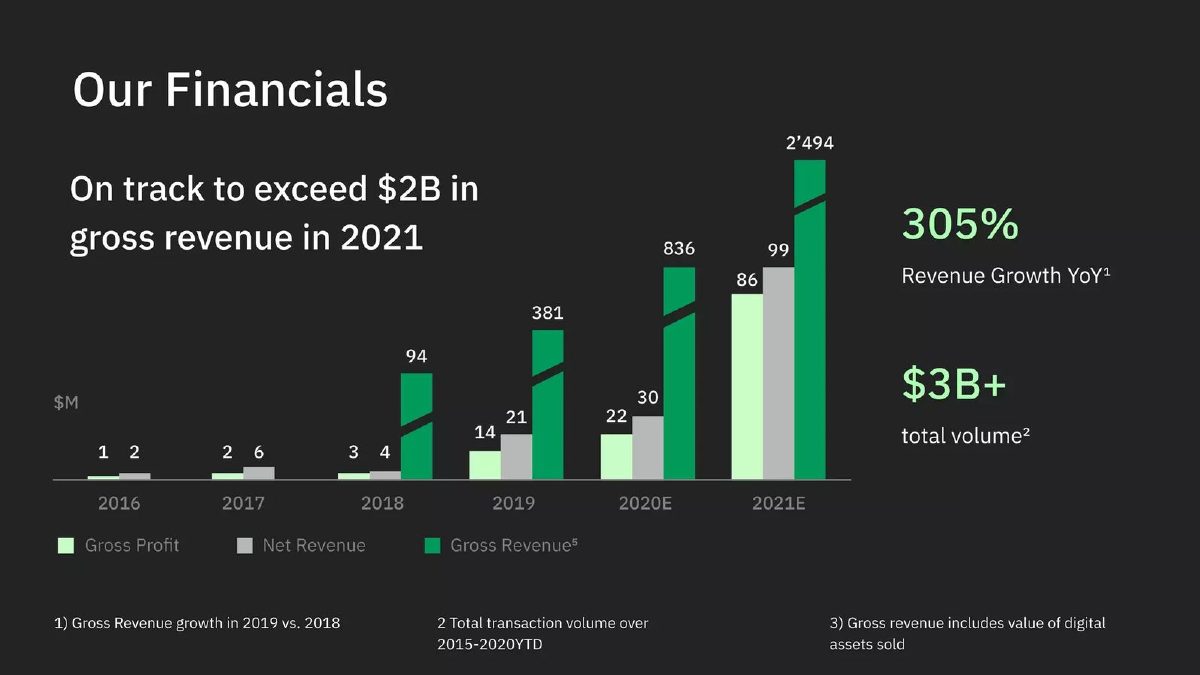
In this set, ShopMy's back-of-the-envelope table is the model: subscribed brands, subscription size, monthly GMV and a footnoted 2% take rate multiply through to each year's revenue run rate within about $0.1M (our check). Reflect shows a $95 booking and its $15 take side by side. At the other end, Naugo's forecast books revenue higher than its own transaction volume in 2020 and only reaches its real margin after a line called "cost of revenue sharing"; Wirex headlines $2.5B of "gross revenue" that includes the value of digital assets sold, against $99M of net revenue (a 4% ratio, our calculation); and Wallet calls the take on its GMV "net income".
GMV and revenue slides from real pitch decks
Each example records what the slide states, whether it separates volume from the money the company keeps, whether the figures reconcile and what to copy or avoid. "Our calculation" marks arithmetic we did; the slides do not show it.
ShopMy traction slide — slide 18
Creator commerce platform, brand subscriptions plus a take on GMV. January 2024 update.
ShopMy deck, slide 18. Exact stored slide matched to this analysis.
Our analysis: A forecast whose volume, rate and revenue reconcile.
Evidence and limitation: Our check: subscriptions times 12 plus 2% of GMV times 12 gives $5.01M, $15.06M, $44.88M and $100.08M.
What a founder can adapt: Show the basis for brand growth.
Supporting analysis
What the deck claims: Brands 250 to 2k; package $950 to $3.2k; monthly GMV $9m to $97m; revenue run rate $5m to $100m. Footnote: earns 2–3% of GMV, 2% used.
Presentation choice: Every column multiplies through and the low end of the take range is used.
When it does not fit: Don't present the forecast without its footnoted rate.
Wirex deck, slide 14. Exact stored slide matched to this analysis.
Our analysis: Headline and growth use the gross figure.
Evidence and limitation: Our calculations: net is 4.0% of gross; 305% matches gross revenue 2018 to 2019.
What a founder can adapt: Lead with net revenue and gross profit.
Supporting analysis
What the deck claims: 2021E gross profit $86M, net revenue $99M, gross revenue $2,494M; gross revenue includes digital assets sold; 305% revenue growth.
Presentation choice: Net revenue is shown, but not emphasised.
When it does not fit: Don't headline revenue that includes assets sold for customers.
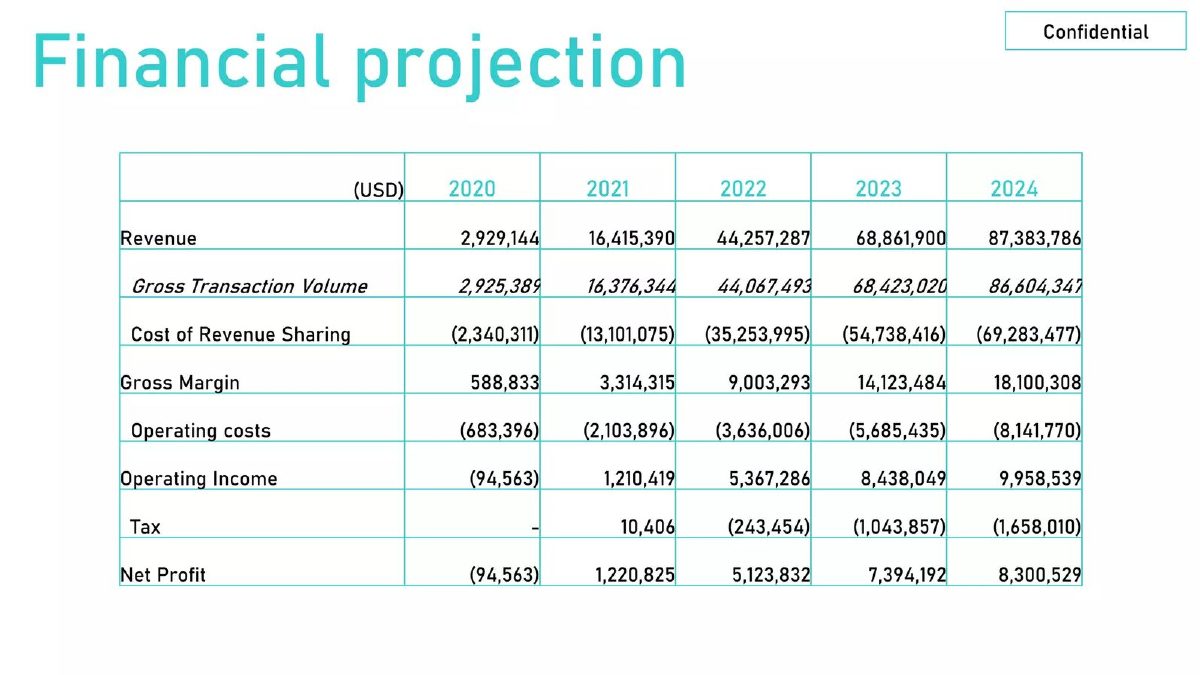
Naugo deck, slide 20. Exact stored slide matched to this analysis.
Our analysis: The whole booking is recorded as revenue.
Evidence and limitation: Our calculations: gross margin is 20.1% of revenue in 2020 and 20.7% in 2024; in 2021 tax appears added to net profit.
What a founder can adapt: Show net revenue as the headline line.
Supporting analysis
What the deck claims: Revenue slightly above gross transaction volume each year ($2.93M vs $2.93M in 2020; $87.4M vs $86.6M in 2024); cost of revenue sharing leaves gross margin $588,833 in 2020.
Presentation choice: The real margin appears only three lines down.
When it does not fit: Don't show revenue larger than the volume it comes from without explaining it.
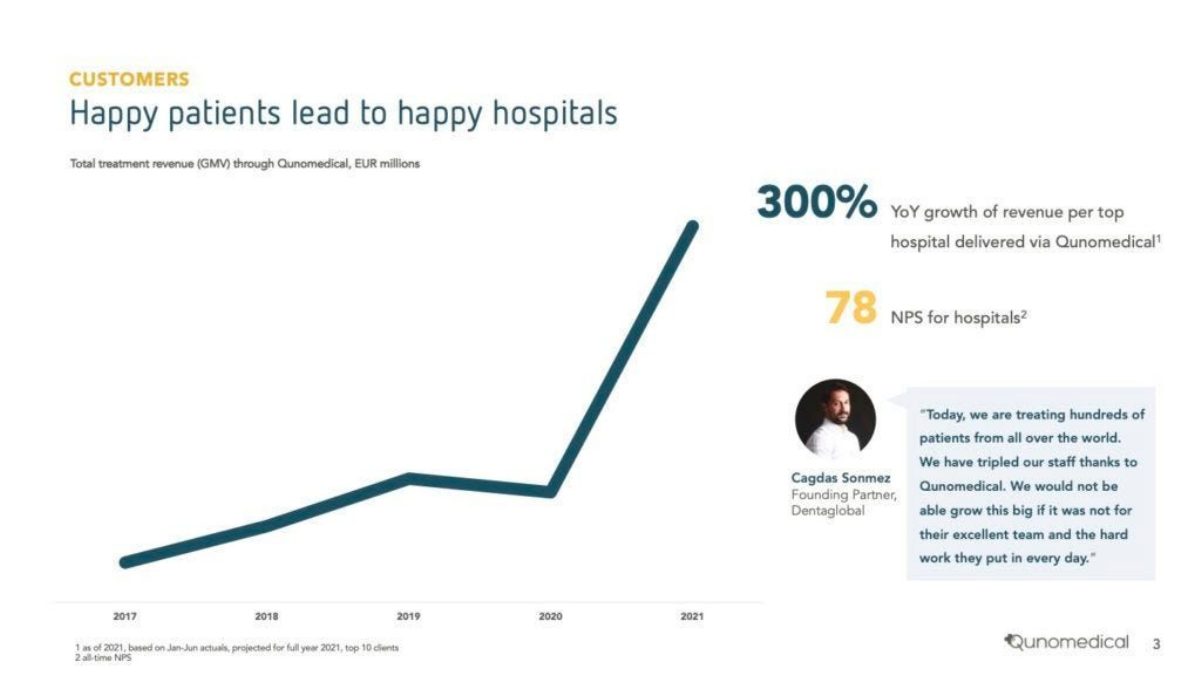
Qunomedical deck, slide 4. Exact stored slide matched to this analysis.
Our analysis: "Revenue" used for money hospitals receive.
Evidence and limitation: No values; the footnote states the projection and sample.
What a founder can adapt: Label GMV as GMV and give the platform's take.
Supporting analysis
What the deck claims: Chart of "Total treatment revenue (GMV)" 2017–2021 with no axis values; 300% growth of revenue per top hospital, Jan–Jun actuals projected, top 10 clients.
Presentation choice: Honest footnote; the company's own take is absent.
When it does not fit: Don't title a GMV chart "revenue".
Marketplace raising a Series A. Use-of-funds page.
Clockwork deck, slide 17. Exact stored slide matched to this analysis.
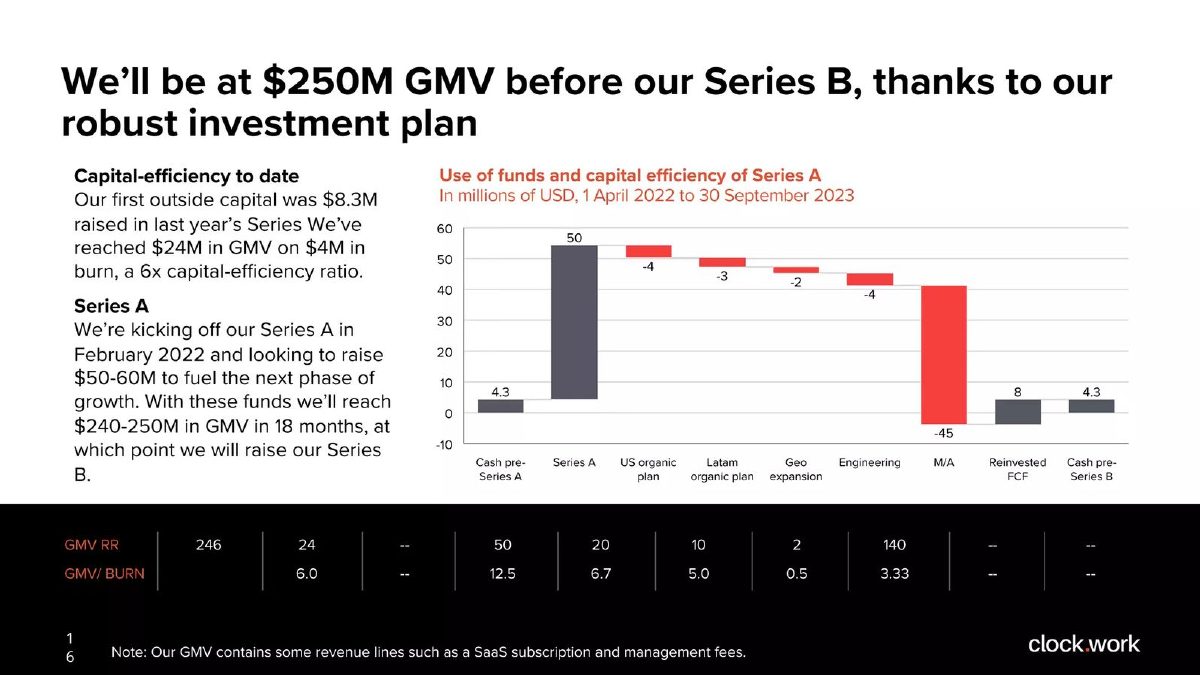
Our analysis: Efficiency measured on volume, with fees mixed in.
Evidence and limitation: No revenue figure; the footnote discloses the mix.
What a founder can adapt: Report fees separately and give revenue per dollar of burn.
Supporting analysis
What the deck claims: $24M GMV on $4M burn, "a 6x capital-efficiency ratio"; target $240M–$250M GMV; footnote: GMV contains SaaS subscription and management fees.
Presentation choice: The footnote is honest but blurs the take rate.
When it does not fit: Don't add your own fees to GMV.
Columns report what each slide states or leaves out; checks are our calculations.
Example
Volume shown
Revenue shown
Take rate
Reconciles?
ShopMy
Monthly GMV (forecast)
Run rate
2% stated
Yes
Reflect
$95 booking
$15 take
15.8% (ours)
Yes, per unit
Leafly
GMV by state
Retail revenue
Not a take model
Yes
Wirex
Gross revenue
Net revenue
4.0% (ours)
Yes; headline is gross
Naugo
Transaction volume
Gross booked
About 20% margin (ours)
Partly
Poshmark
$100M GMV
$20M–$30M
20% plus shipping
Only with pass-through
Room2Shop
INR 6.46M GMV
No
12–20%
No revenue shown
Wallet
$200M GMV (forecast)
Called net income
6–8%
Yes; label wrong
Qunomedical
Chart, no values
No
No
No
Clockwork
$24M GMV incl. fees
No
No
No
Gearflow
Blank
No
10%
No
Super.com
~$1B GMV
Growth rate only
No
No
Twisto
Chart, no values
Chart, no values
No
No
Key Takeaways
Show volume, take rate and revenue together. ShopMy's table reconciles each year within about $0.1M (our check).
Label gross and net revenue. Wirex's $2.5B gross revenue is about 25 times its $99M net revenue (our calculation).
Don't call commission "profit" or "net income". Room2Shop and Wallet both do.
Say what is in GMV. Clockwork's footnote admits its GMV includes SaaS and management fees.
Separate pass-through fees. Poshmark's upper revenue range needs shipping fees that mostly pay for shipping.
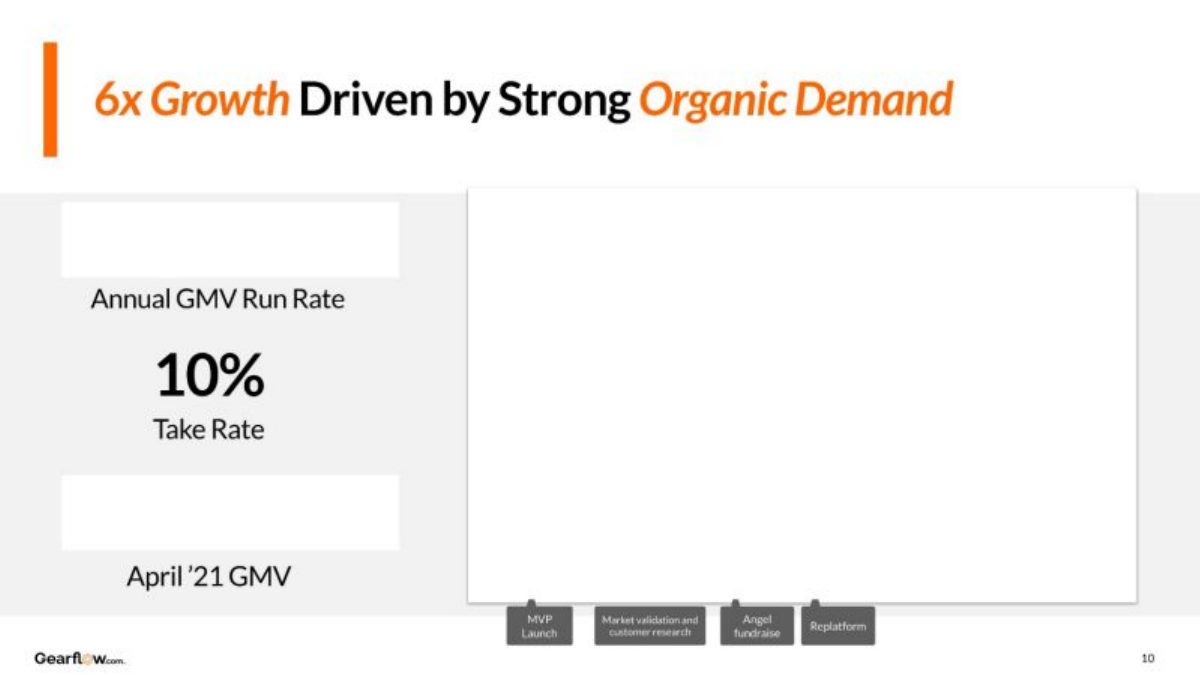
Keep the base visible. Gearflow's 10% take rate sits beside blank GMV boxes in the public copy.
Build your GMV and revenue line
Fill in each field. If a value is a forecast or an assumption, say so on the slide.
Volume. GMV or bookings for which period, actual or run rate?
Contents. Does the volume include your own fees, shipping or subscriptions?
Take rate. Revenue divided by volume, blended across categories?
Revenue. Net revenue for the same period?
Other income. Subscriptions or fees not tied to each transaction?
Gross profit. What is left after payment, shipping and supplier costs?
Copyable framework: GMV $[X] ([period], [actual/run rate/forecast]); take rate [Y]% gives $[X times Y] plus $[other] subscriptions = net revenue $[R]; gross profit $[G].
Illustrative example 1 — written by us
Before: USD 15 million (6-8% take rate) Annualized net income
After: Forecast March 2024: annualized GMV $200M at a 7.5% take rate gives $15M of annualized revenue; costs shown separately.
What improved: Uses Wallet's own figures and labels the take as revenue, not income.
Why GMV and revenue must be kept apart
A marketplace, payments company or booking platform sees much more money than it keeps. A buyer pays $100, the seller receives $80, and the platform earns $20. The $100 is GMV (or gross bookings, or transaction volume); the $20 is revenue; and the ratio between them, 20%, is the take rate. Both numbers matter. GMV shows how much activity runs through the platform and how large it could become. Revenue shows what the company earns from that activity and is the basis for margin, burn and valuation.
Investors therefore read a marketplace slide by looking for the link between the two. A large GMV with no revenue beside it raises the question of how much the company keeps. A large revenue figure with no GMV raises the question of whether the company is recording the whole transaction as its own sales. A stated take rate with no base leaves the investor with a percentage of an unknown number. The strongest slides give the volume, the rate and the resulting revenue so each can be checked against the other.
There is a real accounting choice behind this. Some companies act as the seller of record and book the full transaction value as revenue, then record the payout to suppliers as a cost; others act as an agent and book only their fee. Both can be correct, but they produce very different revenue figures for the same business. Wirex and Naugo in this set both use the first approach on their slides. That is not wrong in itself, but the slide needs to show the net figure beside it so an investor comparing marketplaces compares like with like.
The second issue is what goes into GMV. Some companies add their own fees, subscriptions or shipping charges to the volume figure, which makes both GMV and the implied take rate harder to read. The third is language: commission is revenue, not profit, and the take on a transaction is not net income. Each of these shows up at least once in the thirteen slides below.
Slides where volume, rate and revenue reconcile
ShopMy's page 18, "How we get to $100m - back of the envelope", is a forecast table from its January 2024 update. It shows subscribed brands of 250, 450, 1k and 2k; average subscription package size of $950, $1.9k, $2.7k and $3.2k; monthly GMV of $9m, $20m, $52m and $97m; and revenue run rate of $5m, $15m, $45m and $100m across '23, '24, '25 to '26 and '26 to '27. A footnote says "We earn roughly 2-3% of GMV, for this calculation we used 2%". Our check, reading package size as monthly: in the first column, 250 brands times $950 times 12 is $2.85M of subscriptions, and $9m times 2% times 12 is $2.16M of GMV take, together $5.01M. The later columns give $15.06M, $44.88M and $100.08M. Every column reconciles. The slide also chooses the low end of its stated take range. What it does not show is the basis for brand growth, and all four columns are projections.
Reflect's page 7, "Recurring revenue model", shows two numbers: "$95 per session gross booking" and "$15 per session reflect take rate". Our calculation: $15 is 15.8% of $95. The slide does exactly what the section title asks: it separates what the client pays from what the company keeps. Two things are missing. The slide gives the take per session in dollars rather than as a percentage, which is fine, but it does not give a session count or a total, so the reader cannot scale the model. And the heading calls a per-session fee "recurring" without showing how often clients return.
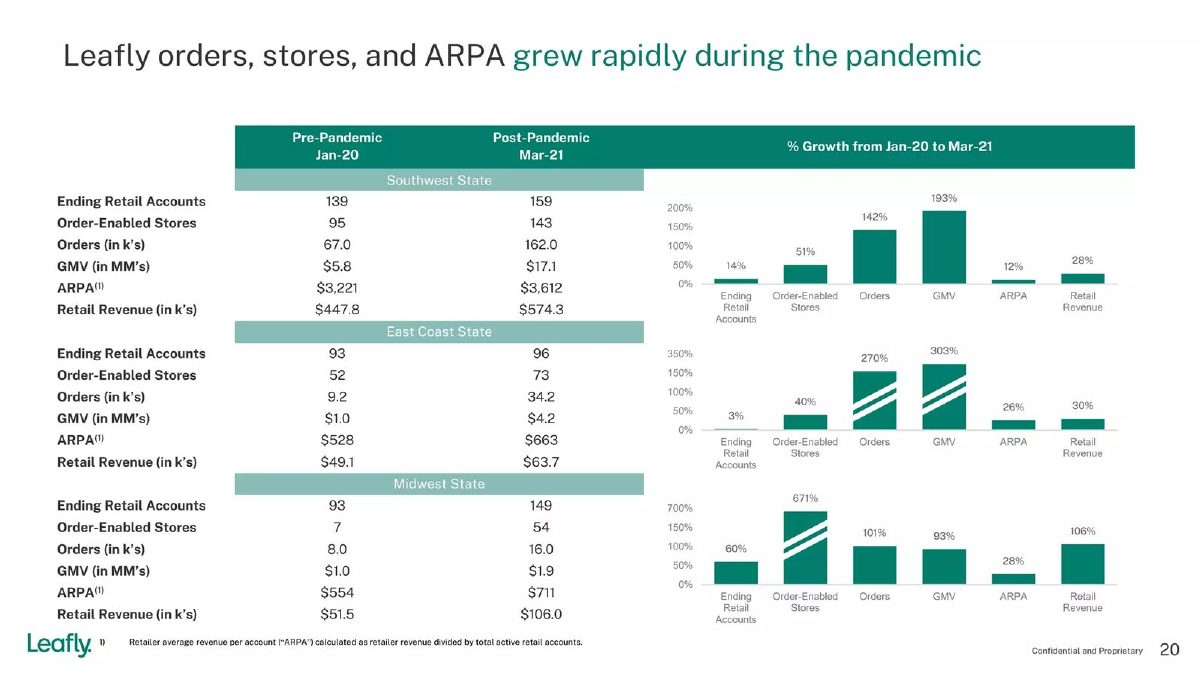
Leafly's page 20, "Leafly orders, stores, and ARPA grew rapidly during the pandemic", sets GMV beside Leafly's own retail revenue for three states, January 2020 against March 2021. In the Southwest state, GMV rose from $5.8M to $17.1M (shown as 193% growth) while retail revenue rose from $447.8K to $574.3K (28%). A footnote defines ARPA as retailer revenue divided by active retail accounts, and our check confirms it: 139 accounts times $3,221 is $447.7K, and 159 times $3,612 is $574.3K. The honest part is that the slide does not pretend GMV is Leafly's income; it shows the much smaller revenue line and its growth rate on the same table. Our calculation: revenue as a share of GMV fell from about 7.7% to 3.4%, which is what you would expect if retailers pay Leafly a subscription rather than a cut of each order. The slide does not state the period the revenue covers or how GMV growth feeds future revenue.
Gross revenue that includes the whole transaction
Wirex's page 14, "Our Financials", headlines "On track to exceed $2B in gross revenue in 2021". Its chart shows gross profit, net revenue and gross revenue for 2016 to 2021E; for 2021E these are $86M, $99M and $2,494M. Footnote 3 says "Gross revenue includes value of digital assets sold". Our calculations: net revenue is 4.0% of gross revenue in 2021E, and the "305% Revenue Growth YoY" matches gross revenue from $94M in 2018 to $381M in 2019. The slide does show net revenue, which is to its credit, but the headline and growth rate both use the gross figure, which is mostly the value of crypto the company sold on its customers' behalf. An investor comparing Wirex with another fintech needs the $99M, not the $2.5B.
Naugo's page 20, "Financial projection", shows revenue and gross transaction volume for 2020 to 2024. Revenue is slightly larger than transaction volume in every year: $2,929,144 against $2,925,389 in 2020, and $87,383,786 against $86,604,347 in 2024. The next line, "Cost of Revenue Sharing", takes out $2,340,311 in 2020, leaving gross margin of $588,833. Our calculations: gross margin is 20.1% of revenue in 2020 and 20.7% in 2024, so the business Naugo actually keeps is about a fifth of the headline. The slide gives enough to find that, but a reader skimming the top line sees an $87M revenue company. We also noticed that in 2021 operating income of $1,210,419 plus tax of $10,406 gives the net profit of $1,220,825 shown, so the tax appears to have been added rather than subtracted; in 2022 it is subtracted. Neither issue changes the lesson, but both are the kind of detail an investor's analyst will check.
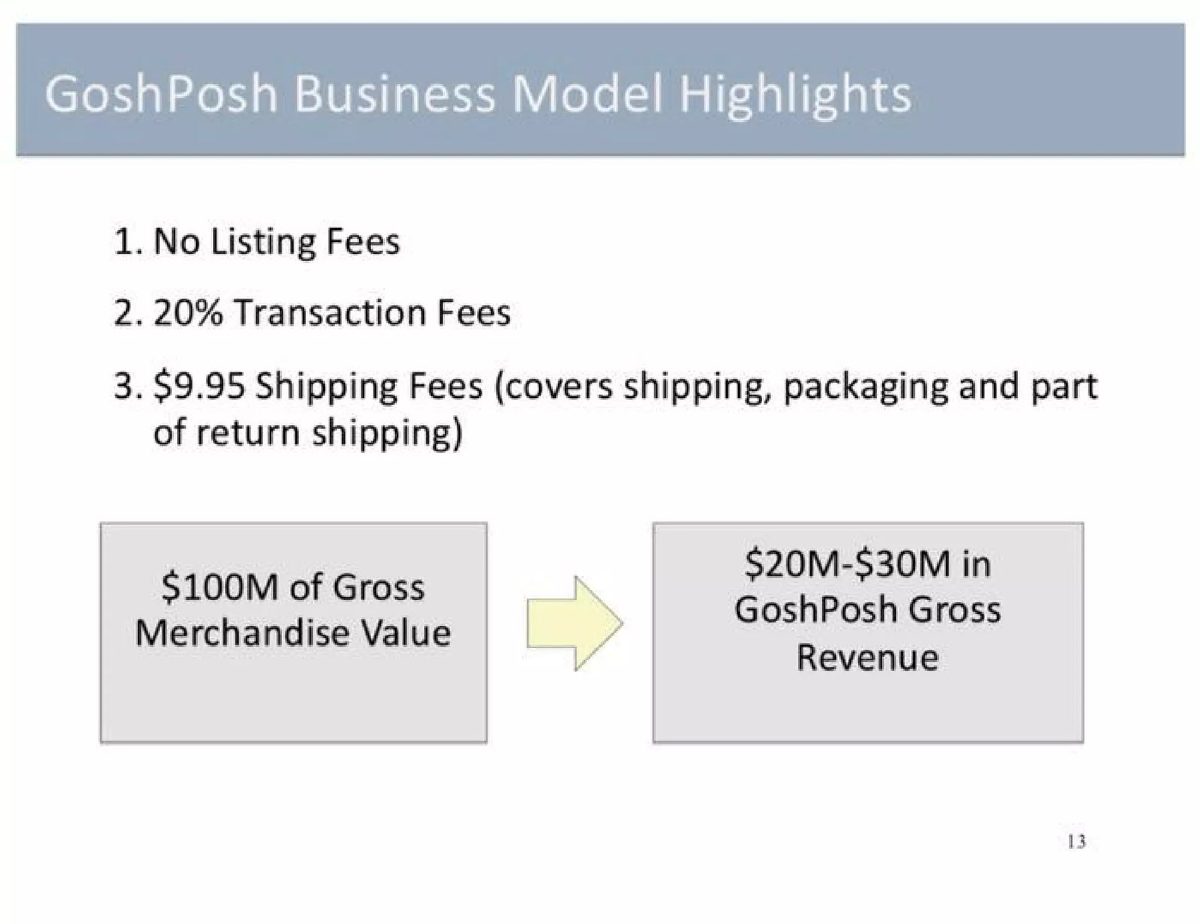
Poshmark's page 13, "GoshPosh Business Model Highlights", lists no listing fees, 20% transaction fees and a $9.95 shipping fee that "covers shipping, packaging and part of return shipping", then shows "$100M of Gross Merchandise Value" leading to "$20M-$30M in GoshPosh Gross Revenue". Our calculation: 20% of $100M is $20M, which is the low end. The only visible way to reach $30M is to count shipping fees as revenue, and the slide itself says that fee pays for shipping and packaging. At $9.95 per order, an extra $10M of revenue would need about one million orders, or an average order around $100 (our calculation); the slide does not give an order count. The upper figure is therefore mostly pass-through money, and the slide should say so.
Labels that turn take into profit, or GMV into revenue
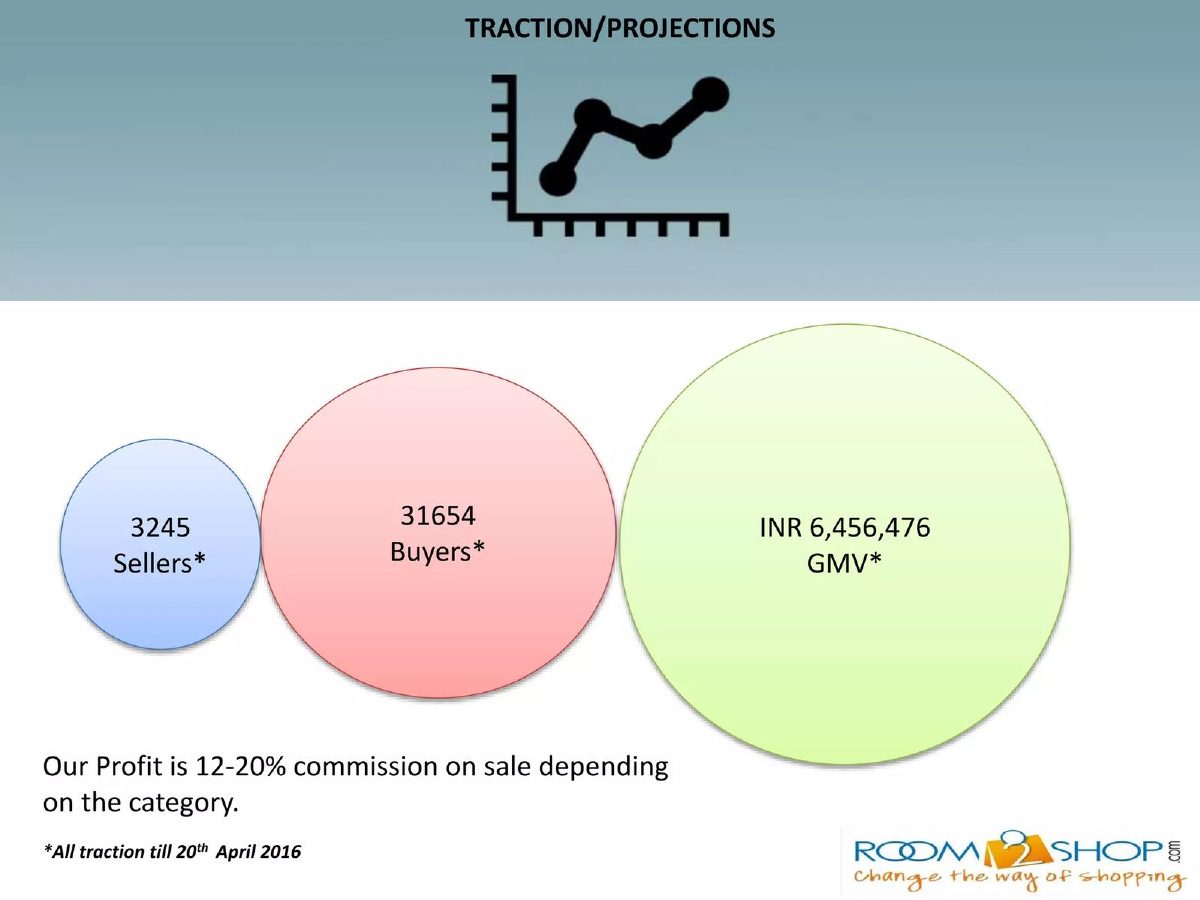
Room2Shop's page 16, "Traction/Projections", shows 3,245 sellers, 31,654 buyers and INR 6,456,476 GMV, all "till 20th April 2016", and says "Our Profit is 12-20% commission on sale depending on the category". Our calculation: at 12% to 20%, the commission on that GMV would be about INR 0.77M to 1.29M. The slide does not give that figure, and it calls the commission "profit". Commission is revenue; profit is what is left after the costs of running the marketplace. The slide also does not say what period the GMV covers.
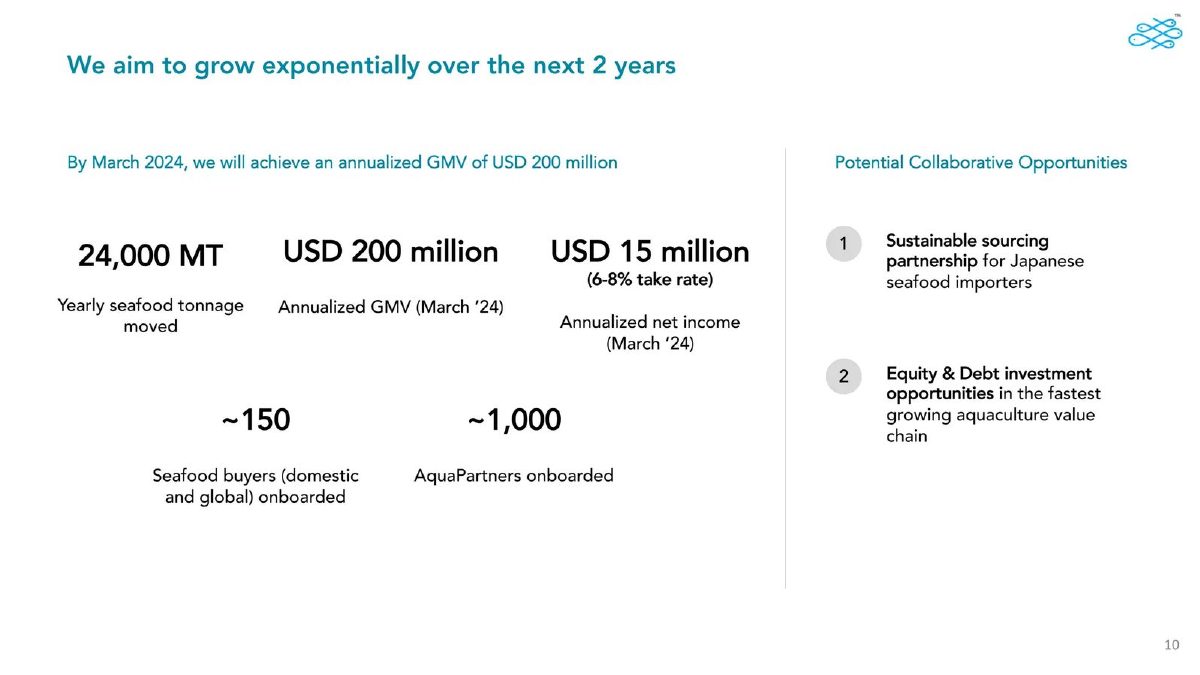
Wallet's page 10, "We aim to grow exponentially over the next 2 years", says "By March 2024, we will achieve an annualized GMV of USD 200 million" and shows "USD 15 million (6-8% take rate) Annualized net income (March '24)". Our calculation: 6% to 8% of $200M is $12M to $16M, and $15M implies a 7.5% take. The figures agree, but the label is wrong: the take on GMV is revenue, and net income is what remains after every cost. An investor reading "net income" would assume a profitable company. The figures are also a forecast, which the heading makes clear.
Qunomedical's page 4, "Happy patients lead to happy hospitals", charts "Total treatment revenue (GMV) through Qunomedical, EUR millions" from 2017 to 2021, with no values on the axis. Beside it the slide gives "300% YoY growth of revenue per top hospital delivered via Qunomedical", with a footnote that this is "as of 2021, based on Jan-Jun actuals, projected for full year 2021, top 10 clients". The chart title uses "revenue" for money the hospitals receive, and the growth figure uses "revenue" for the hospitals' revenue, not Qunomedical's. The footnote is honest about the projection and the top-ten sample. What the slide does not show is Qunomedical's own take.
Volume without a visible take
Clockwork's page 17, "We'll be at $250M GMV before our Series B", says "We've reached $24M in GMV on $4M in burn, a 6x capital-efficiency ratio" and plans $240M to $250M of GMV within 18 months of its Series A. A footnote says "Our GMV contains some revenue lines such as a SaaS subscription and management fees". Our note: GMV per dollar of burn is not a capital-efficiency measure in the usual sense, because GMV is not what the company keeps. The footnote is honest, but adding the company's own fees to its GMV makes the volume harder to compare with other marketplaces and hides the take rate. The slide gives no revenue figure.
Gearflow's page 10, "6x Growth Driven by Strong Organic Demand", shows "Annual GMV Run Rate", "10% Take Rate" and "April '21 GMV". In the public copy the GMV boxes and the chart are blank. A take rate is useful only with the volume it applies to; here the reader has the percentage but no base, so neither GMV nor revenue can be estimated. If numbers must be withheld, keeping the growth multiple and the take rate while hiding the base is a reasonable compromise, but the slide then establishes the take rate only.
Super.com's page 3 shows "~$1 Billion Annualized GMV" beside "~100% CAGR Net Revenue in 2018-2022", "80 Million+ Users" and "$150 Million+ Capital Raised". The slide gives a growth rate for net revenue but not the amount, so the reader cannot tell whether the company keeps 2% or 20% of that billion. Our note: when a slide chooses to give GMV as an amount and revenue only as a growth rate, the investor's first question will be the missing amount.
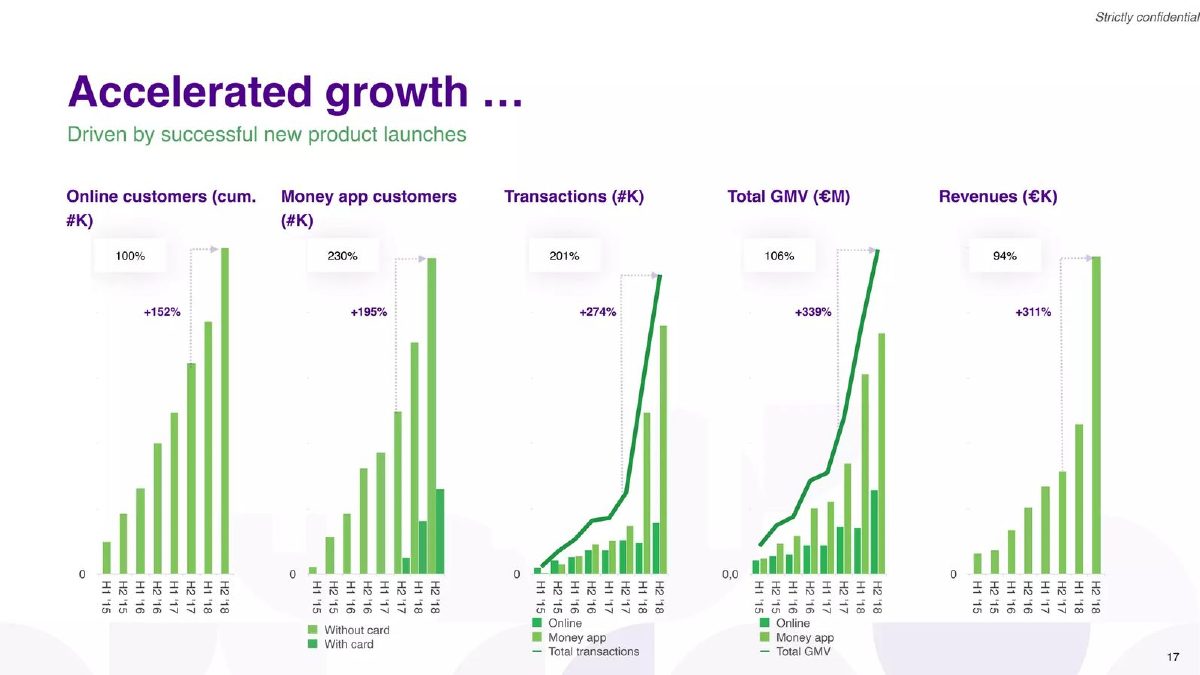
Twisto's page 17, "Accelerated growth", charts online customers, money-app customers, transactions, total GMV (EUR millions) and revenues (EUR thousands) from H1 2015 to H2 2018, with growth labels of +339% for GMV and +311% for revenue but no axis values. The two growth rates are close, which suggests a broadly stable take rate over the period. But without values the take rate itself cannot be calculated, and the difference in units, millions for GMV and thousands for revenue, is visible only in the small chart titles.
How to show GMV and revenue on your slide
Give three numbers together: the volume, the take rate and the revenue. Name the period and say whether the volume is actual, a run rate or a forecast. Check that the volume times the rate matches the revenue, and if it does not, explain why, for example subscription income, as ShopMy does, or fees that are not charged on every transaction.
If you book the full transaction as revenue, show net revenue or gross profit on the same slide and make it the figure you use for growth rates and multiples. State what your GMV contains: if it includes your own fees, shipping or subscriptions, say so, and ideally report them separately. Use accounting words carefully: commission and take are revenue, and "profit" or "net income" should appear only after costs.
When a take rate varies by category, give the range and the blended rate for the period shown. When you forecast GMV growth, say whether the take rate is assumed to stay the same, as ShopMy states at 2%. And if you have to hide some figures, keep the ones an investor can use to reason: the rate, the growth multiple and the period.
Common mistakes
GMV called revenue. Label volume as volume and show what you keep.
Gross revenue as the headline. Lead with net revenue if you book whole transactions.
Commission called profit. Commission is revenue; profit comes after costs.
Fees mixed into GMV. Report subscriptions and shipping separately.
Rate with no base. A take rate needs the volume it applies to.
Amount for one, rate for the other. Give GMV and revenue in the same form.
Diagnostic checklist
Volume, take rate and revenue appear together.
Each figure has a period and says actual, run rate or forecast.
Volume times rate matches revenue, or the gap is explained.
Gross and net revenue are labelled.
GMV contents are stated.
Pass-through fees are shown separately.
No commission or take is called profit or net income.
Frequently asked questions
Should I put GMV or revenue on my pitch deck?
Both, with the take rate linking them. ShopMy shows volume, rate and revenue that reconcile; Super.com gives GMV as an amount but revenue only as a growth rate.
What is a take rate?
Revenue divided by the transaction volume it comes from. Reflect's $15 on a $95 booking is 15.8% (our calculation).
Can I report gross revenue if I book the full transaction?
Yes, if that is your accounting, but show net revenue beside it and lead with net. Wirex's net revenue is 4% of its gross (our calculation).
Should shipping fees count as revenue?
Show them separately. Poshmark's upper revenue range depends on a shipping fee that mostly pays for shipping.
What if I don't want to reveal my GMV?
Keep the take rate, growth multiple and period visible, as Gearflow does, and accept that the slide will not establish scale.
How we chose these examples
Search (2026-09-30): the durable corpus index (docs/seo/artifacts/corpus-search, 70,729 unique pages, deduplicated by deck-file sha256 + page) was searched for "take rate" and for GMV, gross merchandise, gross booking or transaction volume within a short distance of revenue, commission or take; 44 pages matched after excluding public companies and SPACs.
Seventeen candidate pages were rendered from the original public deck files and read from the images; thirteen are used: ShopMy 18, Reflect 7, Leafly 20, Wirex 14, Naugo 20, Poshmark 13, Room2Shop 16, Wallet 10, Qunomedical 4, Clockwork 17, Gearflow 10, Super.com 3 and Twisto 17.
Left out after image review: Supliful 8 (revenue drivers but no revenue or take figure against its GMV goal) and Wallet 9 (same deck as Wallet 10; one example per deck). Not used because the page already appears in two other guides: Prolific 4. Not rendered: CorgiAI 10 (deck file unavailable), and market-size or product pages that mention GMV without the company's own figures.
Figures are as printed on each slide; we did not have the companies' underlying data. How we built this: drafted and checked with AI assistance (editorial model review against the original slide images); no human editor has reviewed this guide.