The reflect pitch deck from 2018 is a highly focused, 10-slide presentation that prioritizes clarity and specific marketplace metrics over narrative fluff. Operating in the mental health space, reflect positions itself as a data-driven bridge for in-person therapy. The deck effectively highlights a major industry pain point—that 80% of people do not find the right therapist—and counters it with a claimed 90% success rate. With $50k in monthly bookings and 20% month-over-month growth at the time of the pitch, the deck demonstrates early product-market fit in the Bay Area. While it lacks a form…
Key takeaways
- The deck identifies a massive inefficiency in the therapy market, citing $35 billion in lost revenue on slide 4.
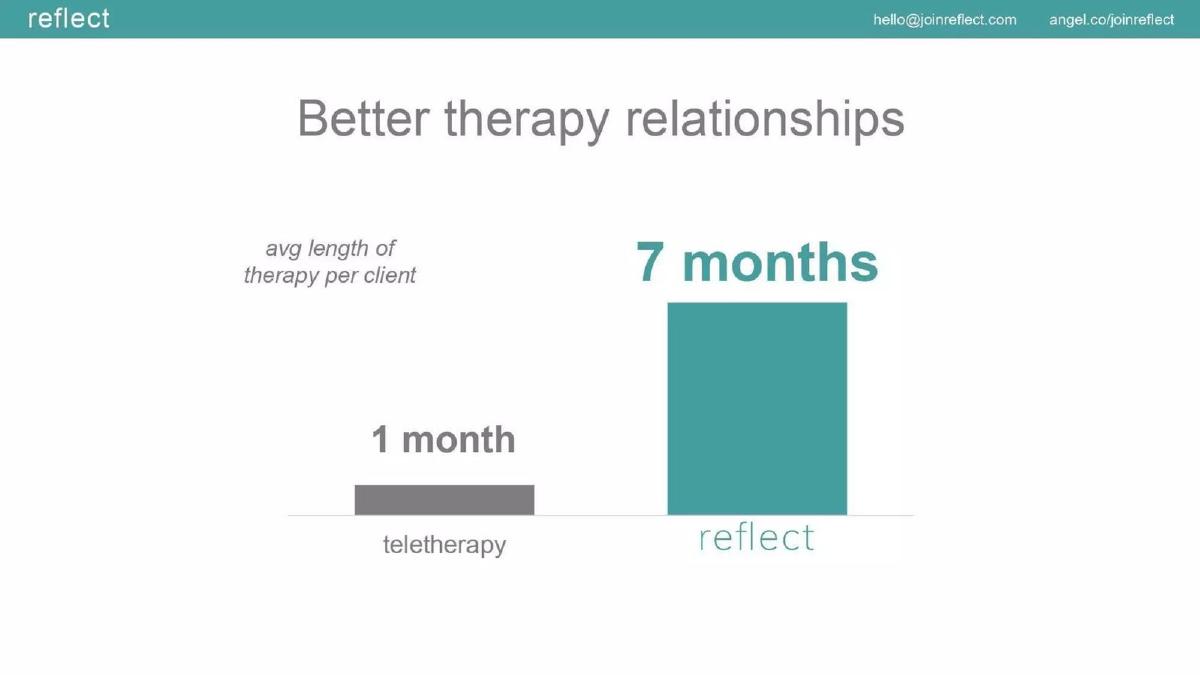
- Retention is the primary differentiator, with reflect claiming an average therapy length of 7 months compared to 1 month for teletherapy on slide 6.
- The business model is transparently stated as a $15 take rate on a $95 gross booking per session on slide 7.
- Early traction is localized but significant, reporting $50k in monthly bookings and 20% monthly growth on slide 8.
- The platform claims to solve the matching problem, citing that 80% of people typically fail to find the right therapist on slide 3.
- The team slide (slide 9) leverages high-signal logos including Amazon, Bain & Company, Stanford, and Kaiser Permanente to establish credibility.
- The deck is exceptionally brief at only 10 slides, omitting a traditional competition slide and a specific funding ask.
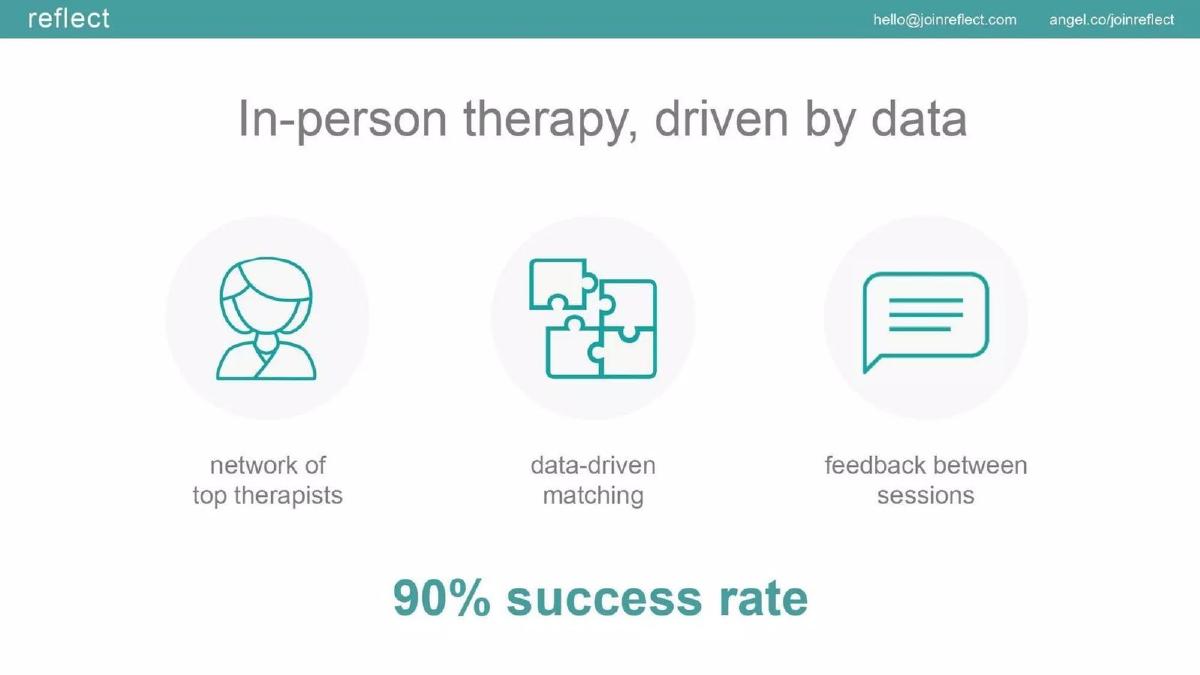
- Success is quantified through a 90% success rate in matching, driven by data-driven matching and feedback loops as shown on slide 5.
Introduction: The Power of Minimalist Marketplace Pitching
The 2018 pre-seed deck for reflect is a masterclass in brevity. In just 10 slides, the company manages to define a massive market gap, present a clear solution, and provide hard evidence of early traction. Founded by Jonathan TranPham, reflect positions itself not just as a directory, but as a data-driven platform for in-person therapy. At a time when teletherapy was beginning to surge, reflect doubled down on the efficacy of in-person sessions, using data to solve the 'matching problem' that plagues the mental health industry.
Slides 1-2: The Emotional Hook
Slide 1 is a standard title slide, introducing the company name 'reflect' and the tagline 'reimagining in-person therapy through data.' It identifies Jonathan TranPham as the founder and CEO. The design is clean, utilizing a teal and grey color palette that feels clinical yet approachable.
Slide 2 is a bold, single-sentence slide that reads 'I HAVE ANXIETY.' This serves as a visceral problem statement. It bypasses clinical definitions to speak directly to the user experience, immediately grounding the pitch in the reality of the consumer the platform serves.
Slides 3-4: Quantifying the Market Failure
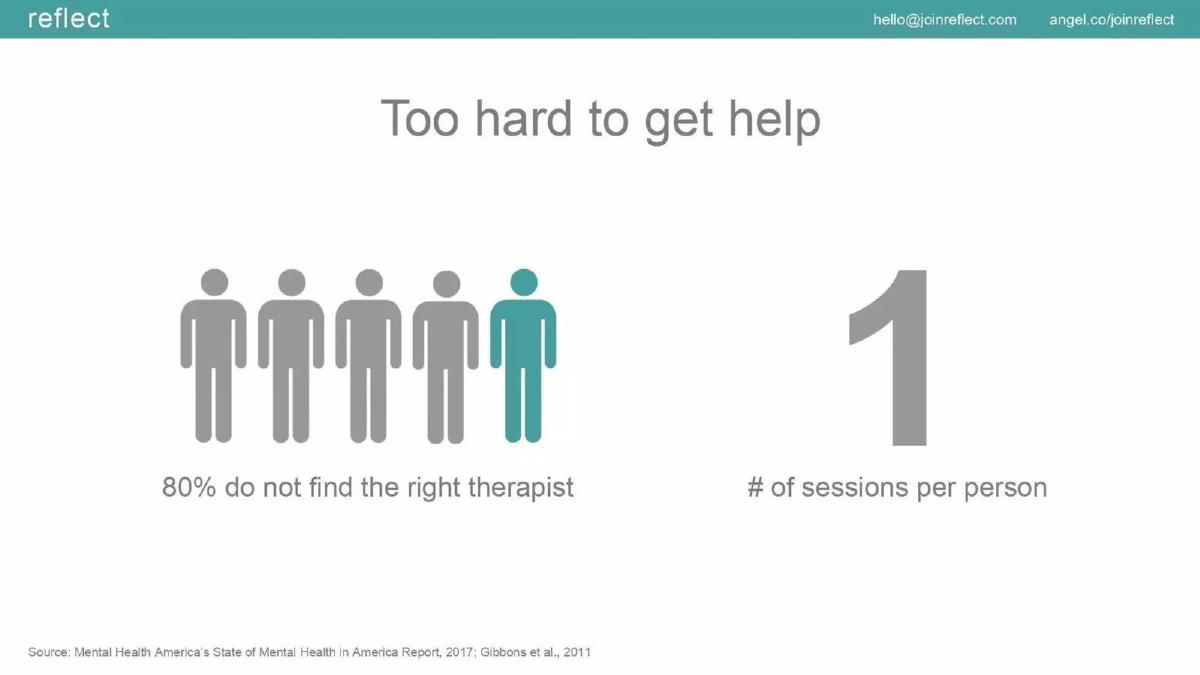
Slide 3 , titled 'Too hard to get help,' introduces the core friction in the industry. It cites two devastating statistics: 80% of people do not find the right therapist, and the average number of sessions per person is just one. By citing Mental Health America and Gibbons et al., the deck establishes that the current system is failing to facilitate long-term care because the initial match is poor.
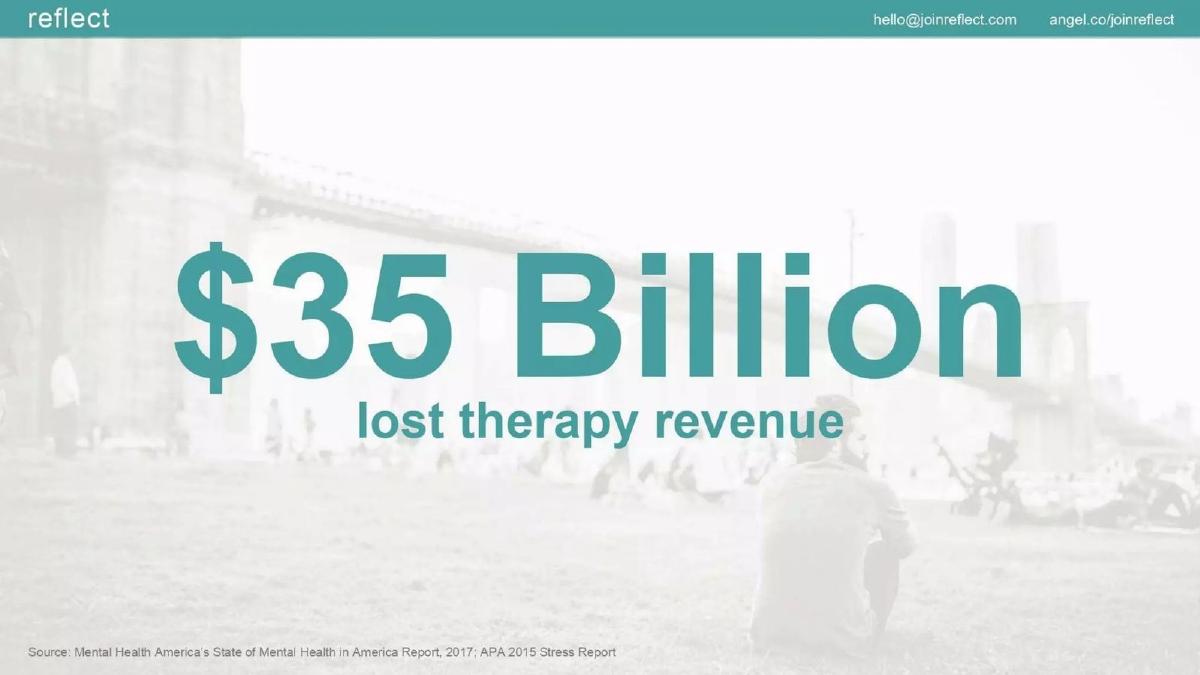
Slide 4 scales this problem up to a macro-economic level. Over a faded background of a person sitting in a park, the slide displays '$35 Billion lost therapy revenue.' This is a critical slide for investors; it transforms a social problem into a massive market opportunity. The implication is that by fixing the matching process, reflect can capture a portion of this 'lost' revenue by increasing the lifetime value of a therapy client.
Slide 5: The Data-Driven Solution
Slide 5 introduces the reflect platform under the header 'In-person therapy, driven by data.' The slide breaks the solution into three pillars: a network of top therapists, data-driven matching, and feedback between sessions. The most prominent figure on this slide is the '90% success rate,' which directly counters the 80% failure rate mentioned on slide 3. This is the 'aha' moment of the deck, suggesting that their algorithm has effectively solved the industry's biggest bottleneck.
Slide 6: The Retention Advantage
Slide 6 provides a direct comparison against the rising trend of teletherapy. Titled 'Better therapy relationships,' it uses a bar chart to show that the average length of therapy per client on reflect is 7 months, compared to just 1 month for teletherapy. This 7x increase in retention is a powerful metric. In a marketplace business, retention is the ultimate validator of product quality and the primary driver of unit economics.
Slides 7-8: The Business Model and Traction
Slide 7 details the 'Recurring revenue model.' It is refreshingly transparent. The deck states a $95 per session gross booking and a $15 per session reflect take rate. By labeling this as 'recurring,' the founders are highlighting that therapy is not a one-off transaction but a repeating service, making the $15 take rate significantly more valuable over the 7-month average lifespan of a client.
Slide 8 shows 'Significant traction in the Bay Area.' The company reports $50k in monthly bookings and 20% monthly growth. For a pre-seed round in 2018, these are strong numbers. It proves that the model works in a high-density urban market and provides a baseline for projecting future growth as they expand geographically.
Slide 9: Team and Credibility
Slide 9 covers the team: Jonathan TranPham (CEO), Libby Friede (Operations), and Daniel Huang (Engineering). Rather than long bios, the slide uses a 'wall of logos' to convey expertise. The logos include Amazon, Bain & Company, Everlane, Kaiser Permanente, and Genentech, alongside academic credentials from Stanford, Berkeley, and Dartmouth. This tells investors that the team has experience in high-growth consumer tech, healthcare systems, and top-tier strategy consulting.
Slide 10: The Summary Wrap-up
Slide 10 functions as a summary and contact slide. It repeats the three most impressive metrics: 7x length vs. teletherapy, $50k monthly bookings, and 20% monthly growth. The closing phrase, 'Let’s reflect,' is a clever play on the brand name. Notably, this slide includes contact information and an AngelList link but lacks a specific funding ask.
What Works in This Deck
Extreme Clarity: There is no jargon. The problem is 'it's too hard to get help,' and the solution is 'data-driven matching.' · Metric-Driven Narrative: Every claim is backed by a number. The 80% failure rate is countered by a 90% success rate. The 1-month teletherapy retention is countered by 7-month reflect retention. · Transparency: Many founders hide their take rate or gross margins in early decks. reflect puts the $15 fee front and center, allowing investors to quickly calculate the potential scale of the business. · Local Focus: By admitting the traction is currently limited to the Bay Area, the deck feels honest and grounded. It presents a successful pilot that is ready for scaling.
What Is Missing
The Ask: This is the most glaring omission. The deck does not state how much money is being raised, the valuation target, or how the funds will be allocated (e.g., hiring, marketing, geographic expansion). · Competitive Landscape: While it compares itself to 'teletherapy' generally, it doesn't name specific competitors or explain how it will defend its position against other matching platforms. · Product Deep-Dive: We see icons for 'data-driven matching,' but we don't see the actual interface or understand what specific data points are being used to create these successful matches. · Future Roadmap: The deck is very focused on the 'now.' It lacks a slide showing where the company intends to be in 3-5 years or how it moves beyond the Bay Area.
What a Founder Should Copy
The '1 vs 7' Retention Slide: If you have a metric that is 7x better than the industry standard, give it its own slide. It is the most compelling reason to invest. · The Problem/Solution Symmetry: Use the same metric to describe the problem and the solution. If the problem is an 80% failure rate, the solution must be a high success rate. This creates a satisfying narrative arc. · Minimalist Design: This deck proves you don't need 50 slides. If your business model is sound and your traction is real, 10 slides are enough to get a meeting. · Logo Credibility: If your team has worked at recognizable companies, use the logos. They act as a shorthand for 'this person has been vetted by a rigorous hiring process.'
Frequently asked questions
- What is the core problem reflect is trying to solve?
- According to slides 3 and 4, the core problem is the difficulty of finding the right therapist and the resulting economic loss. The deck states that 80% of people do not find the right therapist on their first try, leading to an average of only one session per person. This inefficiency results in an estimated $35 billion in lost therapy revenue annually.
- How does reflect's business model work?
- Slide 7 outlines a straightforward marketplace revenue model. The platform handles gross bookings of $95 per therapy session. From this amount, reflect takes a $15 fee (approximately a 15.8% take rate), while the remainder presumably goes to the therapist. The deck describes this as a 'recurring revenue model,' likely referring to the repeat nature of therapy sessions.
- What metrics does the deck use to prove product-market fit?
- The deck relies on three primary metrics: volume, growth, and retention. Slide 8 highlights $50,000 in monthly bookings and a 20% monthly growth rate in the Bay Area. Slide 6 emphasizes retention, showing that reflect clients stay in therapy for an average of 7 months, which is 7x longer than the 1-month average for teletherapy.
- Who are the founders and what is their background?
- Slide 9 introduces the team: Jonathan TranPham (Founder/CEO), Libby Friede (Operations), and Daniel Huang (Engineering). While individual roles are brief, the slide includes a 'wall of logos' representing their collective experience at prestigious institutions like Everlane, Bain & Company, Amazon, Kaiser Permanente, Stanford, and Berkeley.
- What is missing from this pitch deck?
- The deck is missing several standard components, most notably a specific 'Ask' slide detailing how much capital is being raised and how it will be used. It also lacks a competitive landscape analysis, a detailed product roadmap, and a long-term vision for scaling beyond the Bay Area, though the traction slide implies a successful local pilot.