Aquaconnect's December 2021 pitch deck outlines a sophisticated 'full-stack' approach to the aquaculture industry, positioning itself as a fintech-enabled ecosystem. By integrating input retail (AquaPartner), output fulfillment (AquaBazaar), and a data-driven financing layer (AquaCred), the company addresses the historical lack of credit in the sector. The deck is data-heavy, showcasing a 9X revenue growth from June to November 2021 and providing granular unit economics, including blended margins of 12% for input retail. The $15 million Series A ask is clearly allocated toward product develop…
Key takeaways
- The company identifies as a full-stack fintech platform specifically for the aquaculture industry, as stated on slide 1.
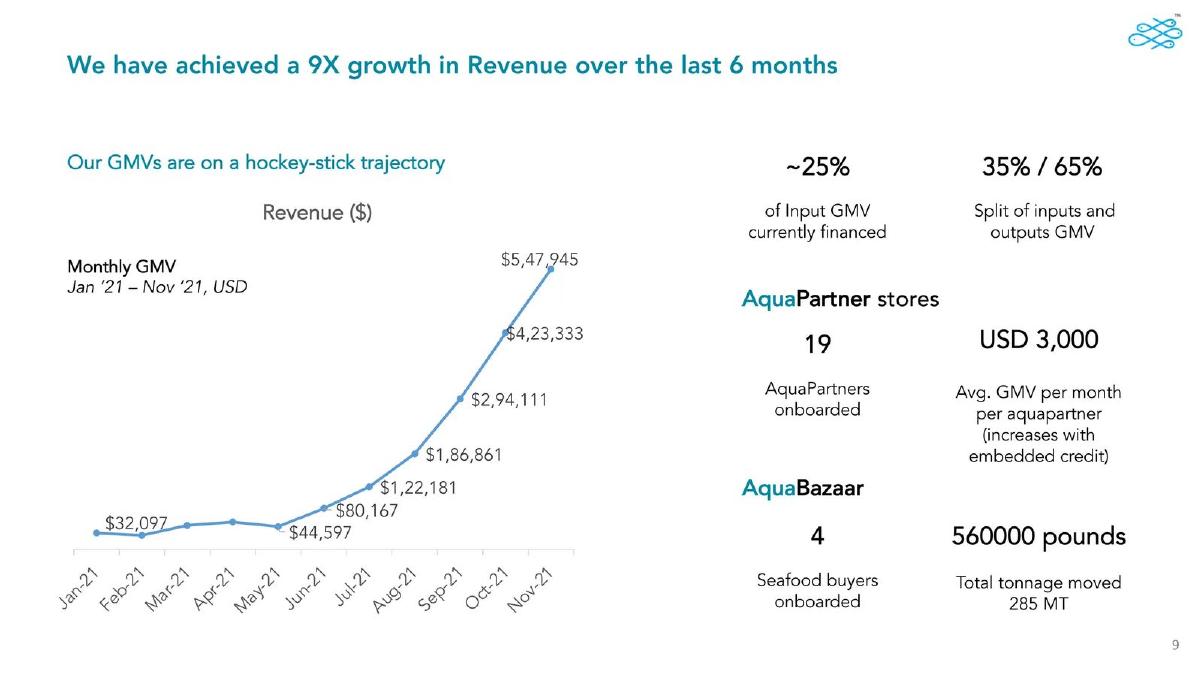
- Revenue grew 9X over a six-month period in 2021, reaching $547,945 in monthly GMV by November, according to slide 9.
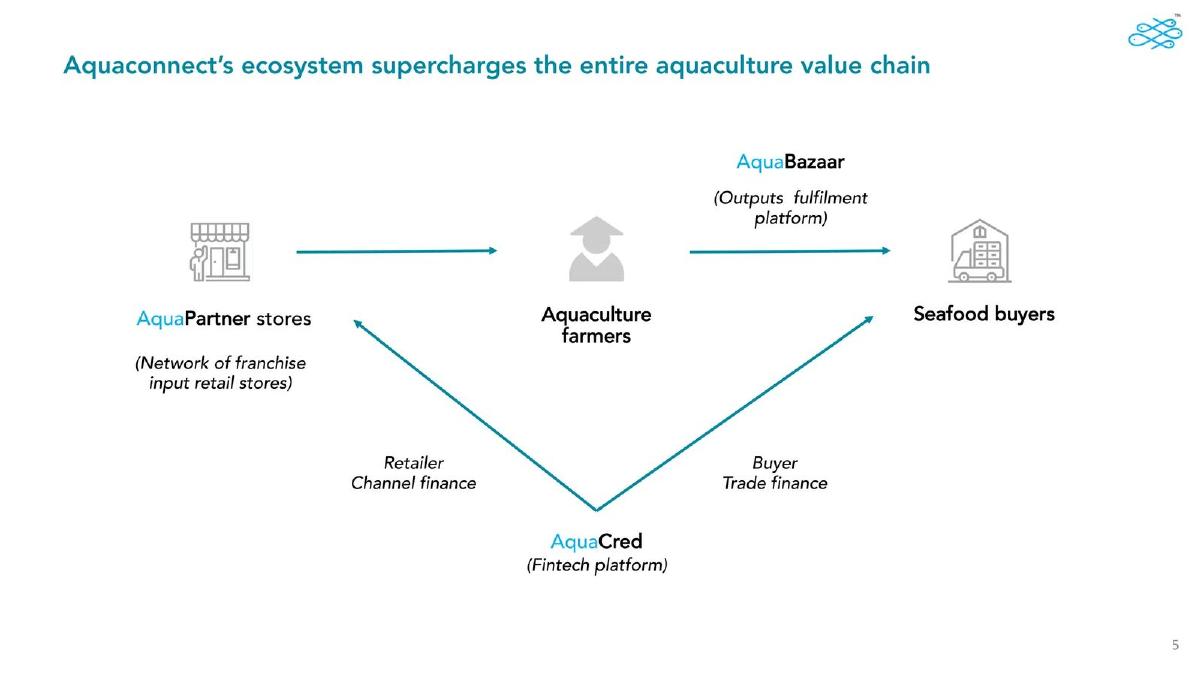
- The business model relies on three core pillars: AquaPartner stores for inputs, AquaBazaar for output fulfillment, and AquaCred for fintech services, as illustrated on slide 5.
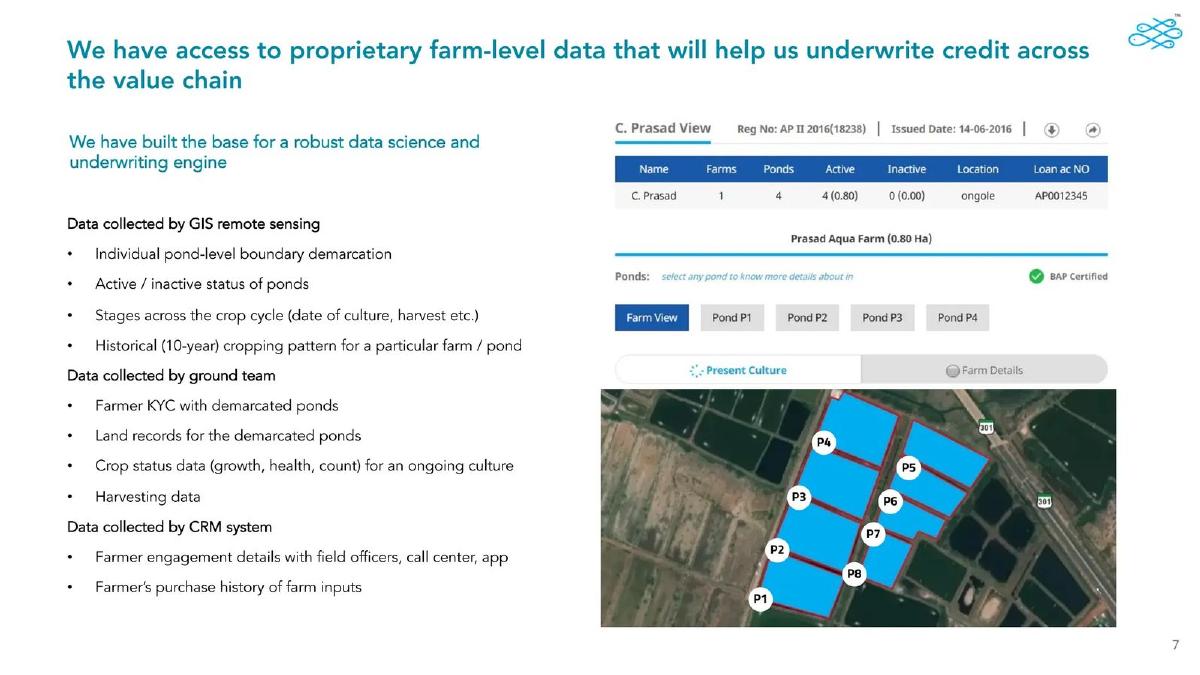
- Underwriting is powered by proprietary data including GIS remote sensing for pond demarcation and 10-year historical cropping patterns, detailed on slide 7.
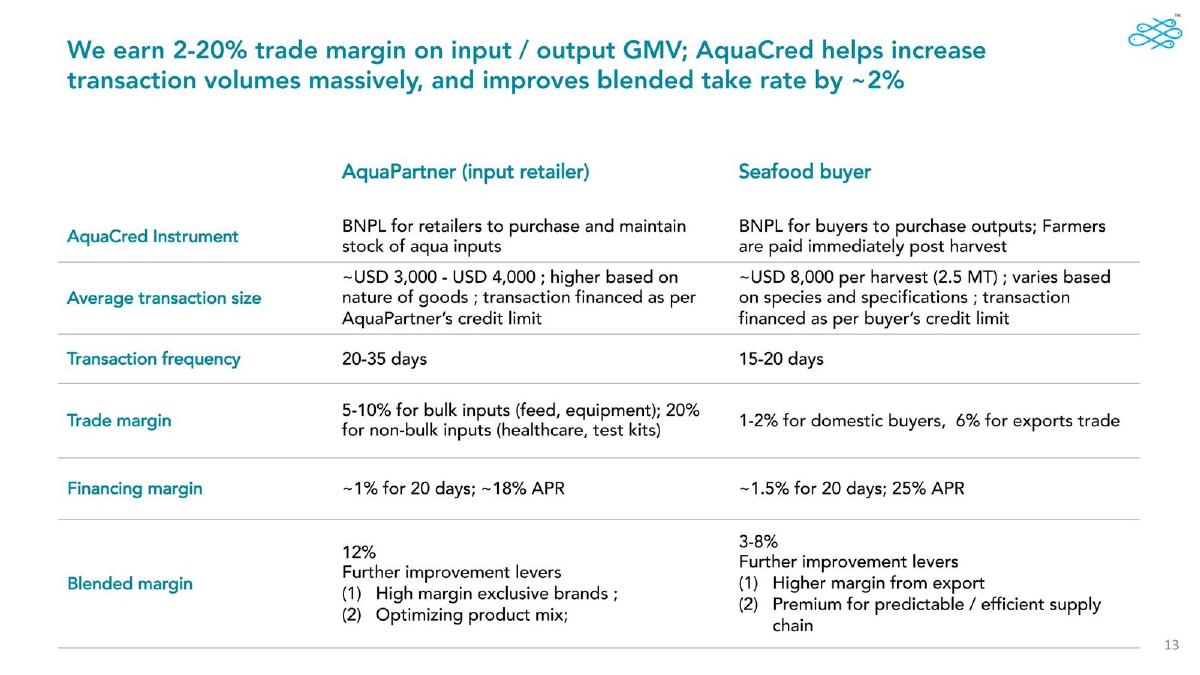
- The company earns trade margins ranging from 2% to 20% on GMV, with AquaCred adding a ~2% blended take rate improvement, as shown on slide 13.
- Financing margins are significant, with an 18% APR for input retailers and a 25% APR for seafood buyers, per slide 13.
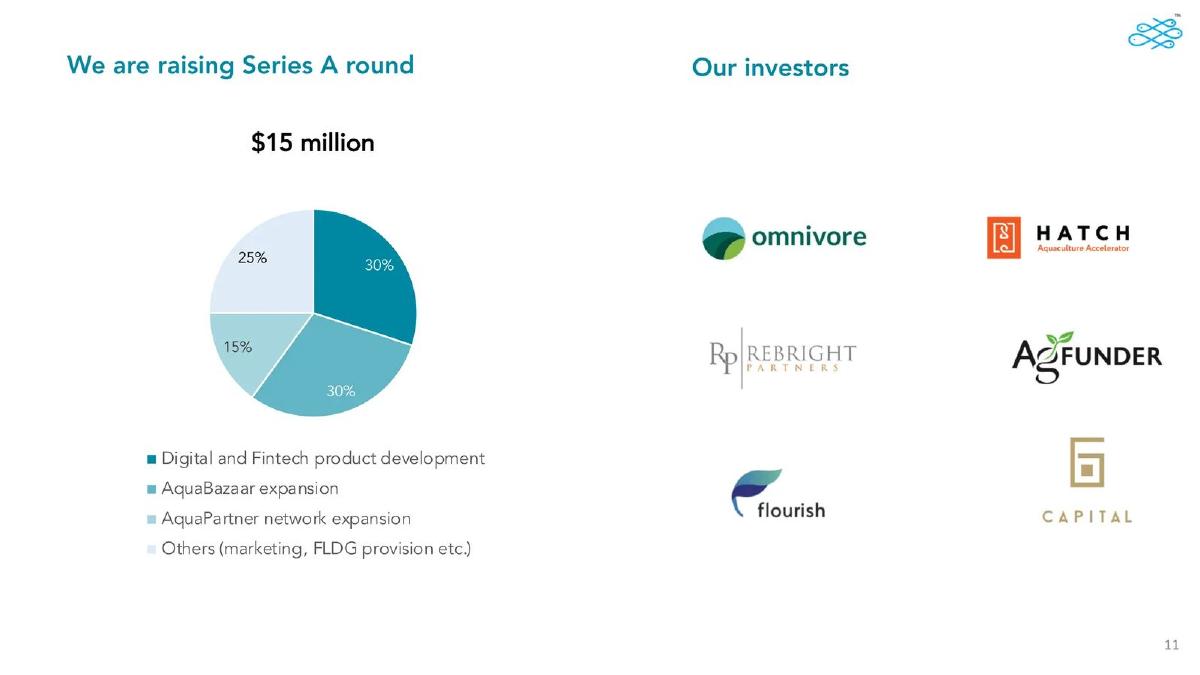
- The Series A ask is $15 million, with 30% allocated to digital/fintech product development and 30% to AquaBazaar expansion, as noted on slide 11.
- Existing investors include Omnivore, Rebright Partners, Flourish, Hatch, AgFunder, and 6 Capital, listed on slide 11.
Aquaconnect Pitch Deck Analysis
The Aquaconnect pitch deck from December 2021 is a masterclass in vertical fintech positioning. Rather than presenting as a simple marketplace or a standard lender, the company frames itself as a 'full-stack' ecosystem that controls the data flow across the entire aquaculture value chain. This teardown examines the 14-slide deck (7 of which were provided for analysis) to understand how they bridge the gap between traditional farming and modern financial services.
Slide 1: Title and Positioning
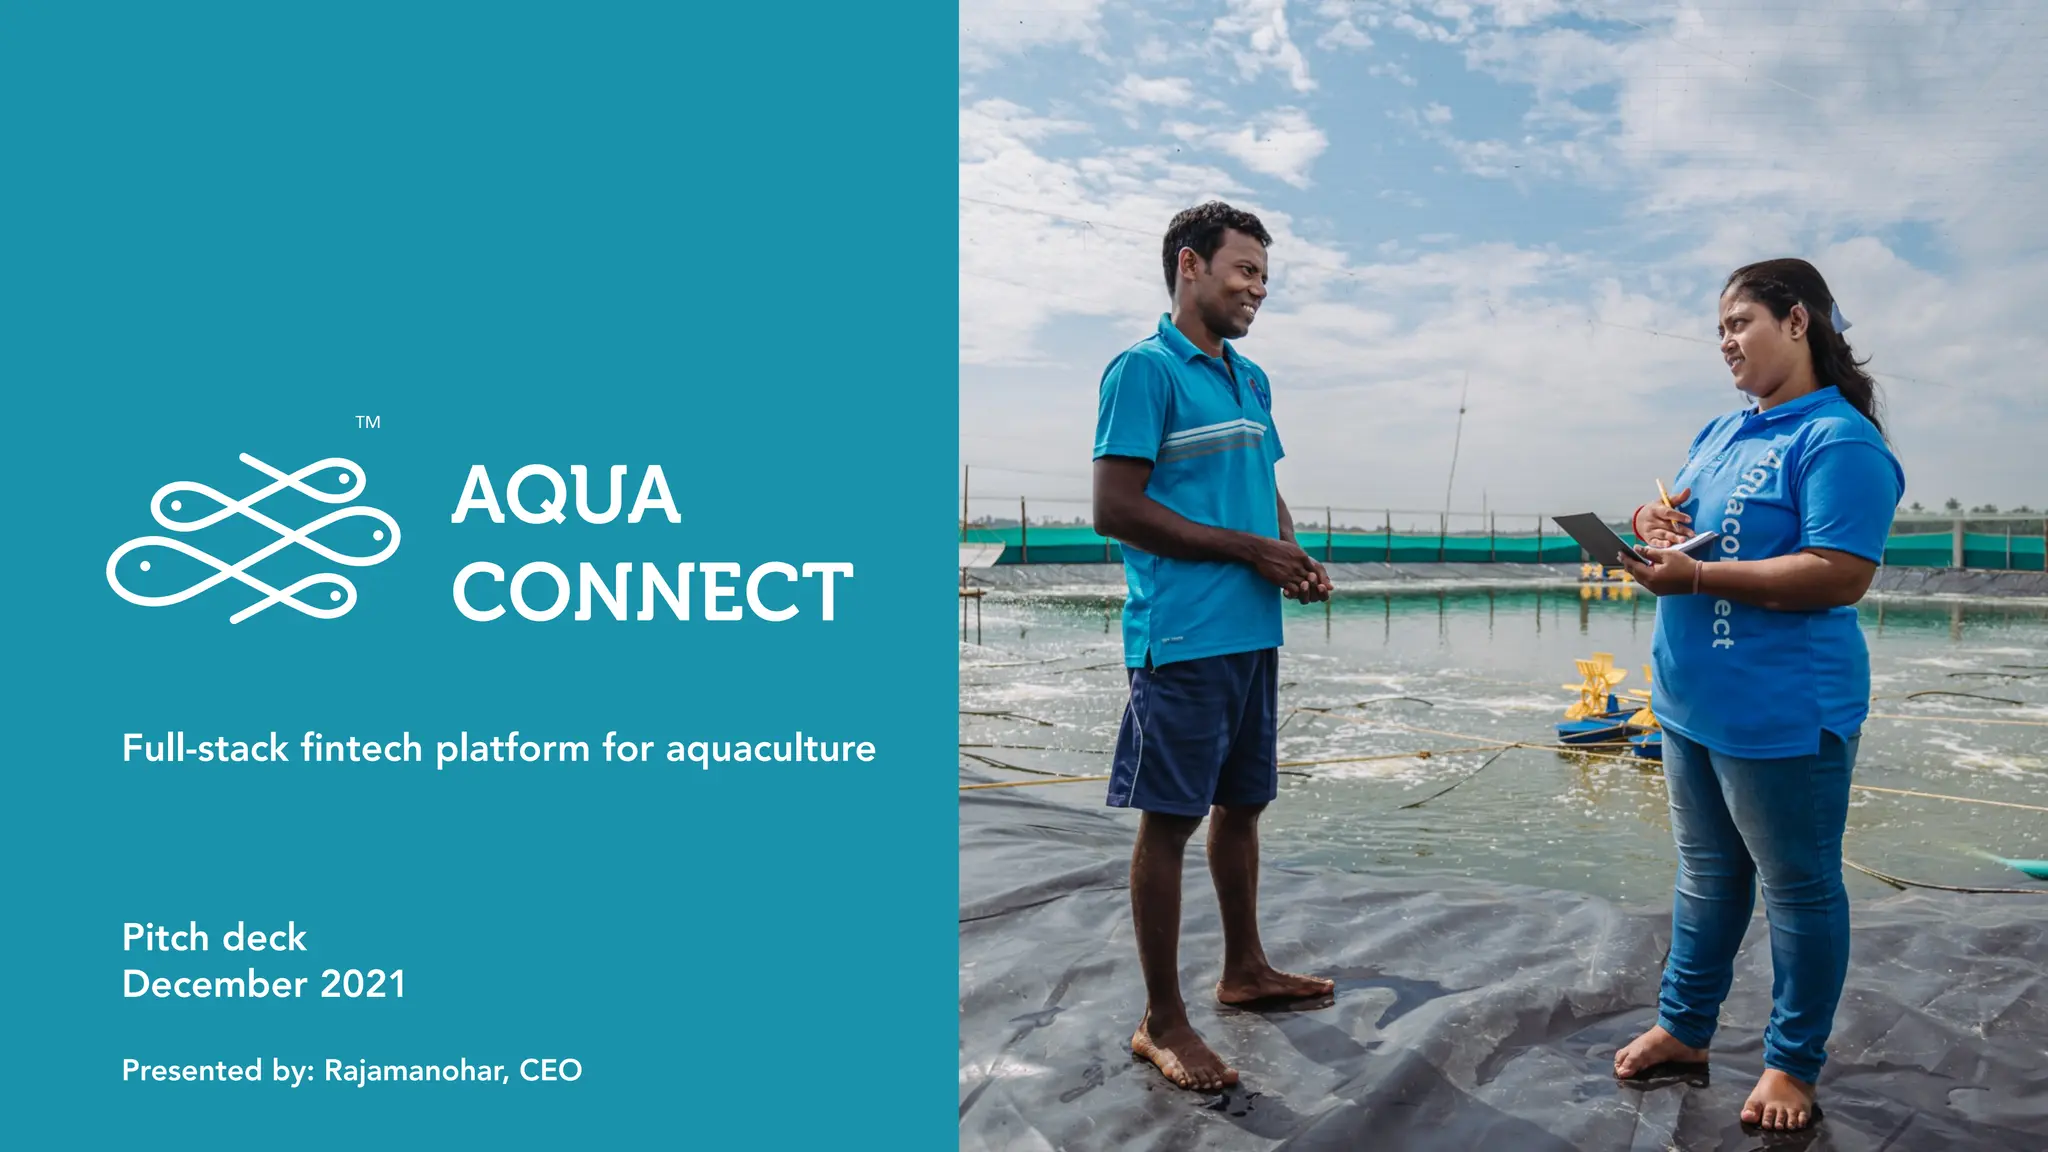
The cover slide establishes a clear identity: "Full-stack fintech platform for aquaculture." By using the term 'full-stack,' the company signals that it handles everything from the physical retail of inputs to the digital underwriting of loans. The presentation is attributed to Rajamanohar, CEO, and is dated December 2021. The imagery features a field officer and a farmer, grounding the high-tech 'fintech' claim in the reality of rural pond-side operations.
Slide 3: Visual Proof of Operations
Slide 3 is a montage of real-world operations. It shows an 'AquaPartner' storefront with branding in local script and a toll-free number, alongside a field officer in uniform standing next to crates of harvested shrimp. This slide serves as 'social proof' or operational validation, demonstrating that the company is not just a software concept but has a tangible physical presence in the farming clusters it serves.
Slide 5: The Ecosystem Map
This slide is the architectural heart of the deck. It maps the flow of goods and capital between three main entities: AquaPartner stores (franchise input retail), Aquaculture farmers , and Seafood buyers . The 'supercharger' for this entire chain is AquaCred , the fintech platform that provides retailer channel finance and buyer trade finance. AquaBazaar is identified as the 'outputs fulfillment platform.' This visual successfully explains a complex multi-sided marketplace in a single, digestible diagram.
Slide 7: Data and Underwriting
Slide 7 addresses the 'moat' and the 'how.' The company claims access to proprietary farm-level data to underwrite credit. They break their data collection into three categories:
GIS remote sensing: Used for pond demarcation, tracking crop cycles, and analyzing 10-year historical cropping patterns. · Ground team: Responsible for Farmer KYC, land records, and real-time crop status (growth, health, count). · CRM system: Tracks farmer engagement and purchase history of farm inputs.
The slide includes a screenshot of the 'C. Prasad View,' showing a dashboard that tracks specific ponds (P1 through P8) with BAP Certification status and loan account numbers. This level of granular detail is highly persuasive for investors concerned about the risks of lending to unorganized agricultural sectors.
Slide 9: Traction and Growth
The traction slide shows a classic 'hockey-stick' trajectory. Monthly GMV grew from $32,097 in January 2021 to $547,945 in November 2021 . The slide highlights a 9X growth in revenue over the final six months of that period. Key metrics provided include:
~25% of Input GMV is currently financed. · 35% / 65% split between input and output GMV. · 19 AquaPartner stores onboarded. · 560,000 pounds (285 MT) of total tonnage moved. · USD 3,000 average GMV per month per AquaPartner.
Slide 11: The Ask and Investor Base
Aquaconnect is seeking $15 million for its Series A . The allocation is precise: 30% for digital/fintech development, 30% for AquaBazaar expansion, 15% for AquaPartner network expansion, and 25% for marketing and FLDG provisions. The right side of the slide displays a strong cap table for an agritech startup, featuring sector-specialist investors like Omnivore, Hatch, and AgFunder , alongside fintech-focused Flourish and others like Rebright Partners and 6 Capital.
Slide 13: Unit Economics and Margins
This is perhaps the most critical slide for a fintech teardown. It breaks down the 'Blended Margin' for both sides of the marketplace. For AquaPartner (input retail), they earn a 5-10% trade margin on bulk inputs and 20% on non-bulk items, plus an 18% APR on financing, resulting in a 12% blended margin . For seafood buyers, the trade margin is 1-6%, with a 25% APR on financing, resulting in a 3-8% blended margin . The slide also lists 'improvement levers' such as high-margin exclusive brands and optimizing product mix, showing a clear path to increased profitability.
What Works in This Deck
Specific Industry Verticalization: The deck doesn't try to be a general 'agri-fintech' play. It focuses exclusively on aquaculture, which allows it to go deep on industry-specific metrics like 'pond-level boundary demarcation' and 'tonnage moved.' This specificity builds founder authority.
Data-Backed Underwriting: By showing the actual GIS mapping and the 'C. Prasad' dashboard, the founders prove they aren't just guessing on credit risk. They have built a proprietary data moat that would be difficult for a traditional bank to replicate.
Clear Monetization: Slide 13 is exceptionally transparent. It shows exactly how they make money on both the movement of goods and the movement of capital. Investors appreciate seeing APRs and trade margins laid out side-by-side.
What Is Missing
Team Slide: In the provided 7 slides, there is no team slide. While the cover mentions the CEO, the background of the founding team and their specific expertise in aquaculture or fintech is not detailed. For a Series A, the 'why this team' is usually as important as the 'what.'
Competitive Landscape: There is no mention of other agritech players in India or Southeast Asia. Investors would likely want to know how Aquaconnect differentiates itself from other farm-to-fork or agri-lending platforms.
Risk Mitigation: While they mention FLDG (First Loss Default Guarantee) in their fund allocation, the deck doesn't explicitly discuss default rates or how they handle crop failure (e.g., shrimp disease), which is a major risk in aquaculture.
What a Founder Should Copy
The 'Ecosystem' Visualization: Use a diagram like Slide 5 to show how your different product lines (retail, marketplace, finance) interact. It helps investors see the 'flywheel' effect where one service drives data for the next.
Granular Unit Economics: Don't just give a 'take rate.' Break it down into trade margins and financing margins as seen on Slide 13. This shows you have a deep understanding of your revenue levers.
Operational Imagery: Including photos of branded stores and field staff (Slide 3) makes the business feel 'real' and demonstrates execution capability beyond just writing code.
Frequently asked questions
- What is the primary problem Aquaconnect is solving?
- While a specific 'Problem' slide is not in the provided set, the deck implies the problem is the lack of credit and efficiency in the aquaculture value chain. By using proprietary data to underwrite credit (slide 7), they address the financial gap that prevents farmers from scaling or accessing high-quality inputs and buyers.
- How does Aquaconnect collect data for its underwriting engine?
- According to slide 7, the company uses a three-pronged data collection strategy: GIS remote sensing for pond boundaries and crop cycles, a ground team for KYC and land records, and a CRM system to track farmer engagement and purchase history.
- What are the specific revenue streams for the platform?
- Revenue is generated through two main channels detailed on slide 13: trade margins (5-20% on inputs like feed and equipment; 1-6% on seafood outputs) and financing margins (18% APR for retailers and 25% APR for buyers). They also target a blended margin of 12% for their AquaPartner segment.
- How much capital is Aquaconnect raising and for what purpose?
- Slide 11 states a Series A ask of $15 million. The funds are split: 30% for Digital and Fintech product development, 30% for AquaBazaar expansion, 15% for AquaPartner network expansion, and 25% for 'Others' which includes marketing and FLDG (First Loss Default Guarantee) provisions.
- What is the current scale of the AquaPartner and AquaBazaar networks?
- As of November 2021, slide 9 reports 19 AquaPartner stores onboarded and 4 seafood buyers onboarded via AquaBazaar. The platform had moved a total of 560,000 pounds (285 MT) of tonnage at that time.