Developer Tools Competition Slides: 9 Real Pitch Deck
How developer tools and infrastructure startups show competition in a pitch deck: a build-vs-buy table, named incumbents with market share.
Developer Tools Competition Slide: Beat Building It In-House, Then the Incumbents
For developer tools and infrastructure, the first rival is often the customer's own engineering team: they can build it in-house. The second is a large incumbent the buyer already pays. A good competition slide deals with both, in terms an engineering or IT buyer can check. This guide compares nine real competition slides from decks tagged developer tools in our library, from a build-vs-buy table to a slide that says competitors will become collaborators.
TL;DR
Show why buying beats building, then name the incumbents and where each is limited. CommandBar compares its product with a do-it-yourself version on five rows. COMSovereign names six telecom equipment makers with market shares and each one's limitation. Chotmai sets Dropbox and Slack against its local features. Pinwheel claims about 80% data coverage against about 40% for competitors. Tracer describes rivals as software or consulting only, and NorCal says competitors can be turned into collaborators. Of the three added examples, KNIME names spreadsheets, Python and R as its main "competition", Ascend gives its view of each rival category, including which could become partners and which could move into its space, and Apifier groups web-scraping rivals by type, including free developer libraries.
Developer tools competition slides from real pitch decks
Each example shows the exact stored slide above its analysis and links to the full teardown. The most complete comparisons come first; weaker ones follow for contrast. Claims are as shown on the slides; comments are ours.
CommandBar competition slide — slide 6
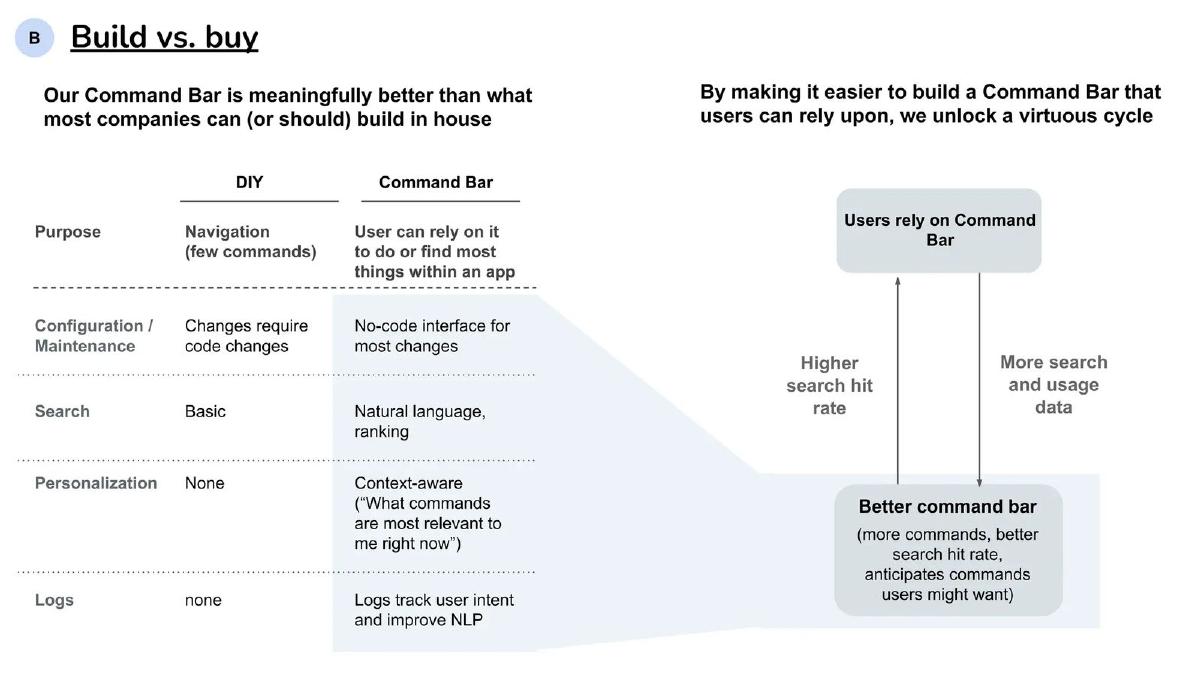
Embeddable in-app search and command bar for software products. Slide titled "Build vs. buy".
CommandBar deck, slide 6. Exact stored slide matched to this analysis.
Our analysis: It names the real alternative, the customer's own engineers, and compares on the rows they would weigh.
Evidence and limitation: No figures, such as engineering time saved or search hit rate.
What a founder can adapt: Keep the build-vs-buy table and add one cost row, such as engineer-weeks to build and maintain, with how you estimated it.
Supporting analysis
What the deck claims: "Our Command Bar is meaningfully better than what most companies can (or should) build in house." DIY vs Command Bar. Purpose: "Navigation (few commands)" vs "User can rely on it to do or find most things within an app". Configuration/Maintenance: "Changes require code changes" vs "No-code interface for most changes". Search: "Basic" vs "Natural language, ranking". Personalization: "None" vs "Context-aware". Logs: "none" vs "Logs track user intent and improve NLP". A loop diagram: users rely on it, more search data, better command bar, higher hit rate.
Presentation choice: Buyers of developer tools ask "why not build it?" first; answering row by row, including maintenance, is more persuasive than listing vendors.
When it does not fit: Leaving out commercial rivals entirely; add a line on other vendors a buyer might evaluate.
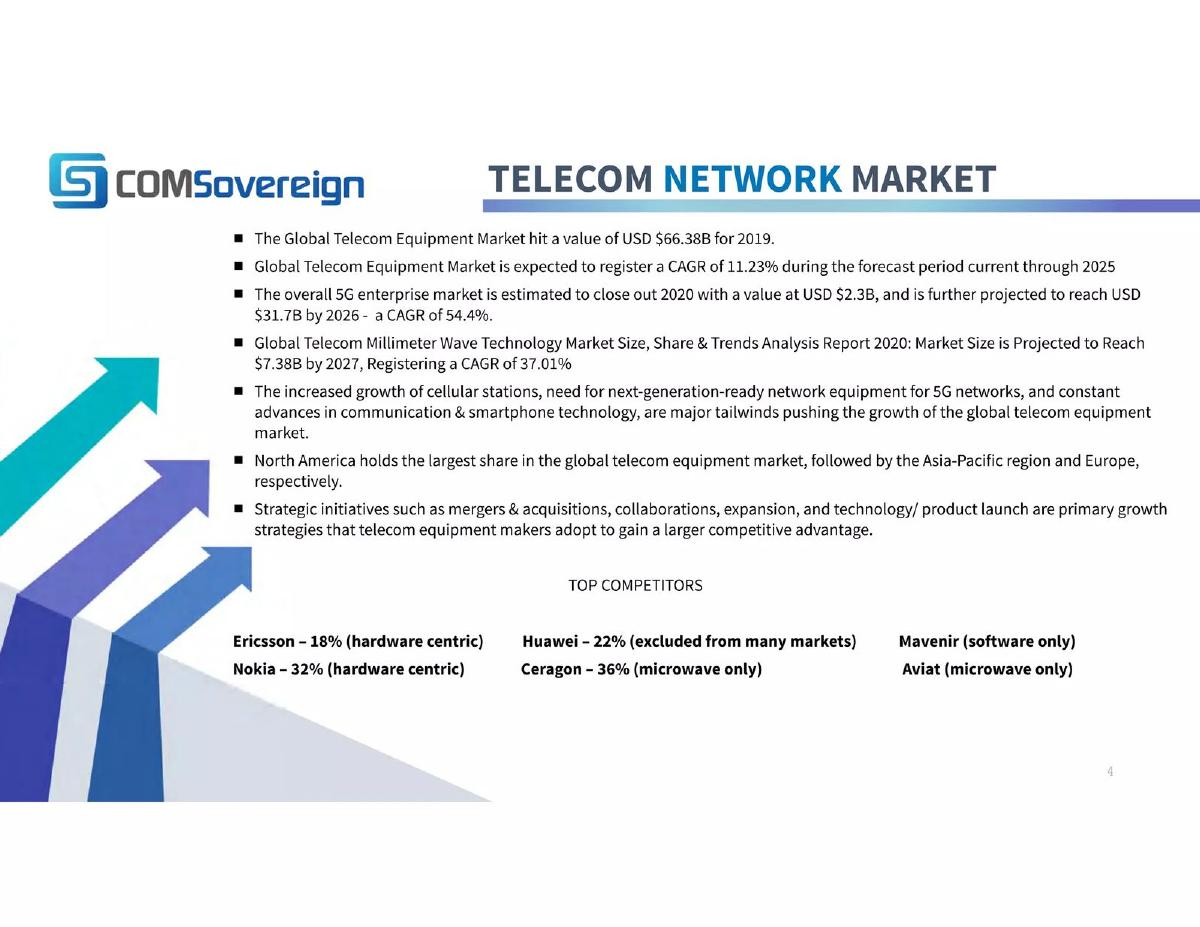
Telecom network equipment maker, tagged as developer tools in our library. Slide titled "Telecom Network Market", with a "Top Competitors" line.
COMSovereign deck, slide 4. Exact stored slide matched to this analysis.
Our analysis: It names six incumbents and gives each a short limitation, which implies where COMSovereign fits.
Evidence and limitation: The percentages add up to more than 100% and no market is stated for them, so they seem to measure different segments. No source is given for the shares.
What a founder can adapt: Keep one line per incumbent with its limit, state which market each share refers to and its source, and add your own row.
Supporting analysis
What the deck claims: Market bullets, including "The Global Telecom Equipment Market hit a value of USD $66.38B for 2019." Top competitors: "Ericsson – 18% (hardware centric)", "Nokia – 32% (hardware centric)", "Huawei – 22% (excluded from many markets)", "Ceragon – 36% (microwave only)", "Mavenir (software only)", "Aviat (microwave only)".
Presentation choice: Short labels like "hardware centric" or "microwave only" tell an investor the gap quickly; the unexplained shares weaken it.
When it does not fit: Market shares from different segments side by side without saying so.
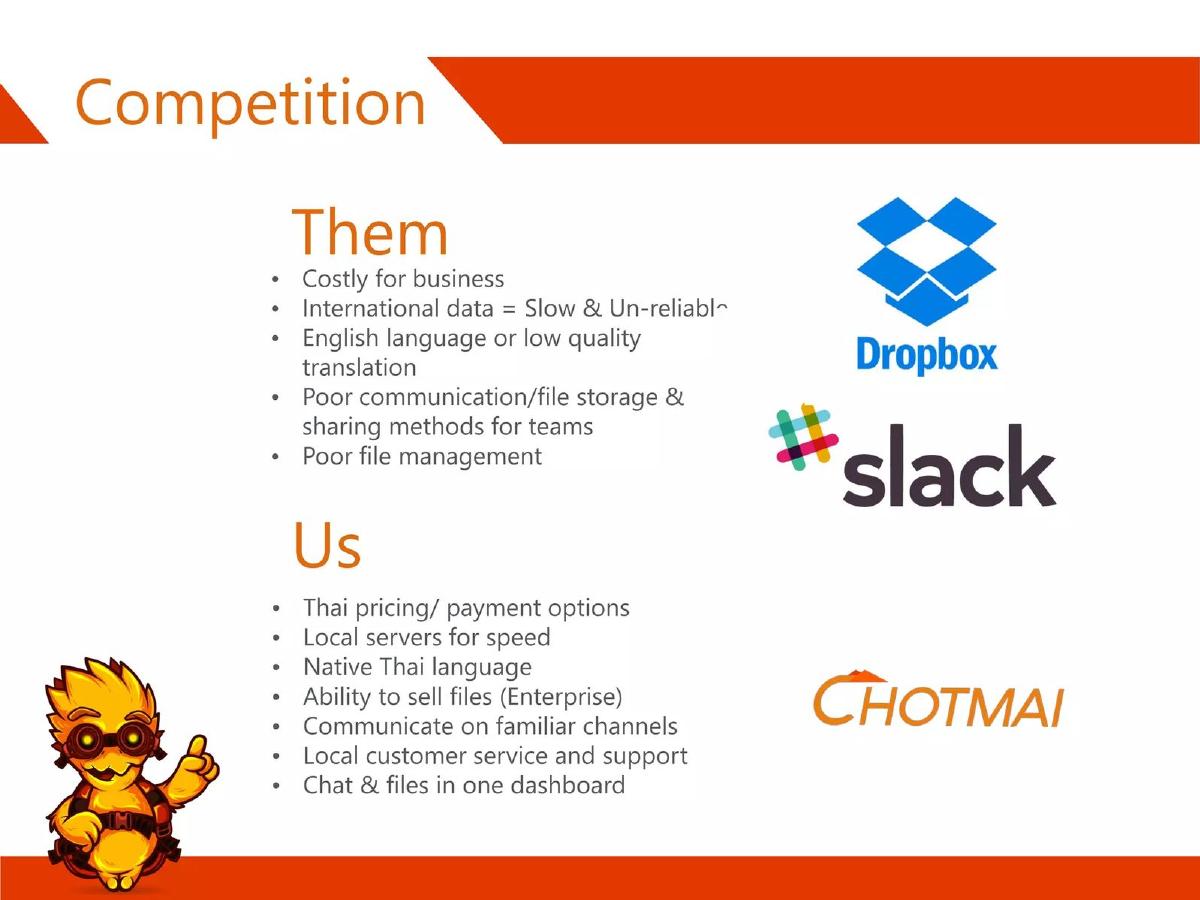
Team chat and file sharing for Thai businesses, tagged as developer tools in our library. Slide titled "Competition".
Chotmai deck, slide 6. Exact stored slide matched to this analysis.
Our analysis: It names the two global tools its buyers already use and competes on local needs: language, payment and server location.
Evidence and limitation: No prices, speeds or customer figures.
What a founder can adapt: Add one measured row, such as price per user in baht or file load time from Bangkok, and name any Thai competitors.
Supporting analysis
What the deck claims: "Them" (Dropbox, Slack logos): "Costly for business; International data = Slow & Un-reliable; English language or low quality translation; Poor communication/file storage & sharing methods for teams; Poor file management." "Us" (Chotmai): "Thai pricing/payment options; Local servers for speed; Native Thai language; Ability to sell files (Enterprise); Communicate on familiar channels; Local customer service and support; Chat & files in one dashboard."
Presentation choice: Shown as a middle example: the local angle is clear, but "slow" and "costly" are unmeasured, and it doesn't name local rivals.
When it does not fit: Calling well-known products "poor" without a measure; it reads as dismissive.
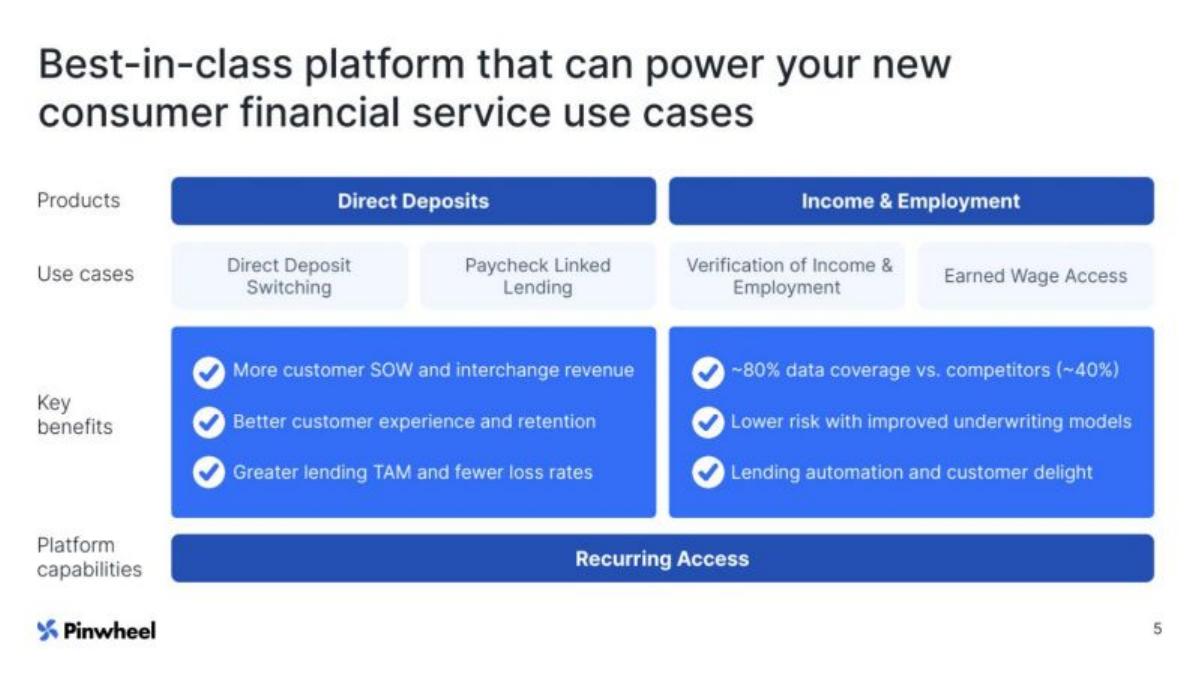
Payroll connectivity API for financial apps, tagged as developer tools in our library. A product slide with one competitive claim.
Pinwheel deck, slide 5. Exact stored slide matched to this analysis.
Our analysis: It puts a number on the comparison that matters most to an API buyer: how many users it can connect.
Evidence and limitation: Competitors are not named, and "data coverage" is not defined or sourced.
What a founder can adapt: Name the rivals, define coverage (for example, share of US workers whose payroll you can reach), and give the date and method.
Supporting analysis
What the deck claims: "Best-in-class platform that can power your new consumer financial service use cases." Products: Direct Deposits, Income & Employment. Key benefits include "~80% data coverage vs. competitors (~40%)".
Presentation choice: Shown for contrast: a coverage figure is the right kind of evidence, but without naming rivals or saying how it was measured, a reader cannot check it.
When it does not fit: Hiding the only competitive claim in a benefits list; give it its own line.
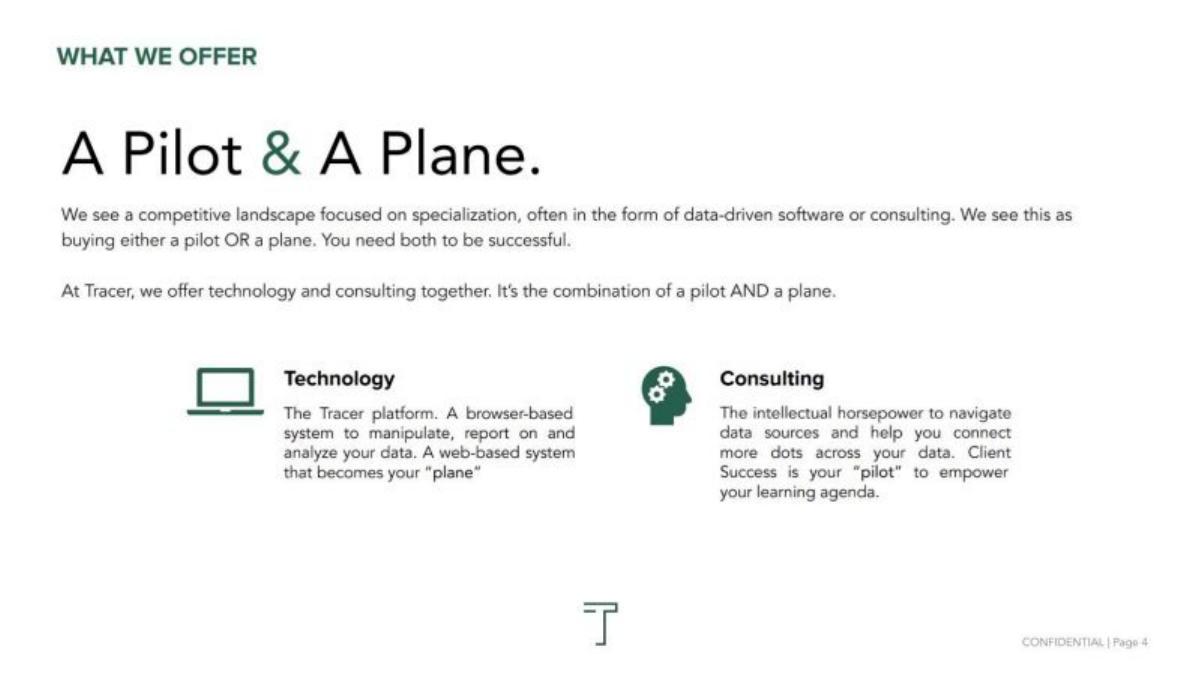
Data analytics platform with consulting, tagged as developer tools in our library. Slide titled "A Pilot & A Plane."
Tracer deck, slide 3. Exact stored slide matched to this analysis.
Our analysis: It groups rivals into software-only and consulting-only, and positions the combination as the difference.
Evidence and limitation: No rivals named; no figures.
What a founder can adapt: Name one software rival and one consultancy, and show a client result from using both together.
Supporting analysis
What the deck claims: "We see a competitive landscape focused on specialization, often in the form of data-driven software or consulting. We see this as buying either a pilot OR a plane. You need both to be successful. At Tracer, we offer technology and consulting together."
Presentation choice: Shown as weaker: the metaphor is memorable, but no rival is named and nothing shows the combination gets better results.
When it does not fit: A metaphor in place of names; investors will ask who the pilots and planes are.
Supply-chain marketplace and banking platform for the hemp and cannabis industries, tagged as developer tools in our library. Slide titled "Competition".
NorCal deck, slide 6. Exact stored slide matched to this analysis.
Our analysis: It suggests a platform strategy, where rivals join rather than compete.
Evidence and limitation: No rivals named; no evidence of any partnership.
What a founder can adapt: Name the rivals, then show one that has already joined the platform and on what terms.
Supporting analysis
What the deck claims: "COMPETITION BECOMES COLLABORATION." "Through of our banking system and marketplace, all potential competitors can be turned into collaborators."
Presentation choice: Shown as the weakest: without naming a single competitor or partner, the slide gives investors nothing to assess.
When it does not fit: Claiming everyone will collaborate; it skips the question the slide exists to answer.
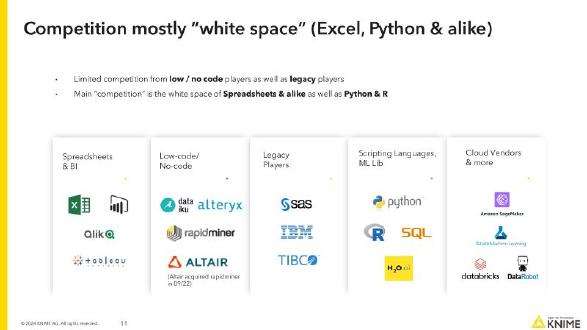
KNIME deck, slide 11. Exact stored slide matched to this analysis.
Our analysis: It names the free tools analysts actually use as the main alternative and groups paid vendors by type.
Evidence and limitation: No market shares, prices or win rates.
What a founder can adapt: Group rivals by type and say which group you lose to most often.
Supporting analysis
What the deck claims: "Competition mostly 'white space' (Excel, Python & alike)": "Limited competition from low / no code players as well as legacy players"; "Main 'competition' is the white space of Spreadsheets & alike as well as Python & R". Five groups with logos: Spreadsheets & BI (Excel, Power BI, Qlik, Tableau), Low-code/No-code (Dataiku, Alteryx, RapidMiner, Altair, noting "Altair acquired rapidminer in 09/22"), Legacy Players (SAS, IBM, TIBCO), Scripting Languages, ML Lib (Python, R, SQL, H2O.ai), Cloud Vendors & more (Amazon SageMaker, Azure Machine Learning, Databricks, DataRobot).
Presentation choice: Calling spreadsheets and Python the main competition is honest for a data tool, and the groups make a crowded field readable.
When it does not fit: "Limited competition" next to Alteryx, Dataiku and Databricks needs a reason, such as price or who buys. The slide gives none.
Data pipeline automation platform. Stage and year not stated.
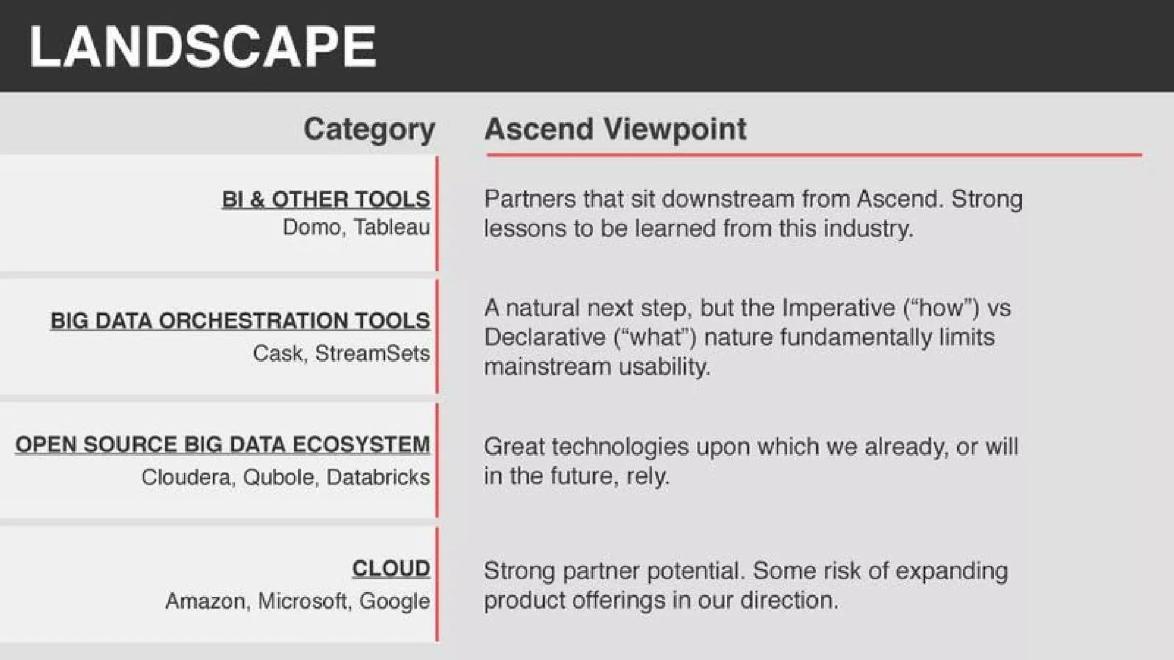
Ascend deck, slide 11. Exact stored slide matched to this analysis.
Our analysis: It sorts named companies into partners, platforms and rivals and states one technical reason the closest rivals are limited.
Evidence and limitation: No figures; the viewpoints are the founder's judgement.
What a founder can adapt: Give each rival category one line: partner, rival or both, and why.
Supporting analysis
What the deck claims: "Landscape" with an "Ascend Viewpoint" per category: BI & Other Tools (Domo, Tableau): "Partners that sit downstream from Ascend. Strong lessons to be learned from this industry." Big Data Orchestration Tools (Cask, StreamSets): "A natural next step, but the Imperative ('how') vs Declarative ('what') nature fundamentally limits mainstream usability." Open Source Big Data Ecosystem (Cloudera, Qubole, Databricks): "Great technologies upon which we already, or will in the future, rely." Cloud (Amazon, Microsoft, Google): "Strong partner potential. Some risk of expanding product offerings in our direction."
Presentation choice: It is the only slide here that names the cloud providers as a risk, which is the question infrastructure investors ask first.
When it does not fit: "Imperative vs declarative" will mean little to non-engineers; add what it means for the buyer, such as fewer engineers needed.
Web scraping platform for developers (later renamed Apify). The developer tools market and problem guides use different slides from this deck.
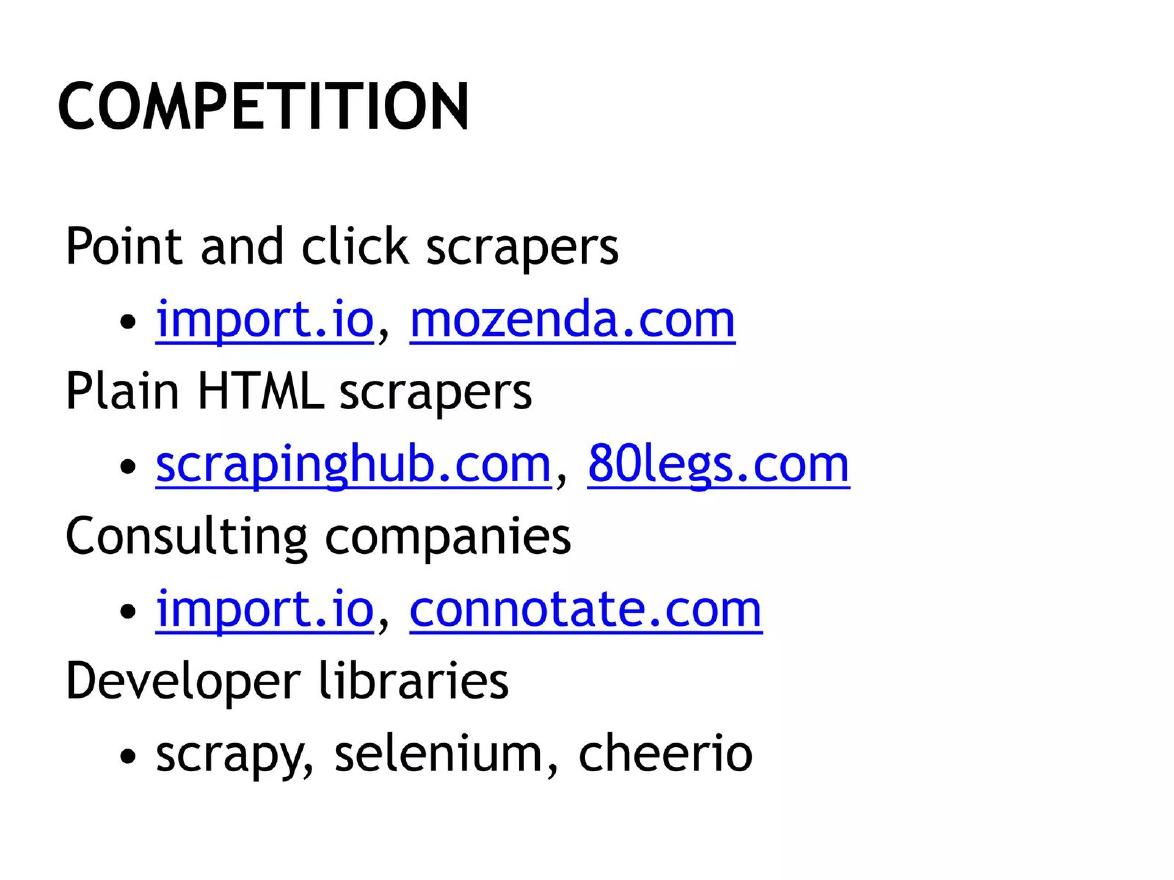
Apifier deck, slide 12. Exact stored slide matched to this analysis.
Our analysis: It maps the field by type of rival, including free libraries developers already use.
Evidence and limitation: Names only; no prices, features or comparison.
What a founder can adapt: Keep the categories and add one line per group on what it lacks that you provide.
Supporting analysis
What the deck claims: "Competition": Point and click scrapers (import.io, mozenda.com); Plain HTML scrapers (scrapinghub.com, 80legs.com); Consulting companies (import.io, connotate.com); Developer libraries (scrapy, selenium, cheerio).
Presentation choice: Shown as a weaker example: the categories are useful, but the slide never says where Apifier fits or why it wins.
When it does not fit: A list of names with no own position leaves the reader to guess the difference.
Whether each slide names rivals, compares itself with them, and gives something a reader could check.
Example
Rivals named
Own column or head-to-head
Checkable basis
CommandBar
Partly (in-house build)
Yes (five rows)
Partly (features are visible)
COMSovereign
Yes (six incumbents)
Partly (limits only)
Partly (unsourced shares)
Chotmai
Yes (Dropbox, Slack)
Yes (them vs us)
No
Pinwheel
No
Yes (coverage figure)
No (undefined)
Tracer
No (two categories)
Partly
No
NorCal
No
No
No
KNIME
Yes (five groups incl. Excel, Python)
No
No
Ascend
Yes (four categories)
Partly (viewpoint per category)
No
Apifier
Yes (four groups incl. libraries)
No
No
Key Takeaways
Treat "build it ourselves" as a named competitor.
Compare on rows engineers care about: maintenance, search, logs, coverage.
Name incumbents and state each one's limit in a few words.
A coverage or accuracy figure needs a named rival and a method.
"No competitors, only partners" leaves the question unanswered.
Name free and open-source tools developers already use, such as Python, R or scraping libraries.
Build your developer tools competition slide
Start from what the buyer's team would do without you.
Buyer. Who signs off: an engineering lead, IT, or a product team?
Build option. What would it take them to build this in-house, and what would they skip?
Incumbents. Which vendors do they already pay, and where is each limited?
Proof. Can you show a figure: engineer-weeks saved, coverage, latency, uptime, with method and date?
Where you lose. Where does an incumbent or in-house build beat you (control, price, existing contract)?
Copyable framework: Teams today build [basic version] in-house ([cost/limit]) or use [vendor] ([limit]). We offer [measured difference]. Measured [how], [date].
Illustrative example 1 — written by us
Before: ~80% data coverage vs. competitors (~40%).
After: We connect to payroll for about 80% of US workers; the two largest alternatives reach about 40%, measured on the same 1,000 randomly chosen employers in March.
What improved: Our illustrative rewrite; the method and sample are invented for the example. It defines coverage, points to named alternatives, and says how the figure was measured.
What this guide adds
The general competition slide guide covers any business. Developer and infrastructure tools add a specific rival: the in-house build. Buyers also weigh switching cost against incumbents they already use, so the strongest slides here say plainly where incumbents are limited.
Our library's developer tools tag is broad; it also covers infrastructure, data and some B2B platforms. We note each company's business in the examples. The developer tools product and traction guides cover other slides from similar decks.
How we read each slide
We quote the text on the stored slide images. We have not checked any market share, coverage figure or feature claim.
Free tools and open source as competition
Developers rarely start from nothing. They write a script, use a free library, or open a spreadsheet. A developer tools competition slide that leaves these out misses the option most buyers actually take.
KNIME puts this in its heading: "Competition mostly 'white space' (Excel, Python & alike)". Its slide says the main "competition" is spreadsheets and Python or R, with "Limited competition" from low-code tools and legacy vendors, and shows five groups of named products. Apifier does the same for web scraping, listing "Developer libraries" (scrapy, selenium, cheerio) beside paid scraping services. Neither slide says how many teams use the free option or why they would pay instead, which is the question an investor will ask next.
If free tools are your main rival, say what they cost in engineering time, what they lack (hosting, scheduling, monitoring, support) and which kind of team outgrows them first.
Partners, platforms and rivals in one picture
Infrastructure tools sit on top of cloud platforms and open-source projects, so the same company can be a supplier, partner and threat. Ascend's "Landscape" slide handles this with a short "Ascend Viewpoint" on each category. BI tools such as Domo and Tableau are "Partners that sit downstream". Big data orchestration tools (Cask, StreamSets) are limited by their "Imperative ('how') vs Declarative ('what') nature". The open-source ecosystem (Cloudera, Qubole, Databricks) is technology "we already, or will in the future, rely" on. The cloud providers are "Strong partner potential. Some risk of expanding product offerings in our direction."
That last line is the most useful on the slide: it names the biggest risk plainly. Compare NorCal, which says all competitors can become collaborators without naming any. Ascend shows the stronger way to talk about partners: say which companies are partners, which are rivals and which could become either, and why.
Questions investors ask about a developer tools competition slide
Why would a team pay instead of using a free library or building it? CommandBar's build-vs-buy table answers this; KNIME and Apifier name the free options without answering it.
Which incumbents does the buyer already pay, and where is each limited? COMSovereign and Ascend state a limit for each.
Could a cloud provider build this? Ascend is the only example here that names the risk.
Is any figure measured, and against whom? Pinwheel's coverage figure has no named rival or method.
Common mistakes
Ignoring the in-house build. Engineering buyers ask "why not build it?" before comparing vendors.
Unsourced market shares. Say which market each share measures and where it comes from.
Unnamed competitors. "vs. competitors" cannot be checked.
Metaphors instead of names. A pilot and a plane are memorable but name no one.
"Everyone will partner with us". Show one partner who has, or treat rivals as rivals.
Diagnostic checklist
Treats the in-house build as a competitor.
Names the incumbents and each one's limit.
Compares on rows engineers care about.
Gives at least one measured figure with method and date.
Admits where an incumbent or in-house build is ahead.
Frequently asked questions
Should a developer tool list "build it in-house" as a competitor?
Yes; it is often the main alternative. CommandBar compares its product with a do-it-yourself version on purpose, maintenance, search, personalisation and logs.
How should an infrastructure startup present large incumbents?
Name them and state each one's limit in a few words. COMSovereign lists Ericsson, Nokia, Huawei, Ceragon, Mavenir and Aviat with labels such as "hardware centric" or "microwave only".
Is a single figure like "80% vs 40% coverage" enough?
Only if rivals are named and the figure is defined. Pinwheel's claim is the right kind of evidence but gives no method or names.
How we chose these examples
Update (2026-10-01): added KNIME p11, Ascend p11 and Apifier p12 after searching the full slide corpus for competition, landscape and alternatives wording near developer, API, SDK, DevOps, open source and code terms. The three appear after NorCal. Not used: Anima p9 (used in the main competition guide), Oso p16 (used in the cybersecurity competition draft), TalentAccurate p5 (used in the edtech competition guide), Fibery p5 (no-code tools, not developer tools) and slides from listed-company decks. The three new images were rendered from the published deck PDFs, inspected and stored on 2026-10-01 (editorial model review). No person has reviewed the additions.
Corpus: published pitch deck teardowns on StartupFundraising.com. Founder-uploaded private decks are excluded.
Selection (2026-09-27): we searched extracted slide text in decks tagged developer tools for competition, competitors, competitive, comparison, alternatives, differentiation and "vs". Fifteen slides with stored images matched; most were market, problem or product slides.
Kept six. Excluded: slides already used in other guides (Fivetran p6, Gitpod p8, InfluxData p5), Gitpod p6 (describes an open-source IDE, not rivals), Protecto p2 (a problem slide), Apifier p2 and Ably p3 (market framing), and dakwak p3 (a market slide).
The library's developer tools tag is broad: Chotmai (team chat), COMSovereign (telecom equipment), Pinwheel (payroll API), Tracer (analytics) and NorCal (cannabis marketplace) carry it, and the guide says so.
Review: stored slide text and images were checked on 2026-09-27 and matched to company, deck and slide number (editorial model review). No person has yet completed an editorial review of this page. We make no claim that any slide caused a fundraising outcome.