Developer Tools Traction Slides: 7 Real Pitch Deck Examples
How developer tool startups show traction: a monthly MRR chart, open-source usage beside cloud signups, paying customers with run rate and margin.
Developer Tools Traction Slides: Real Pitch Deck Examples
Seven traction slides from developer tool decks (a bot-building platform, a time series database, a code review tool, a serverless monitoring tool, a machine learning API, a container platform and an edge data platform), shown in full. Developer tools often have two kinds of traction: free usage (downloads, stars, instances, signups) and paid revenue. Investors want to see both and how one turns into the other. The stronger slides chart revenue or usage month by month; the weaker ones show logos, beta users or a headline with the number missing.
TL;DR
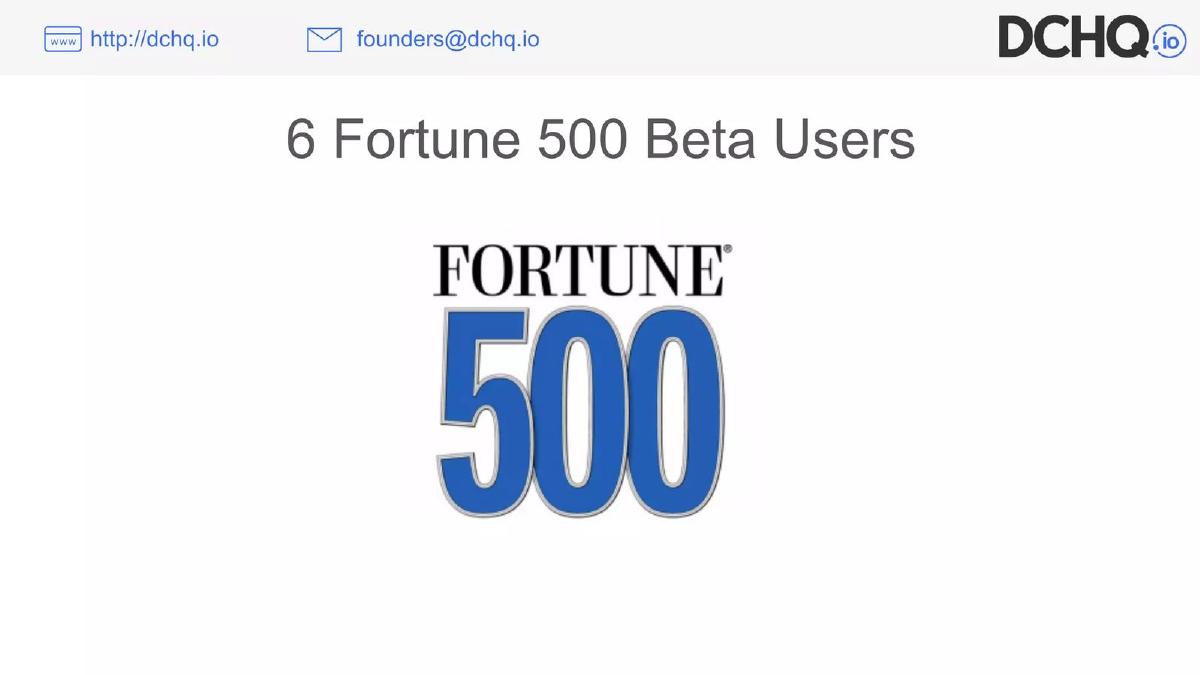
A developer tools traction slide should show revenue over time and the free usage that feeds it. Meya charts MRR monthly for a year to about CA$10,000. InfluxData charts active open-source instances, cloud signups and GitHub stars over several years. Bliss gives 70 paying customers, an $84,000 run rate and 90% margins weeks after launch. Lumigo puts "~80% quarterly ARR growth" inside a market timeline. FuzzyAI shows beta customer logos. DCHQ shows a Fortune 500 logo for six beta users. Macrometa's headline reads "$Y.Z Million in ARR", a placeholder left in, the weakest example here.
Developer tools traction slides
Each example shows the exact stored slide above its analysis and links to the full teardown. Stronger examples first. Claims and figures are as shown on the slides; we have not verified them.
Meya traction slide — slide 5
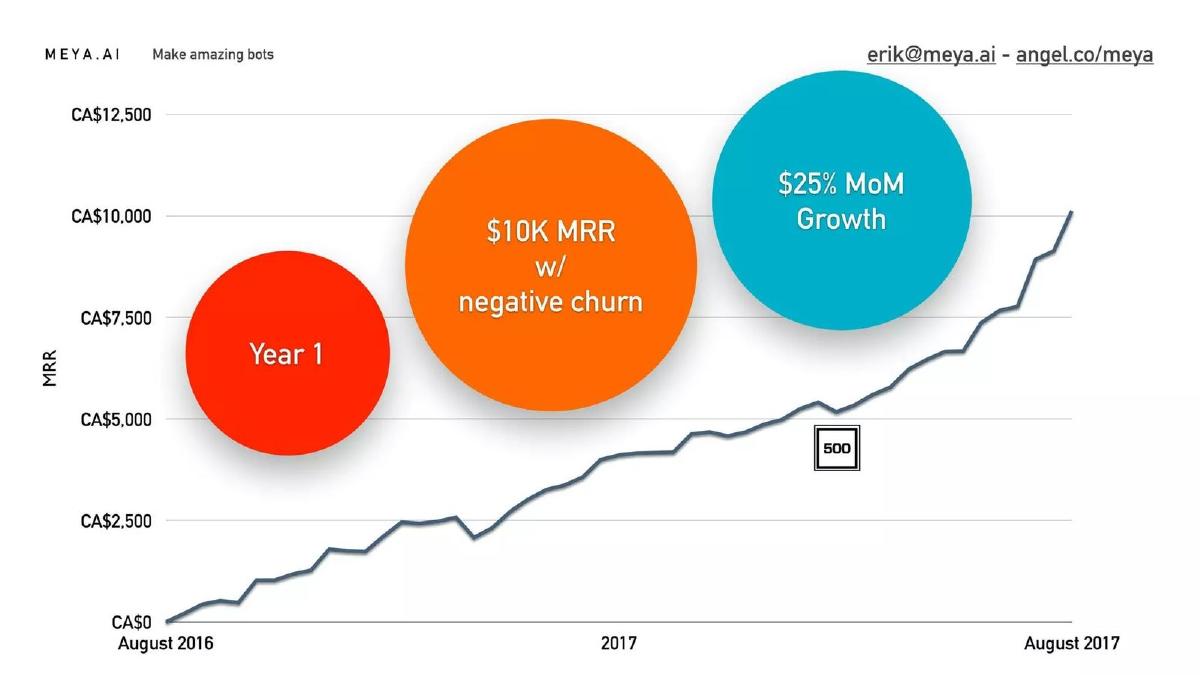
Seed (recorded). Platform for building chatbots. A monthly MRR line chart, August 2016 to August 2017, with three circles.
Meya deck, slide 5. Exact stored slide matched to this analysis.
Our analysis: The strongest slide here: a year of revenue, month by month, with nothing hidden. "$25%" is a typo, and the churn claim has no figure.
Evidence and limitation: A year of monthly MRR with labelled axes and currency, plus growth and churn claims; no customer count, and the circles use "$" while the axis uses CA$.
What a founder can adapt: Keep the chart, add customer count and net revenue retention, and use one currency throughout.
Supporting analysis
What the deck claims: Chart axis "MRR" from "CA$0" to "CA$12,500", "August 2016" to "August 2017"; the line ends just above CA$10,000. Circles: "Year 1", "$10K MRR w/ negative churn", "$25% MoM Growth". A 500 Startups logo sits on the line.
Presentation choice: A monthly MRR line shows steadiness as well as size; investors can see dips and recovery.
When it does not fit: Circles covering half the chart; put the claims in a caption.
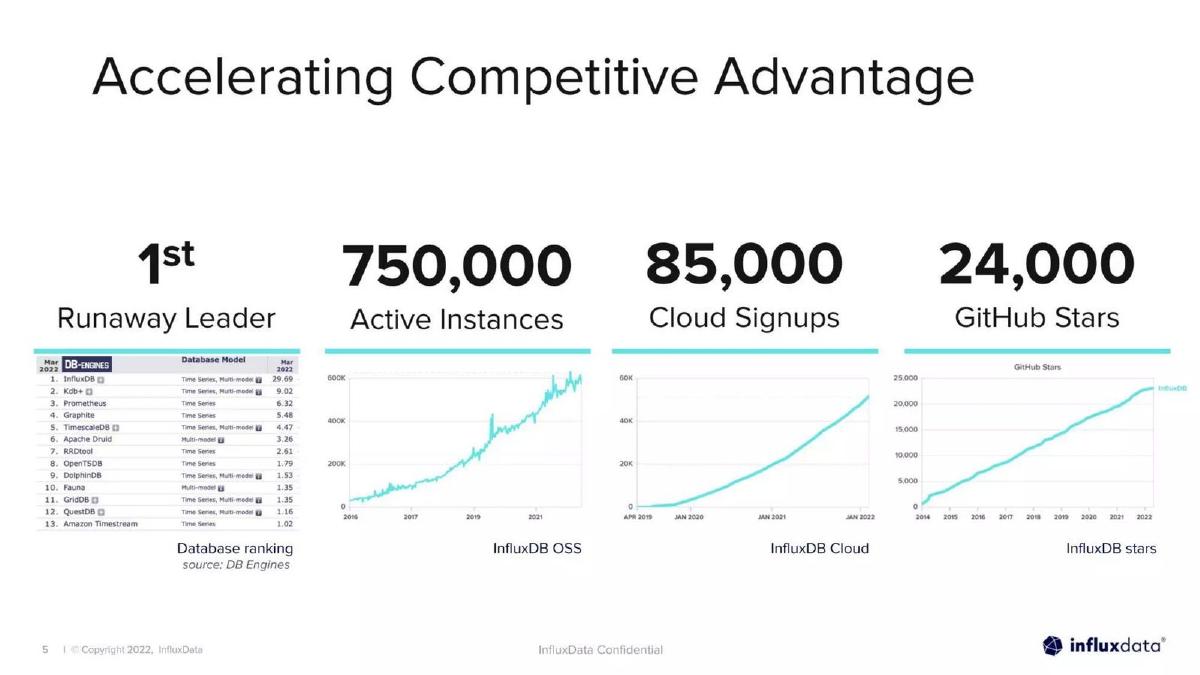
Series D or later (recorded). Time series database with open-source and cloud versions. Four columns, each with a figure and a chart.
InfluxData deck, slide 5. Exact stored slide matched to this analysis.
Our analysis: A clear picture of developer adoption, with dates and a source. It shows reach, not money; signups are not customers.
Evidence and limitation: Three usage series over several years and a sourced ranking; no revenue, paying customers or conversion from free to paid on this slide.
What a founder can adapt: Add paying cloud customers and the share of signups that pay beside the usage charts.
Supporting analysis
What the deck claims: "Accelerating Competitive Advantage." "1st Runaway Leader" with a DB-Engines ranking table ("Database ranking source: DB Engines"). "750,000 Active Instances" ("InfluxDB OSS", chart 2016 to 2021). "85,000 Cloud Signups" ("InfluxDB Cloud", chart April 2019 to January 2022). "24,000 GitHub Stars" (chart 2014 to 2022).
Presentation choice: For open-source tools, active instances over time show real use in a way stars alone cannot.
When it does not fit: Leaning on GitHub stars; active use and paid conversion matter more.
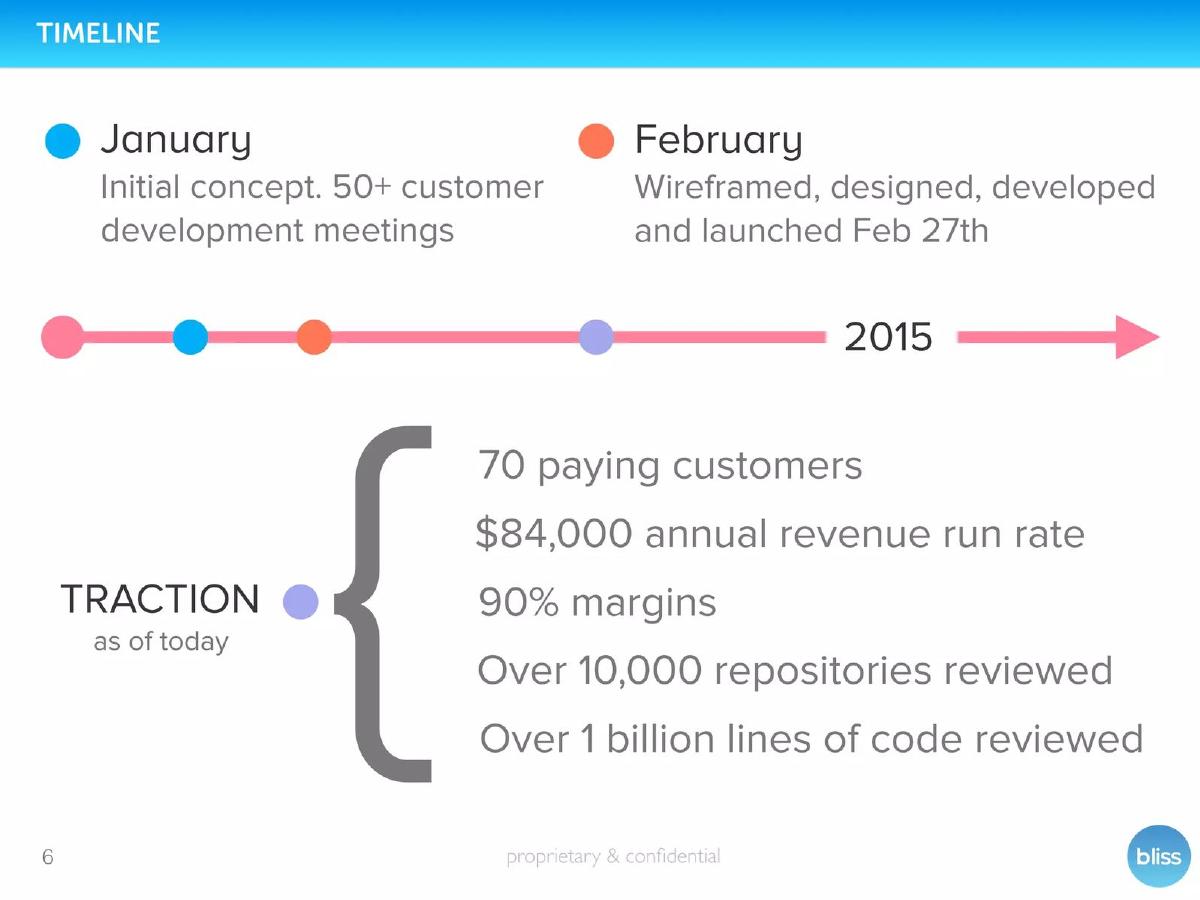
Seed (recorded). Automated code review tool. A 2015 timeline above a traction list.
Bliss deck, slide 6. Exact stored slide matched to this analysis.
Our analysis: Tight and honest: paying customers and revenue lead, usage supports. Without the date of "today" the speed since launch cannot be read.
Evidence and limitation: Paying customers, run rate and margin, plus usage totals; "as of today" has no date, and there is no month-by-month figure.
What a founder can adapt: Date the figures and add MRR by month since launch.
Supporting analysis
What the deck claims: "Timeline." January: "Initial concept. 50+ customer development meetings." February: "Wireframed, designed, developed and launched Feb 27th." "Traction as of today": "70 paying customers", "$84,000 annual revenue run rate", "90% margins", "Over 10,000 repositories reviewed", "Over 1 billion lines of code reviewed".
Presentation choice: Leading with paying customers and run rate tells investors people pay, not only try.
When it does not fit: Undated "as of today" figures.
Series A (recorded). Monitoring for serverless apps. A 2015 to 2025 timeline mixing industry quotes and one company figure.
Lumigo deck, slide 5. Exact stored slide matched to this analysis.
Our analysis: The only traction number is small and surrounded by market data. 80% quarterly growth means little without the ARR it grows from.
Evidence and limitation: One company growth rate with no base ARR, among market figures from other firms.
What a founder can adapt: Give the ARR and customer count behind the growth rate on its own slide.
Supporting analysis
What the deck claims: "The Year of Cloud Native." "65% of Cloud Native developers claim monitoring and debugging are their biggest challenges." Timeline: AWS "coins the term Serverless" (2015), "Lumigo founded" (2018), Datadog quote (2020), New Relic quote (2021), Lumigo "~80% Quarterly ARR growth" (2021), "$21.9B" and "10% For Monitoring" (Valuates Reports, 2025).
Presentation choice: Included to show how market context can bury the company's own figure.
When it does not fit: A growth rate with no starting number.
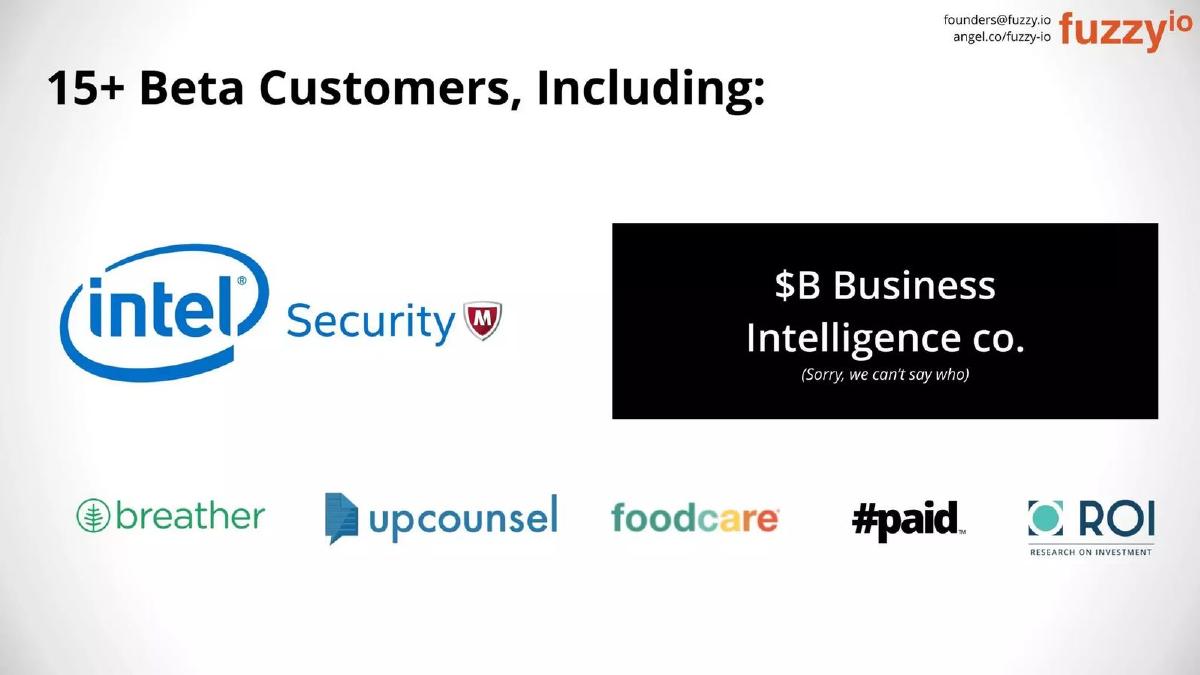
Seed (recorded). Machine learning API for developers. Logos under a headline.
FuzzyAI deck, slide 6. Exact stored slide matched to this analysis.
Our analysis: Recognisable names help, and saying why one is unnamed is honest. Beta customers may not pay, so this is interest, not revenue.
Evidence and limitation: A beta customer count and six named logos; no revenue, usage or whether any pay.
What a founder can adapt: Say how many beta customers pay or have signed, and add API calls per month.
Supporting analysis
What the deck claims: "15+ Beta Customers, Including:" Intel Security, a black box reading "$B Business Intelligence co. (Sorry, we can't say who)", breather, upcounsel, foodcare, #paid, ROI.
Presentation choice: Logos show who is trying the product; investors then ask how much they use it and whether they will pay.
When it does not fit: Logos with no measure of use.
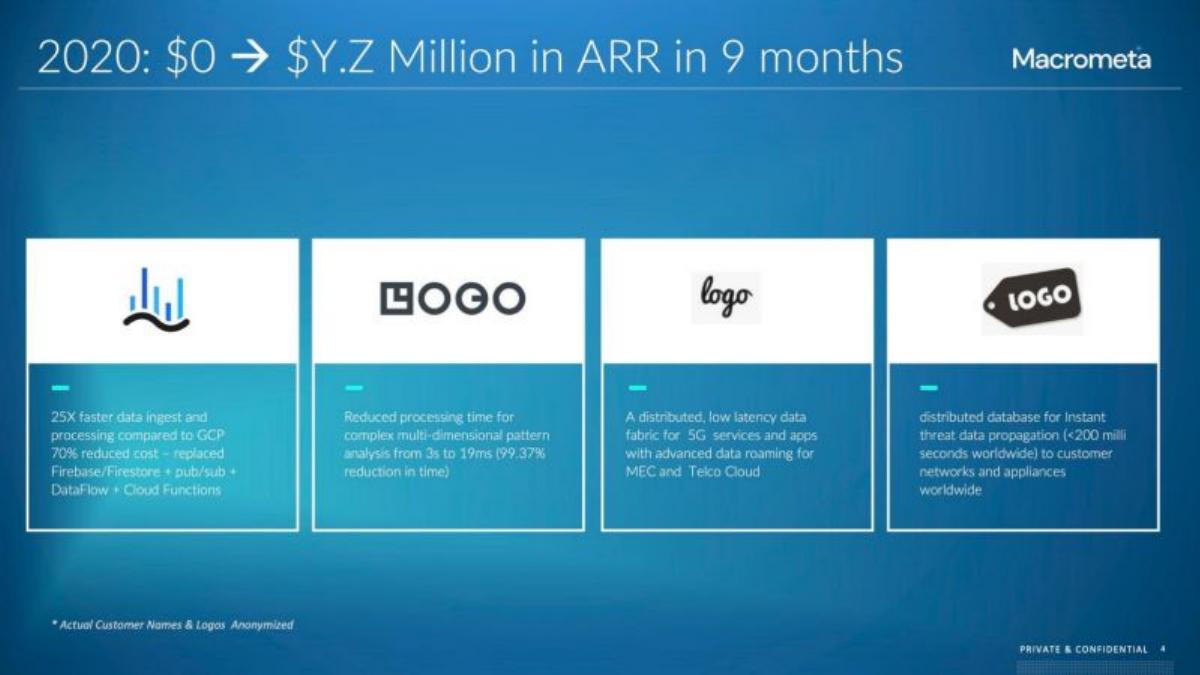
Series A (recorded). Edge data platform. A headline over four customer tiles with placeholder logos.
Macrometa deck, slide 4. Exact stored slide matched to this analysis.
Our analysis: The weakest example here. The headline promises the most important number and shows "$Y.Z" instead, so the slide has no traction figure.
Evidence and limitation: The ARR figure is a placeholder and the customers are anonymized; the tiles give performance results, not revenue.
What a founder can adapt: Put the real ARR in the headline, or remove the figure and say it is shared on request.
Supporting analysis
What the deck claims: "2020: $0 → $Y.Z Million in ARR in 9 months." Four tiles with placeholder logos ("LOGO", "logo") and results such as "25X faster data ingest and processing compared to GCP 70% reduced cost" and "Reduced processing time for complex multi-dimensional pattern analysis from 3s to 19ms (99.37% reduction in time)". Footnote: "Actual Customer Names & Logos Anonymized."
Presentation choice: Included to show what happens when a template value is left in: the reader sees missing data.
When it does not fit: Sending a deck without checking placeholders.
Whether each slide gives revenue, paying customers, free usage and a time axis.
Example
Tool
Revenue
Paying customers
Free usage
Time axis
Meya
Bot platform
Monthly MRR
No count
No
12 months
InfluxData
Time series database
No
No
Instances, signups, stars
Several years
Bliss
Code review
$84,000 run rate
70
Repositories, lines reviewed
Undated
Lumigo
Serverless monitoring
Growth rate only
No
No
2021 point
FuzzyAI
ML API
No
Beta, not stated
No
No
DCHQ
Container platform
No
Beta, not stated
No
No
Macrometa
Edge data platform
Placeholder
Anonymized
No
9 months (claimed)
Key Takeaways
Chart MRR or ARR by month, with a labelled axis.
Show free usage and paid customers separately, and how many convert.
Say whether beta users pay.
Check every headline figure before sending; placeholders read as missing data.
Build your developer tools traction slide
Show revenue over time and the free usage that turns into it.
Revenue. MRR or ARR by month, with currency and dates.
Customers. Paying customers, and how many are beta or free.
Usage. Active instances, weekly active developers or API calls, over time.
Conversion. Share of free users or signups that pay.
Copyable framework: MRR [amount] in [month], up from [amount] in [month]. [n] paying teams from [n] active free users ([x]% convert). [n] API calls a month.
Illustrative example 1 — written by us
Before: 6 Fortune 500 Beta Users.
After: 6 Fortune 500 teams in beta since [month] ([industries]); [n] deploy weekly, [n] in paid pilot at [amount].
What improved: Our illustrative rewrite; not DCHQ's wording. Bracketed parts are placeholders to fill with real facts. It adds usage and payment to the claim.
What this guide adds
The library has a developer tools product guide and a SaaS traction guide, but no developer tools traction guide. This page covers what is specific to tools sold to engineers: open-source and free usage as a leading measure, and the step from usage to paid revenue.
Sector labels come from the sector recorded for each published teardown (high confidence for Meya, Bliss, Lumigo and DCHQ; medium for InfluxData, FuzzyAI and Macrometa). None of these seven slides appears in another guide.
Three ways devtools decks show traction
Revenue over time (Meya, Bliss, Lumigo): MRR, run rate or ARR growth, ideally charted.
Free usage (InfluxData): instances, signups and stars that show developer adoption.
Logos and claims (FuzzyAI, DCHQ, Macrometa): named or unnamed customers with no revenue, which leave the investor guessing.
Common mistakes
Stars as traction. Stars show interest; active use and paying customers show demand.
Beta without payment. Say whether beta users pay or have signed.
Growth rate without a base. Give the revenue the rate grows from.
Placeholders left in. Check every figure before a deck goes out.
Diagnostic checklist
MRR or ARR by month.
Paying customers separated from free and beta users.
Active usage over time.
Free-to-paid conversion.
Frequently asked questions
How we chose these examples
Corpus: published pitch deck teardowns on StartupFundraising.com. Founder-uploaded private decks are excluded.
Selection (2026-09-27): we took teardowns whose recorded sector is developer tools, with slide text about traction, customers, users, revenue, installations, downloads, stars, ARR or MRR. We read the candidates and viewed nine slide images, left out market and problem slides, slides already used in other guides, a slide with no stored image (ArangoDB), a duplicate Bliss deck and public-company decks, and kept seven. Macrometa is included as the weakest example for contrast.
Sector is the category recorded for each teardown (high confidence for Meya, Bliss, Lumigo and DCHQ; medium for InfluxData, FuzzyAI and Macrometa). Stages as recorded: Meya, Bliss and FuzzyAI, seed; Lumigo and Macrometa, Series A; InfluxData, Series D or later; DCHQ, not recorded.
Review: stored slide images were checked on 2026-09-27 and matched to company, deck and slide number, and quoted text was read from the images (editorial model review). No person has yet completed an editorial review of this page.
Claims and figures are as shown on the slides; we have not verified them. We make no claim that any slide caused a fundraising outcome.