Hiding Numbers in a Pitch Deck: 13 Redacted Real Slides
How to share a pitch deck with revenue hidden and still show traction: keep growth rates, chart shapes and ranges. Thirteen real redacted slides compared.
Hiding Numbers in a Pitch Deck: What a Redacted Slide Can Still Show
Founders often send a deck before a meeting, or share it widely, with revenue and customer names removed. Hiding a number is a real choice, but it changes what the slide can prove. This guide compares thirteen real slides where figures were replaced with "[REDACTED]", "XX%" or "$X", or simply left blank, and shows what a reader can still learn from each.
TL;DR
Hide the amounts; keep the relationships. A redacted slide still works if it leaves something a reader can check: a growth rate, a multiple, the shape of a chart with dates, or a range such as "$Millions". Cloosiv, Empowerly and Cloudsmith keep a growth figure beside a hidden scale; Daydream keeps a dated chart. Veremark keeps the results of a unit-economics table (payback months, CLTV:CAC multiples) while leaving the inputs blank. Arist, Humaans and Skilljar hide every value, so the slide shows only which metrics exist. Two checks matter once amounts are gone: the growth rate you leave visible must match the chart (Cloosiv's and Empowerly's don't quite), and the dates must match the headline (Daydream's and Empowerly's don't). A third applies when you keep only the results: a reader cannot recompute them, so anything you infer from them rests on your word.
Redacted numbers on real pitch deck slides
Each example shows the exact stored slide above its analysis and links to the full teardown. Slides that keep the most checkable information come first. Visible text is quoted as shown; checks and calculations are ours.
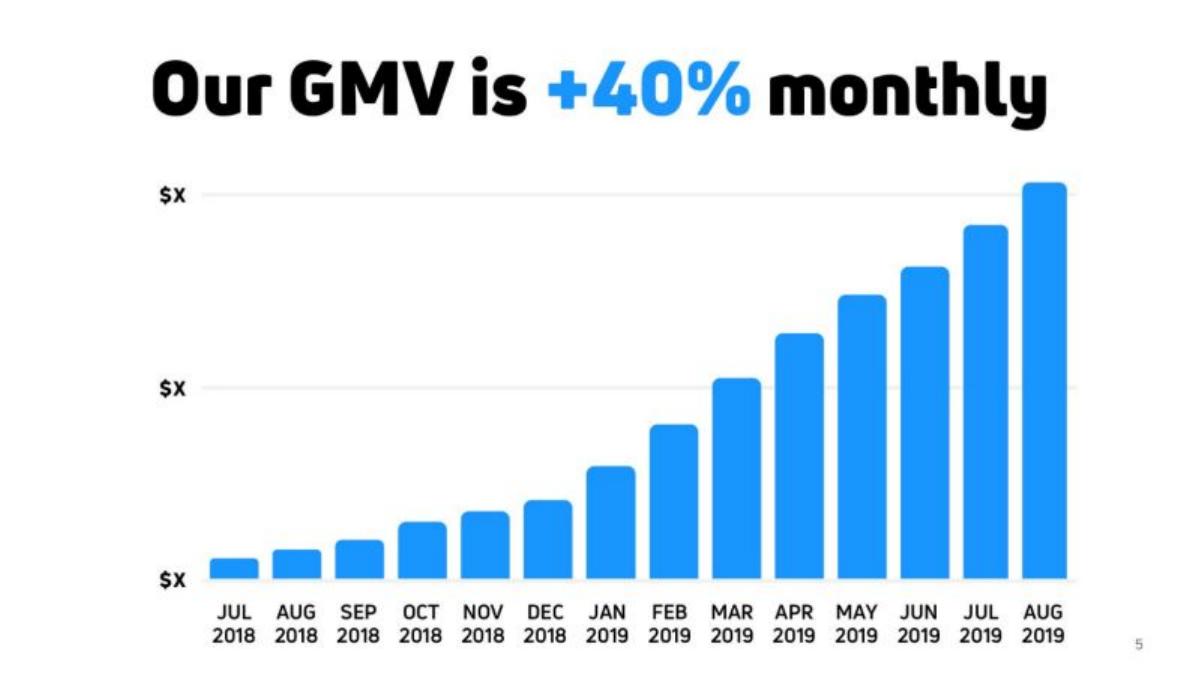
Cloosiv traction slide — slide 5
Mobile ordering for independent coffee shops. A single bar chart of monthly GMV, July 2018 to August 2019.
Cloosiv deck, slide 5. Exact stored slide matched to this analysis.
Our analysis: A checkable redaction whose headline rate describes the best months, not the whole period.
Evidence and limitation: The dollar scale is hidden but the months and bar heights remain, so the growth can be checked. Measured in pixels, the last bar is about 20 times the first. Over 13 monthly steps that is about 26% a month, not 40%; 40% every month would give about 79 times. Month-to-month, the steepest steps (Dec–Jan, Feb–Mar) are around 40%, and the last three are about 12–13%. Because all three axis labels say "$X", we can't confirm the axis starts at zero.
What a founder can adapt: "GMV up [n]× from Jul 2018 to Aug 2019 (average [x]% a month; last 3 months [y]%)." Keep the dated bars and label the bottom of the axis $0.
Supporting analysis
What the deck claims: "Our GMV is +40% monthly." Fourteen monthly bars from Jul 2018 to Aug 2019. Every axis label reads "$X".
Presentation choice: Keeping dated bars lets a reader test the growth claim even with the amounts hidden. That is the point of this format.
When it does not fit: Don't headline a peak monthly rate as if it applied to every month.
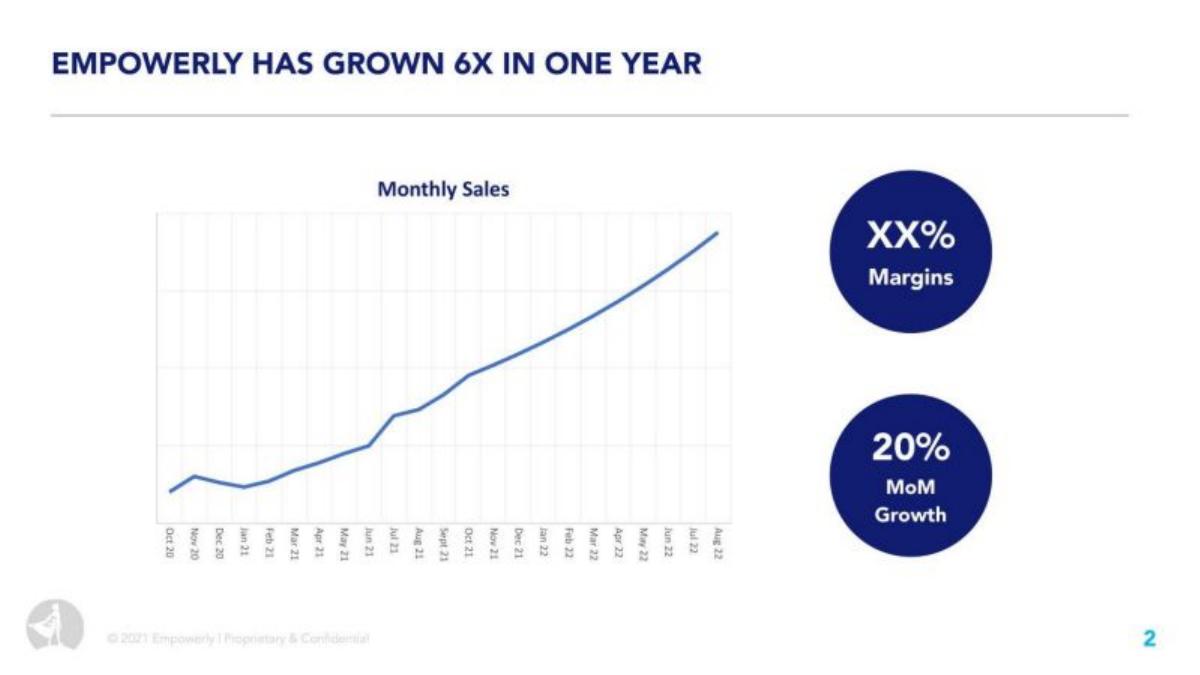
College admissions counselling company. A monthly sales line chart with two circles beside it.
Empowerly deck, slide 2. Exact stored slide matched to this analysis.
Our analysis: Visible growth figures that disagree with each other and with the chart's period.
Evidence and limitation: Two growth figures stay visible, but they don't agree: 20% a month compounds to about 8.9 times in a year, while 6 times a year is about 16% a month. The chart runs 23 months (Oct 2020–Aug 2022), not one year, so a reader can't tell which year the 6X covers. The margin is hidden completely.
What a founder can adapt: "Monthly sales up 6× from [month year] to [month year] (~16% a month)." Mark that year on the chart.
Supporting analysis
What the deck claims: "Empowerly has grown 6X in one year." A "Monthly Sales" line chart with no values, dated Oct 20 to Aug 22. Circles: "XX% Margins"; "20% MoM Growth".
Presentation choice: Once amounts are hidden, the rates are all a reader has, so they have to agree.
When it does not fit: Don't pair a monthly rate and an annual multiple that imply different numbers.
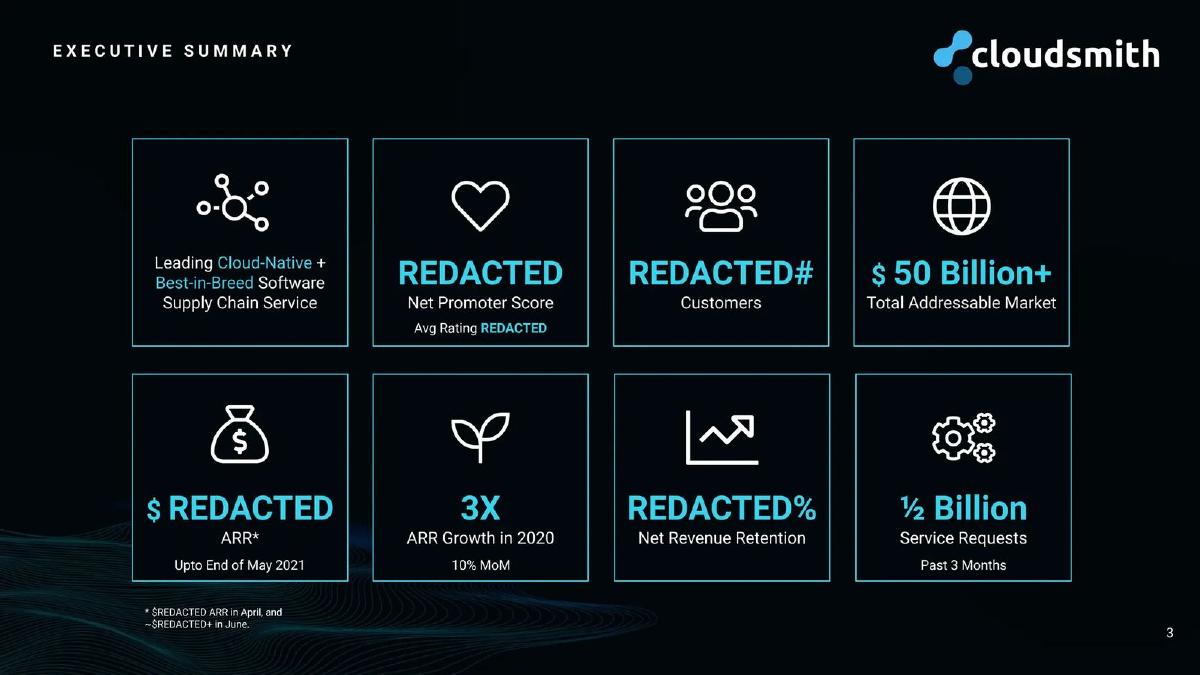
Software supply-chain (package management) company. An executive summary of eight tiles.
Cloudsmith deck, slide 3. Exact stored slide matched to this analysis.
Our analysis: A mostly hidden summary that keeps a consistent growth pair and one dated usage figure.
Evidence and limitation: ARR, customers, NPS and retention are hidden, but growth survives and is consistent: 10% a month compounds to about 3.1 times a year, matching "3X in 2020". The service-request count is a usage figure left visible, with a period ("past 3 months"). The footnote dates the ARR even with the amount removed.
What a founder can adapt: Keep one annual multiple and one monthly rate that agree, plus one dated usage figure.
Supporting analysis
What the deck claims: Tiles: "REDACTED Net Promoter Score"; "REDACTED# Customers"; "$50 Billion+ Total Addressable Market"; "$ REDACTED ARR* Upto End of May 2021"; "3X ARR Growth in 2020, 10% MoM"; "REDACTED% Net Revenue Retention"; "½ Billion Service Requests Past 3 Months". Footnote: "$REDACTED ARR in April, and ~$REDACTED+ in June."
Presentation choice: The two growth figures check each other, so a reader can trust the momentum without seeing size.
When it does not fit: Four hidden tiles out of eight make the slide look emptier than it needs to; drop tiles you can't show.
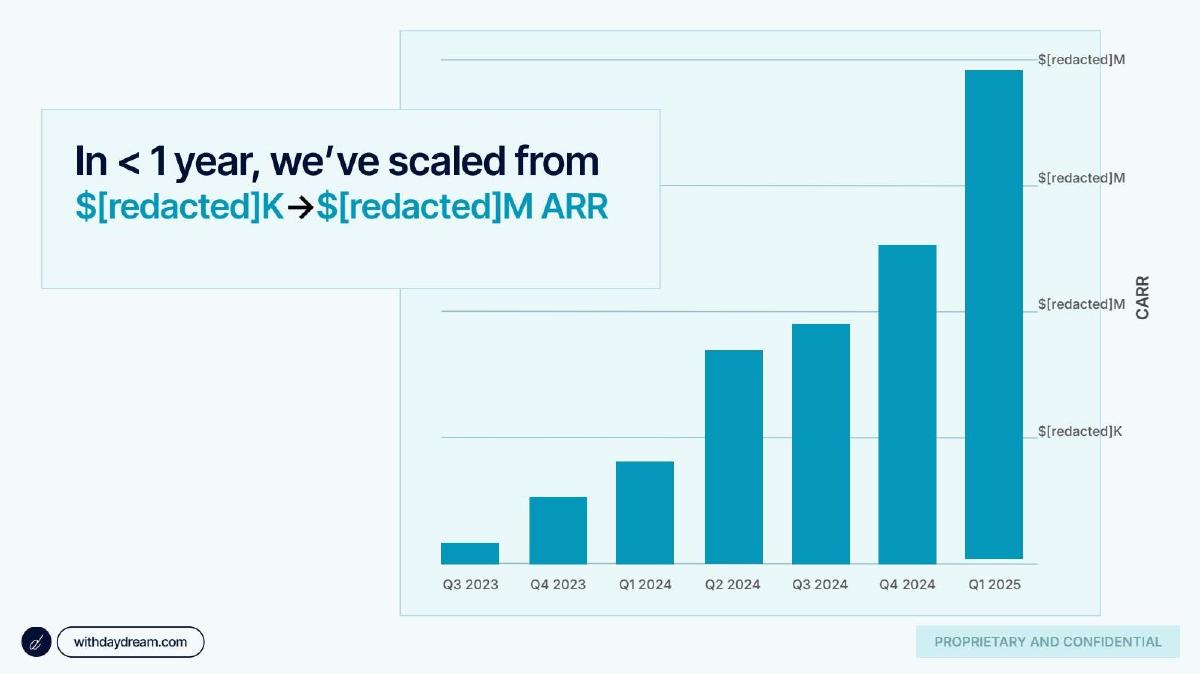
AI search-marketing company. A quarterly ARR bar chart with a headline box.
Daydream deck, slide 2. Exact stored slide matched to this analysis.
Our analysis: A useful shape-and-units redaction with a period and measure that don't match the headline.
Evidence and limitation: The redaction keeps the units (thousands to millions) and the dated bars, so a reader knows the business crossed from a K-level to an M-level ARR and can see the trend. The chart covers seven quarters, about 21 months, while the headline says less than a year; the reader has to guess which bars the headline refers to. The axis says "CARR" (contracted ARR), which is a different measure from the "ARR" in the headline.
What a founder can adapt: "From $[x]K to $[y]M CARR between [quarter] and [quarter]." Use the same measure in the headline and the axis.
Supporting analysis
What the deck claims: "In < 1 year, we've scaled from $[redacted]K → $[redacted]M ARR." Seven quarterly bars, Q3 2023 to Q1 2025, axis labelled "CARR" with gridlines "$[redacted]K" and "$[redacted]M".
Presentation choice: Keeping "K" and "M" tells a reader the order of magnitude without giving the figure.
When it does not fit: Don't say "in under a year" above a chart that spans nearly two.
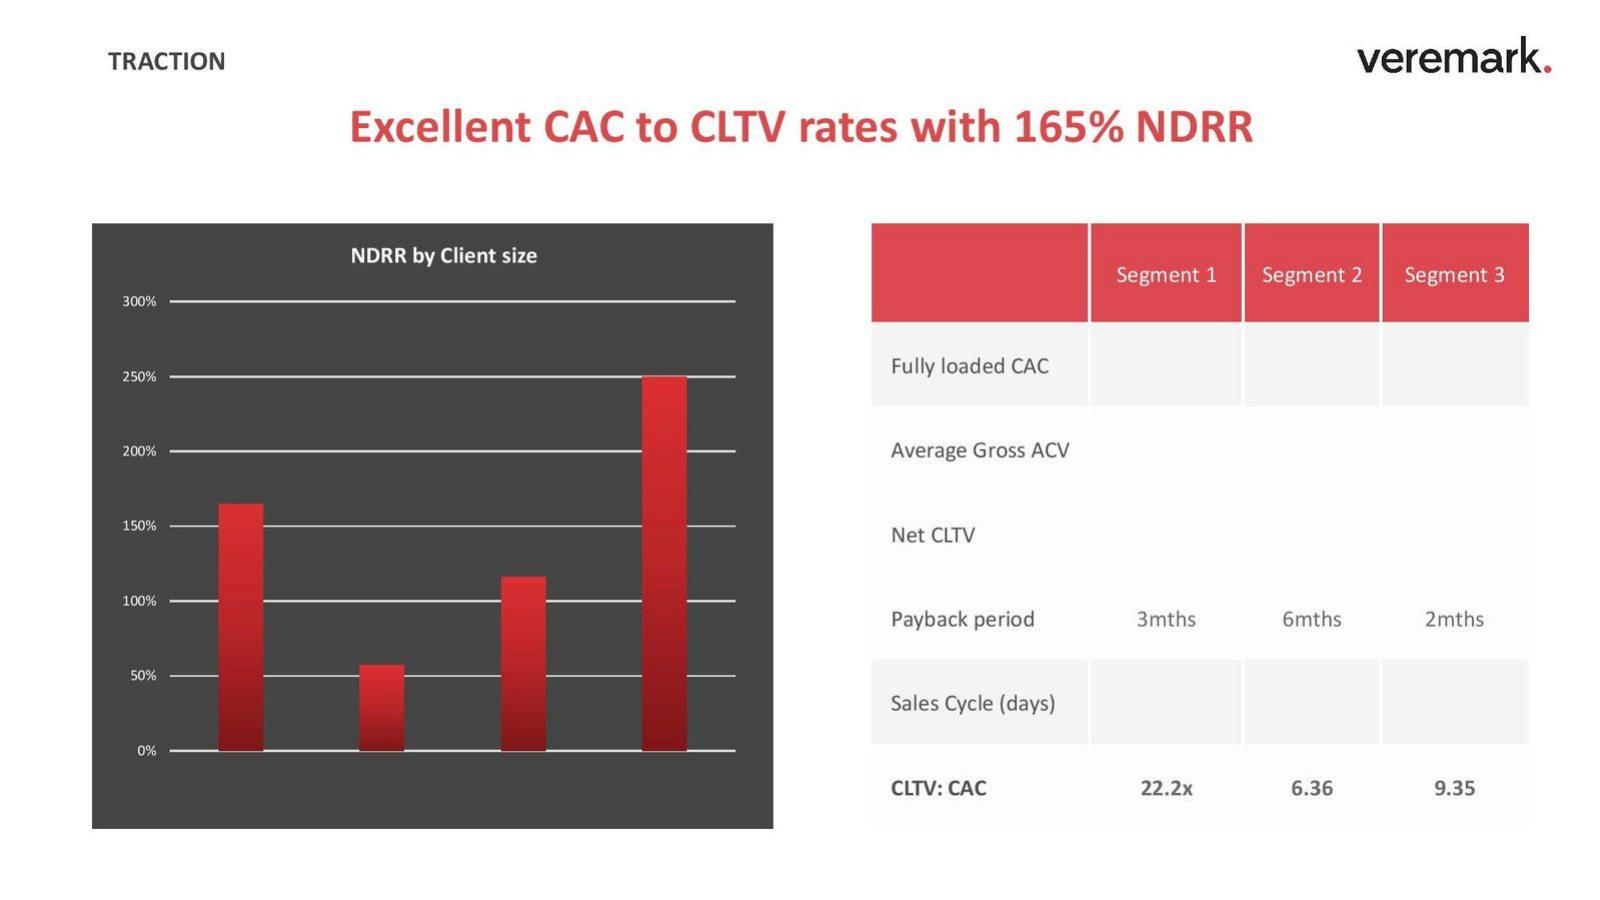
Background-checking software company, deck dated 2024. A traction slide with a bar chart on the left and a unit-economics table on the right.
Veremark deck, slide 15. Exact stored slide matched to this analysis.
Our analysis: A table that keeps the conclusions and hides the arithmetic, on unnamed segments.
Evidence and limitation: This is the opposite choice from the charts above: the inputs are blank and the results are kept. A reader gets payback in months and three CLTV:CAC multiples but cannot check any of them, because the CAC, ACV and CLTV they come from are missing. The three columns are labelled only "Segment 1–3", so there is no way to tell which customers they describe or which is the biggest. Two of the multiples are printed as bare numbers (6.36, 9.35) while the first carries an "x", and the pairs don't move together: segment 3 has the shortest payback (2 months) but not the highest multiple (22.2x belongs to segment 1, whose payback is 3 months). The chart's four bars have no categories, and reading heights against the axis gives roughly 165%, 57%, 117% and 250%, so the 165% in the headline appears to be one client size rather than the company total.
What a founder can adapt: Keep the ratios, but name the segments (by employee count, plan or industry) and give the share of revenue each one holds, so a reader knows whether the best multiple describes the biggest part of the business. If the inputs are sensitive, say where they are available.
Supporting analysis
What the deck claims: "TRACTION". Headline: "Excellent CAC to CLTV rates with 165% NDRR". Chart titled "NDRR by Client size" with four bars and a 0–300% axis, but no labels under the bars. Table columns "Segment 1", "Segment 2", "Segment 3"; rows "Fully loaded CAC", "Average Gross ACV", "Net CLTV" and "Sales Cycle (days)" are all empty; "Payback period" reads 3mths, 6mths, 2mths; "CLTV: CAC" reads 22.2x, 6.36, 9.35.
Presentation choice: Payback period and CLTV:CAC are the two figures an investor asks for, and both survive redaction without revealing revenue. That is a reasonable thing to keep.
When it does not fit: Don't leave whole rows blank in a table you built to be read across; either remove the row or give a range. Print every multiple in the same format, and don't let a headline word like "excellent" carry a claim that the visible numbers can't support.
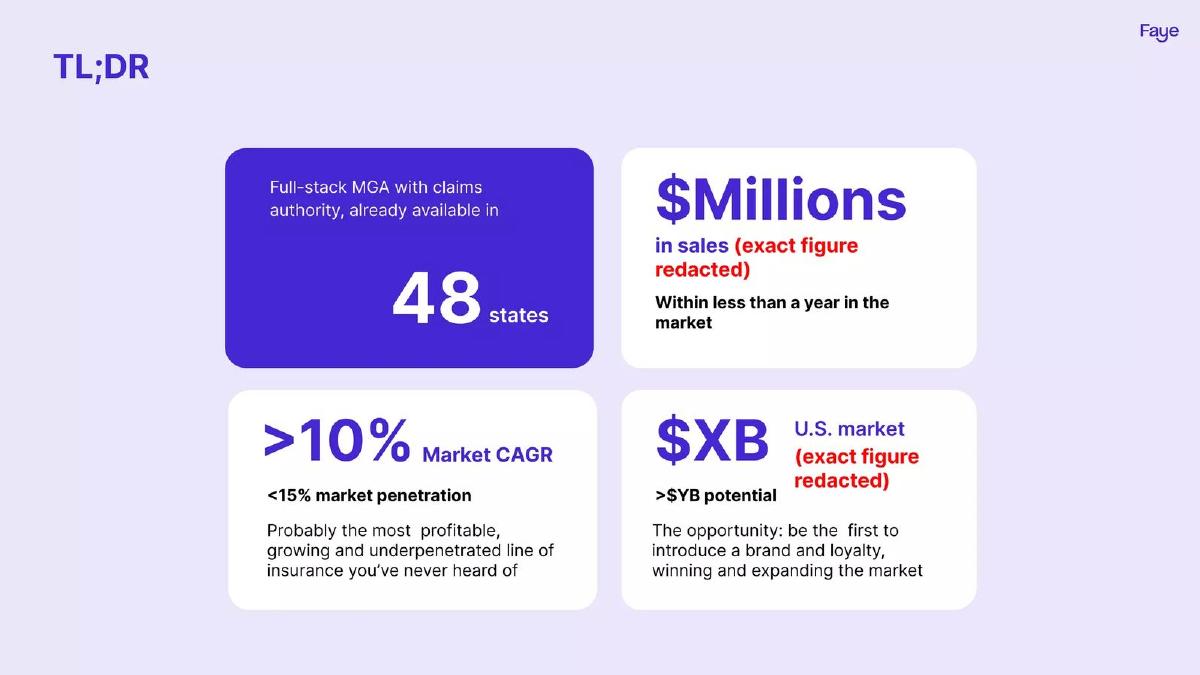
Travel insurance company (a managing general agent). A TL;DR slide of four tiles.
Faye deck, slide 2. Exact stored slide matched to this analysis.
Our analysis: An honest, labelled range redaction on sales; a less useful one on market size.
Evidence and limitation: Faye labels its redactions openly and replaces the sales figure with a range ("$Millions"), so a reader knows the order of magnitude and the period (under a year). The 48-state coverage is left visible. The market size is hidden as "$XB" while "<15% market penetration" remains; without the market figure that percentage can't be turned into a number.
What a founder can adapt: "$[1–5]M in sales in our first [n] months (exact figure in data room)."
Supporting analysis
What the deck claims: "$Millions in sales (exact figure redacted). Within less than a year in the market." "48 states." ">10% Market CAGR; <15% market penetration." "$XB U.S. market (exact figure redacted); >$YB potential."
Presentation choice: A range tells the reader more than a blank, and saying "exact figure redacted" avoids looking evasive.
When it does not fit: Don't leave a percentage visible when the figure it applies to is hidden.
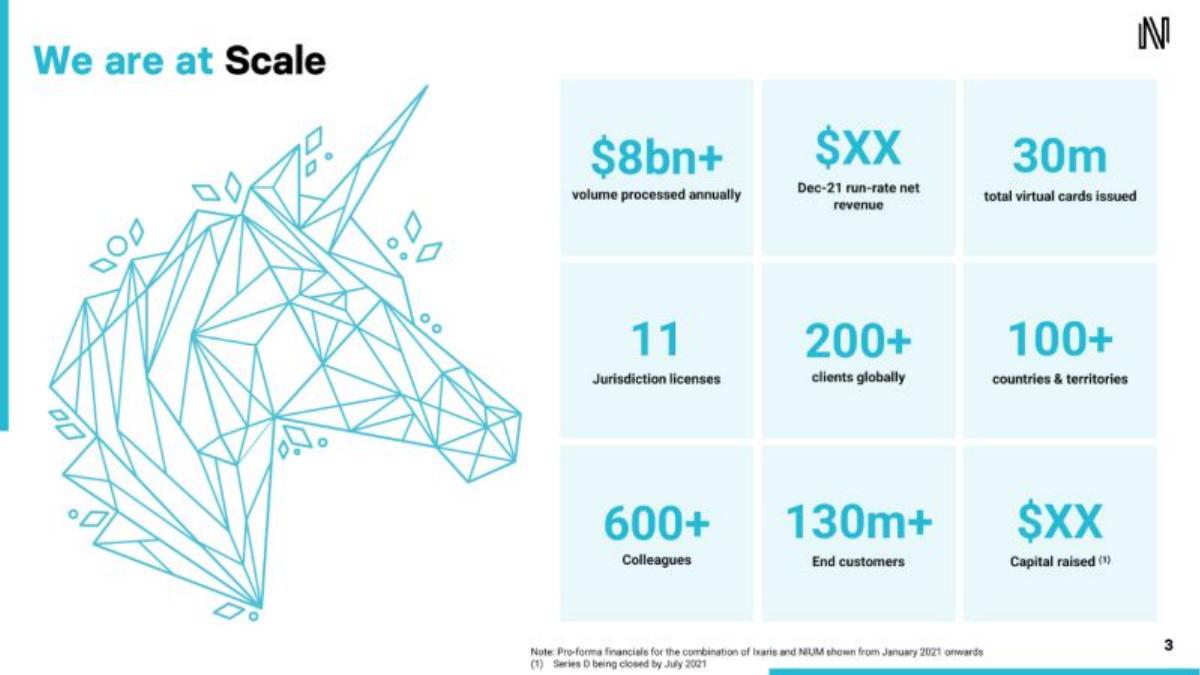
Cross-border payments company. A "We are at Scale" grid of nine tiles beside an illustration.
Nium deck, slide 3. Exact stored slide matched to this analysis.
Our analysis: Volume shown, revenue hidden: the slide shows size but not economics.
Evidence and limitation: Scale figures stay visible; the two money figures investors would weigh most, net revenue and capital raised, are hidden. With $8bn volume shown and net revenue hidden, a reader can't work out the take rate (revenue as a share of volume), which is the figure that turns volume into a business. The footnote flags the numbers as pro-forma for a merger.
What a founder can adapt: If revenue must stay hidden, give the take rate as a range: "net take rate [x–y] bps on $8bn+ volume".
Supporting analysis
What the deck claims: "$8bn+ volume processed annually"; "$XX Dec-21 run-rate net revenue"; "30m total virtual cards issued"; "11 Jurisdiction licenses"; "200+ clients globally"; "100+ countries & territories"; "600+ Colleagues"; "130m+ End customers"; "$XX Capital raised". Footnote: pro-forma financials for the combination of Ixaris and Nium from January 2021.
Presentation choice: It shows the common pattern of keeping flattering volume figures and hiding revenue. Readers notice.
When it does not fit: Don't leave volume and hide revenue without giving any bridge between them.
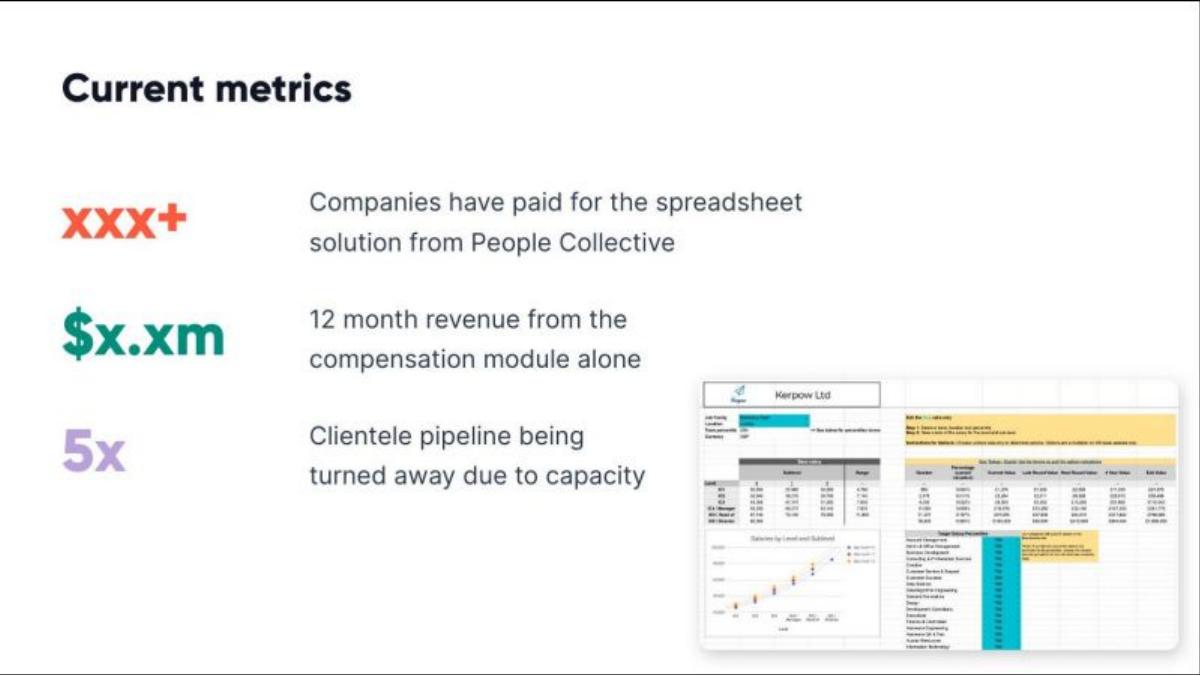
Compensation-planning software grown from a consultancy. A "Current metrics" slide of three figures beside a spreadsheet screenshot.
Heron deck, slide 5. Exact stored slide matched to this analysis.
Our analysis: Digit-count placeholders that act as ranges; one visible multiple with no base.
Evidence and limitation: The placeholders keep the number of digits: "xxx+" means hundreds of paying companies and "$x.xm" means a single-digit millions revenue over 12 months. That gives a reader an order of magnitude without the exact figure. "5x" is visible but has no base: five times what, over which period?
What a founder can adapt: "[100s] of paying companies; $[1–10]M revenue in the last 12 months." Give the 5× a base: "5× the clients we can serve today".
Supporting analysis
What the deck claims: "xxx+ Companies have paid for the spreadsheet solution from People Collective." "$x.xm 12 month revenue from the compensation module alone." "5x Clientele pipeline being turned away due to capacity."
Presentation choice: Keeping the number of digits is a quick way to show scale while hiding the figure.
When it does not fit: Don't leave a multiple visible without saying what it multiplies.
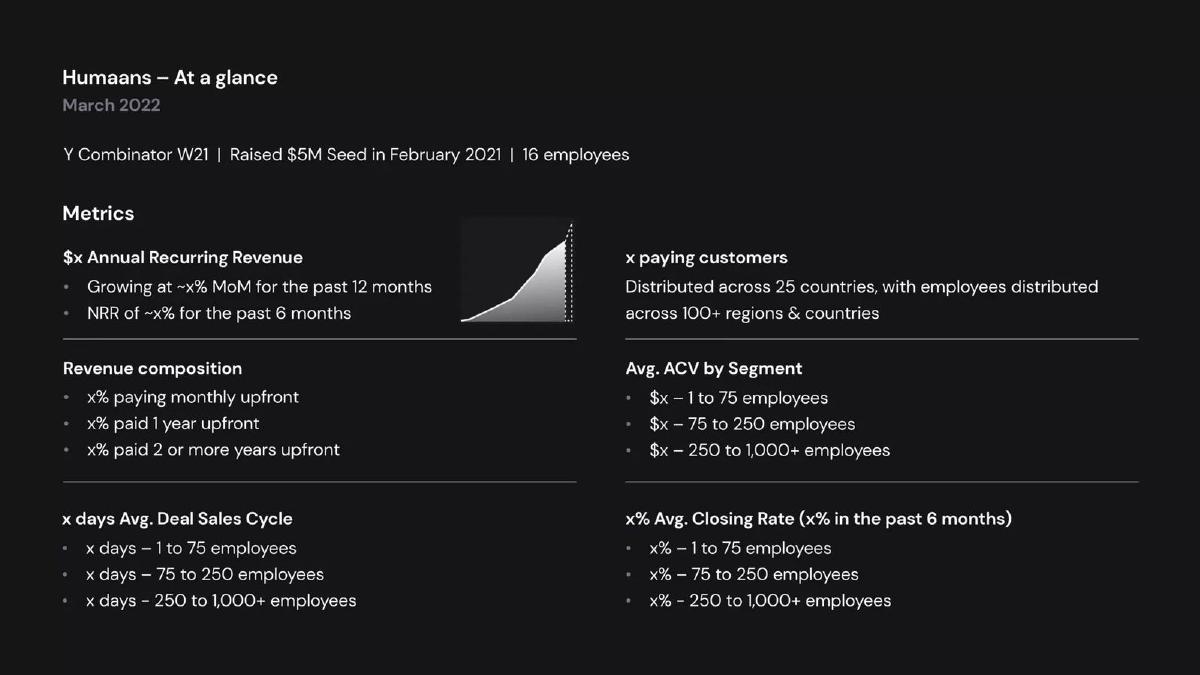
HR software company. An "At a glance, March 2022" metrics slide in six blocks.
Humaans deck, slide 3. Exact stored slide matched to this analysis.
Our analysis: A fully redacted metrics slide that shows only the framework.
Evidence and limitation: Every operating figure is "x". What remains is the structure: the metrics chosen, the periods (12 months, 6 months), the segments (1–75, 75–250, 250–1,000+ employees) and a curve with no axes. The funding, headcount and date are visible. A reader learns how the company measures itself, not how it is doing.
What a founder can adapt: If you must hide all values, keep at least one ratio (MoM growth or NRR) as a range.
Supporting analysis
What the deck claims: "Y Combinator W21 | Raised $5M Seed in February 2021 | 16 employees." "$x Annual Recurring Revenue — Growing at ~x% MoM for the past 12 months; NRR of ~x% for the past 6 months." "x paying customers." Revenue composition, average ACV, sales cycle and closing rate by segment, all as "x". A small unlabelled ARR curve.
Presentation choice: It shows the limit: a well-built metrics page with every value removed carries almost no evidence.
When it does not fit: Don't send a slide where every figure is "x"; drop it or replace it with one range.
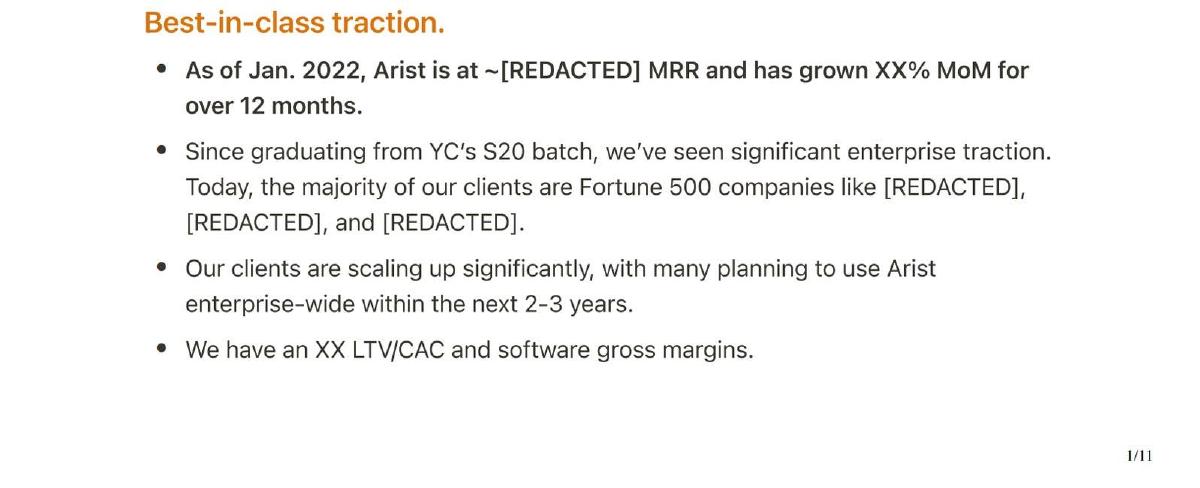
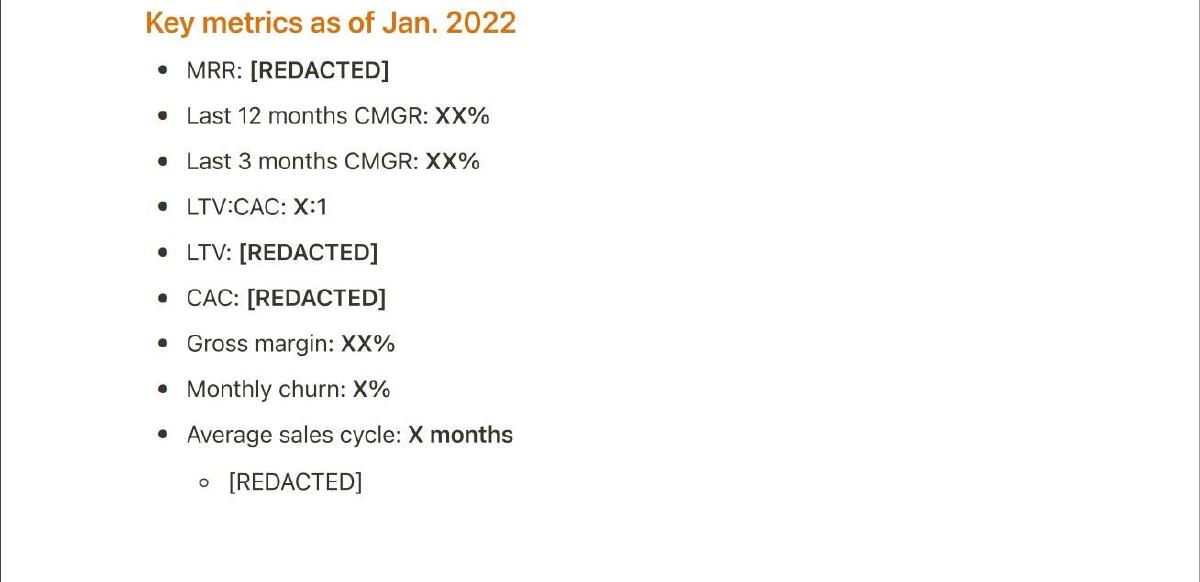
Text-message training platform. A "Best-in-class traction" slide (slide 2) and a "Key metrics as of Jan. 2022" slide (slide 4).
Arist deck, slide 2. Exact stored slide matched to this analysis.Arist deck, slide 4. Exact stored slide matched to this analysis.
Our analysis: Hidden ratios as well as amounts; only digit counts and dates remain.
Evidence and limitation: The dates survive (January 2022, "over 12 months") and so does one qualitative claim: "software gross margins". Every number is hidden, including ratios that reveal nothing about absolute size, such as LTV:CAC and churn. The placeholders keep digit counts ("XX%" growth is double-digit; "X%" churn is single-digit), which is the only quantitative signal left.
What a founder can adapt: Hide MRR and customer names; keep "MoM growth [x]% for 12 months", "LTV:CAC [x]:1" and "monthly churn [x]%".
Supporting analysis
What the deck claims: Slide 2: "As of Jan. 2022, Arist is at ~[REDACTED] MRR and has grown XX% MoM for over 12 months." "The majority of our clients are Fortune 500 companies like [REDACTED], [REDACTED], and [REDACTED]." "We have an XX LTV/CAC and software gross margins." Slide 4: MRR, LTV and CAC "[REDACTED]"; 12-month and 3-month CMGR "XX%"; LTV:CAC "X:1"; gross margin "XX%"; monthly churn "X%"; sales cycle "X months".
Presentation choice: Ratios like LTV:CAC and churn don't reveal company size, so hiding them removes evidence without protecting much.
When it does not fit: Don't redact ratios by default; decide which figures are actually sensitive.
Customer education platform. A summary slide of five labelled rows beside product screenshots.
Skilljar deck, slide 2. Exact stored slide matched to this analysis.
Our analysis: A well-structured summary that keeps digit counts but no ratios or dates.
Evidence and limitation: Digit counts carry the only signal: tens of millions in ARR, hundreds of customers, net retention of 100% or more ("XXX%"). The efficiency line is built as a comparison (burn against ARR), but with both sides hidden a reader can't compute the ratio. Nothing is dated.
What a founder can adapt: "Burn-to-ARR ratio under [x] ([month year])." Keep the ratio even if both amounts stay hidden.
Supporting analysis
What the deck claims: "Skilljar is the leading Customer Education Platform…" Revenue: "$XXM ARR, XX% gross margin." Customers: "XXX customers, XX% gross retention, XXX% net retention." Usage: "XX million learners; XX million hours delivered." Efficiency: "Burned $XXM to reach $XXM ARR." Market: "$XXB opportunity in best fit segments."
Presentation choice: "Burned $X to reach $Y ARR" is a strong format; it just needs one side, or the ratio, left visible.
When it does not fit: Don't hide both sides of a comparison built to show efficiency.
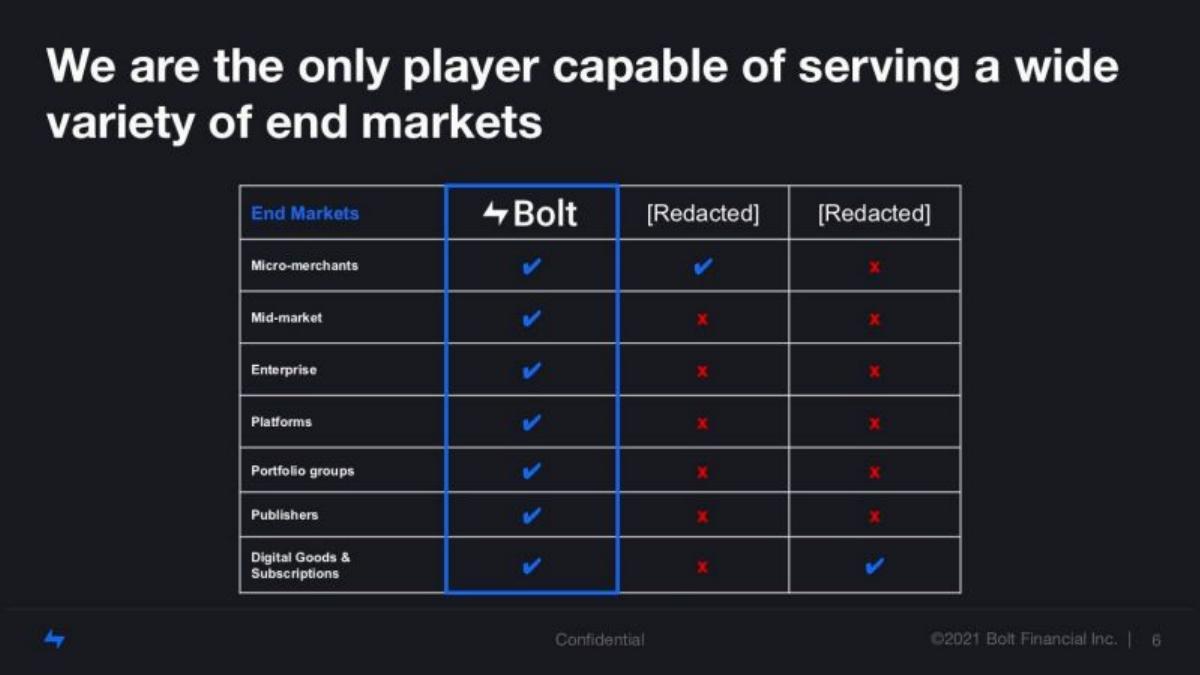
One-click checkout company. A competition table of end markets.
Bolt deck, slide 6. Exact stored slide matched to this analysis.
Our analysis: A redaction that removes the comparison the headline depends on.
Evidence and limitation: Hiding the competitors' names makes the table impossible to check: a reader can't test whether the unnamed rivals really serve only one segment. The claim "the only player" depends on the comparison, and the comparison is the part removed.
What a founder can adapt: Describe the rivals instead of blanking them: "Leading checkout for SMBs (Series C)", "Enterprise payments incumbent".
Supporting analysis
What the deck claims: "We are the only player capable of serving a wide variety of end markets." Columns: Bolt, "[Redacted]", "[Redacted]". Rows: micro-merchants, mid-market, enterprise, platforms, portfolio groups, publishers, digital goods and subscriptions. Bolt has a tick in every row; the two redacted competitors have one tick each.
Presentation choice: It shows that hiding a name can hide the evidence, not just protect a relationship.
When it does not fit: Don't redact the names in a comparison and keep a claim that depends on them.
Technical-screening software company. A customer slide whose content was removed.
Adaface deck, slide 6. Exact stored slide matched to this analysis.
Our analysis: A whole slide removed and labelled; zero evidence left.
Evidence and limitation: Nothing remains to evaluate: no count, no segment, no named customer. The honest label is better than an unexplained gap, but a reader learns only that the original slide had customers on it.
What a founder can adapt: "[n] paying customers, including [x] of the [industry] top 50" gives a count and a segment without naming anyone.
Supporting analysis
What the deck claims: "customers" and "removed for confidentiality reasons", with no logos, names or counts.
Presentation choice: It is the end point of redaction. If the slide can't carry anything, it probably shouldn't be in the shared version.
When it does not fit: Don't keep an empty placeholder slide in a deck you send out.
Which kind of information each slide keeps after the amounts are hidden, and whether the visible figures hold together.
Example
Hidden
Kept
Consistency check
Main gap
Cloosiv
GMV amounts
+40% monthly; dated bars
Chart ≈20× in 13 months (≈26%/mo)
Rate is peak, not average
Empowerly
Sales, margin
6X/year; 20% MoM; dated line
20%/mo ≈ 8.9×/yr; chart 23 months
Rates disagree
Cloudsmith
ARR, customers, NPS, NRR
3X in 2020; 10% MoM; usage
10%/mo ≈ 3.1×/yr: consistent
Half the tiles empty
Daydream
ARR values
K→M units; dated bars
Chart 7 quarters vs "<1 year"
Period; ARR vs CARR
Veremark
CAC, ACV, CLTV, sales cycle
Payback months; CLTV:CAC multiples
Multiples can't be recomputed
Segments unnamed; chart bars unlabelled
Faye
Sales, market size
"$Millions"; 48 states
Range labelled as redacted
Penetration % with no base
Nium
Net revenue, capital raised
$8bn+ volume; counts
Take rate can't be computed
Economics
Heron
Customer count, revenue
Digit counts; 5x
"5x" has no base
Base for multiple
Humaans
Every operating figure
Metric framework; dates
Nothing to check
Any value
Arist
All numbers incl. ratios
Dates; digit counts
Nothing to check
Ratios hidden needlessly
Skilljar
All numbers
Digit counts; burn-vs-ARR format
Ratio can't be computed
Dates; one ratio
Bolt
Competitor names
Ticks per segment
Comparison can't be checked
Rival descriptions
Adaface
Entire slide
Label only
Nothing to check
Count and segment
Key Takeaways
Replace amounts with something checkable: a growth rate, a multiple, a range or a dated chart.
If you keep a chart, keep the dates and start the axis at zero, so the shape can be read.
Check that the visible growth rate matches the chart and the period in the headline.
A list of hidden metrics ("MRR: [REDACTED]") shows only that you track them.
Hiding competitor or customer names removes the comparison, not just the name.
Say where the full numbers are available: a data room, a metrics deck or the meeting.
Decide what to hide
Go through each number on the slide before you share a redacted version.
Sensitive?. Would this exact figure help a competitor or breach an agreement? If not, keep it.
Ratio instead. Can a growth rate, multiple or margin replace the amount?
Range instead. Can you give an order of magnitude: $1–5M, hundreds of customers?
Consistency. Do the visible rates agree with each other, the chart and the headline period?
Where to find it. Say where the full figure is available: data room, metrics deck, meeting.
Copyable framework: [Metric] [range or ratio] over [period] (exact figure available in [place]).
Illustrative example 1 — written by us
Before: MRR: [REDACTED]; last 12 months CMGR: XX%
After: MRR in the $[x–y]K range (Jan 2022); compound monthly growth [x]% over the last 12 months.
What improved: Our illustrative rewrite; not Arist's wording. Bracketed values are placeholders. It keeps a range and the growth rate while still hiding the exact MRR.
What this guide adds
The growth rate, run rate and capital efficiency guides show how to present traction figures. Several of their examples have blanked values, but they don't cover the choice itself. This page covers how to share a deck with numbers hidden: what to hide, what to keep, and what a reader can still check.
Where these redactions came from
Most of these decks were redacted by the company before the deck was made public, not necessarily in the version investors saw. We can't tell from the slides which figures an investor was shown. The lesson still applies to any deck you send ahead of a meeting or post publicly: once the amounts are gone, only the relationships remain.
Four ways to hide a number, from most to least informative
Keep the ratio, hide the amount: "+40% monthly", "3X ARR growth", "20% MoM". A reader can judge momentum without knowing size.
Keep the shape, hide the scale: a dated chart with the axis values removed. A reader can see the trend and how steady it is.
Give a range: "$Millions in sales". A reader knows the order of magnitude.
Hide everything: "MRR: [REDACTED]", "XX% gross margin". A reader learns only which metrics you track.
How we read each slide
We quote what remains visible on the stored slide images. We check what a reader can still work out, whether the visible numbers agree with each other and with the chart, and whether dates match the headline. Chart measurements are ours, taken from bar heights in pixels, and assume the axis starts at zero unless stated.
Common mistakes
Hiding ratios by default. Growth, churn and LTV:CAC rarely reveal size; keep them.
Rates that disagree. Check that monthly and annual figures compound to each other.
Headline period vs chart. "In one year" above a two-year chart invites doubt.
Percentage with no base. A share of a hidden figure can't be read.
Blanked comparisons. Hidden rival names make the comparison uncheckable.
Results without inputs. Keeping payback and CLTV:CAC while blanking CAC, ACV and CLTV leaves nothing a reader can recompute.
Unnamed segments. "Segment 1, 2, 3" hides which customers the best numbers describe.
Empty placeholder slides. Drop a slide that has nothing left on it.
Diagnostic checklist
Only truly sensitive figures are hidden.
Each hidden amount is replaced by a ratio, range or dated shape where possible.
Visible rates agree with each other and with the chart.
Chart dates match the headline period; axis starts at zero.
Segments, cohorts and chart categories are named, even when the values are hidden.
Comparisons keep enough detail to be checked.
The slide says where the full figures are available.
Frequently asked questions
How we chose these examples
Corpus: published pitch deck teardowns on StartupFundraising.com. Founder-uploaded private decks are excluded.
Selection (2026-09-26): we searched stored slide text on slides 2–15 for [REDACTED], redacted, "removed for confidentiality", XX%, X:1, $X and $XM, then inspected each stored image. We kept startup slides where the redaction affects what the slide can show, and excluded legal disclaimers, "confidential" footers and public-company decks. Slides without a stored image were not used.
Veremark was added on 2026-09-30 from our production queue. Its slide hides values by leaving table cells blank rather than marking them redacted, so the earlier text search did not reach it; the page was rendered from the original public deck file (17 pages, checksum matched) and read from the image.
Most redactions were probably applied by the companies before their decks were made public; we can't tell what investors originally saw. Visible text is quoted as shown. Chart measurements are ours, from bar heights in pixels, and assume a zero-based axis unless stated. Compounding figures are ours: (1 + monthly rate)^12 for annual multiples.
Review: stored slide text and images were checked on 2026-09-26, and on 2026-09-30 for Veremark 15, and matched to company, deck and slide number (editorial model review). No person has yet completed an editorial review of this page. We make no claim that any slide caused a fundraising outcome.