Nium’s 2021 Series D pitch deck is a clinical exercise in demonstrating scale and regulatory dominance. Raising $200M, the company moved beyond the typical 'disruptor' narrative to present itself as the foundational infrastructure for the entire fintech sector. The deck leans heavily on geographic coverage, citing presence in over 100 countries and 11 specific jurisdiction licenses. By showcasing $8bn+ in annual processed volume and a team with deep institutional pedigree (Visa, PayPal, Citi), Nium successfully argued that their 'moat' isn't just code—it is the hard-won legal and operational…
Key takeaways
- Nium emphasizes a 'one API' solution to connect the world to modern payments infrastructure (Slide 1).
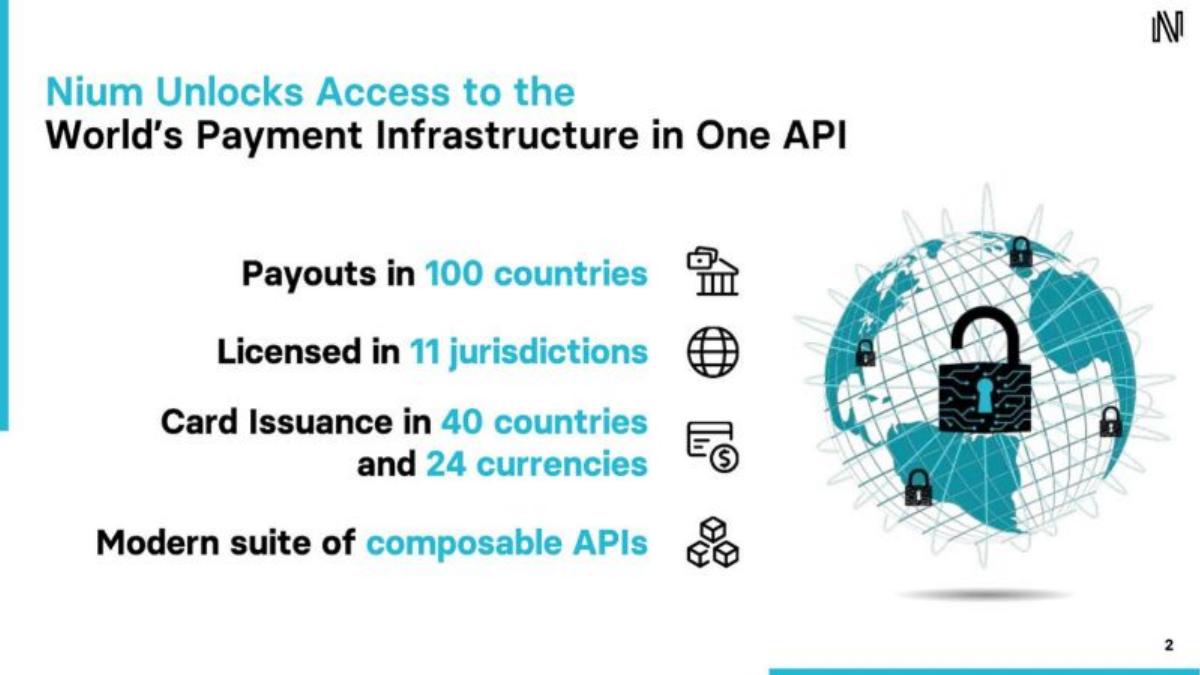
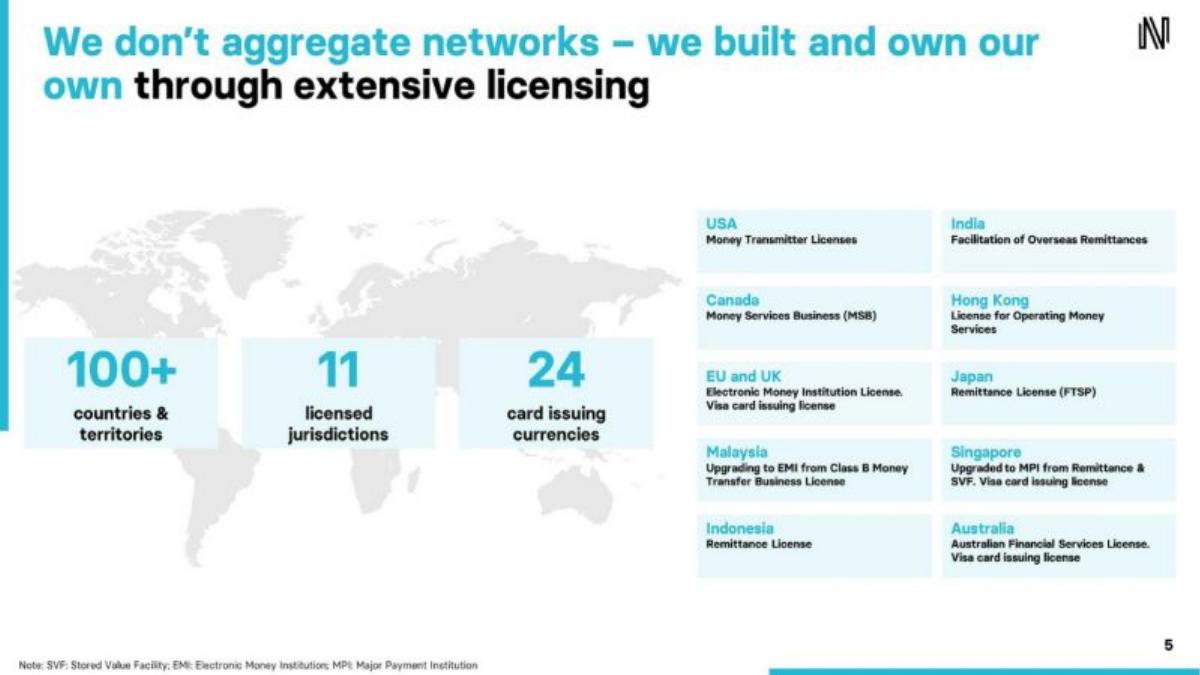
- The company highlights a massive regulatory moat with 11 jurisdiction licenses and card issuance in 40 countries (Slide 2).
- Scale is proven with $8bn+ in annual volume and 30 million virtual cards issued (Slide 3).
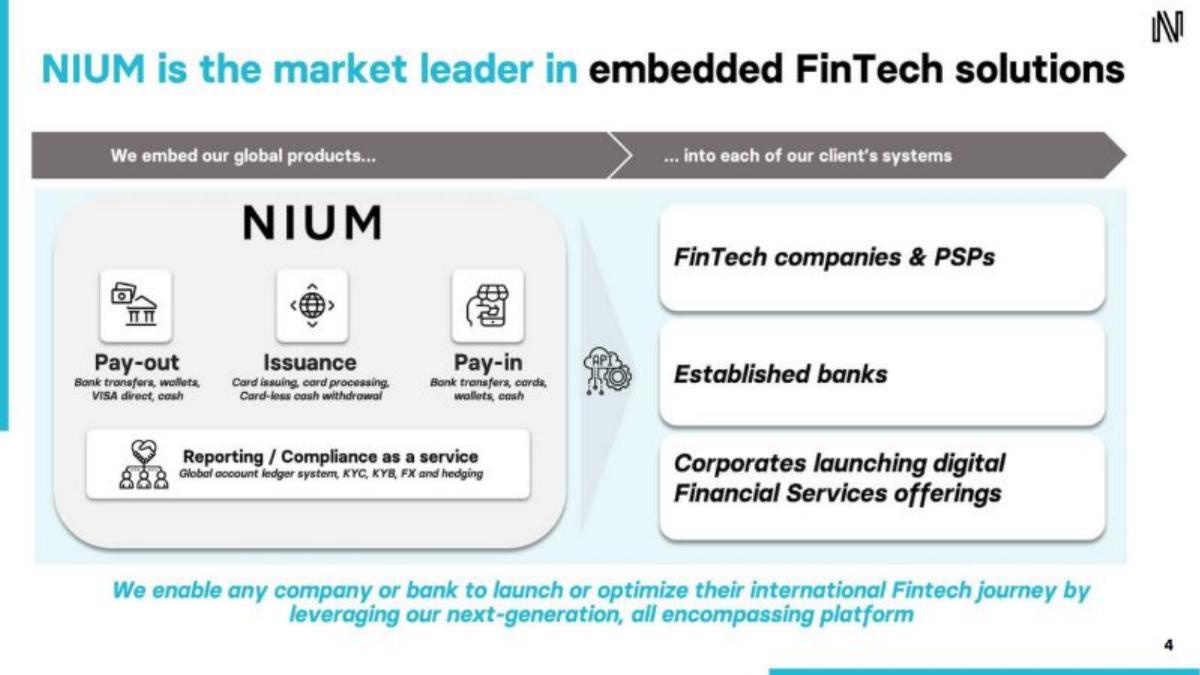
- The business model targets three distinct tiers: Fintechs/PSPs, established banks, and corporates (Slide 4).
- Nium differentiates by owning its network through extensive licensing rather than just aggregating others (Slide 5).
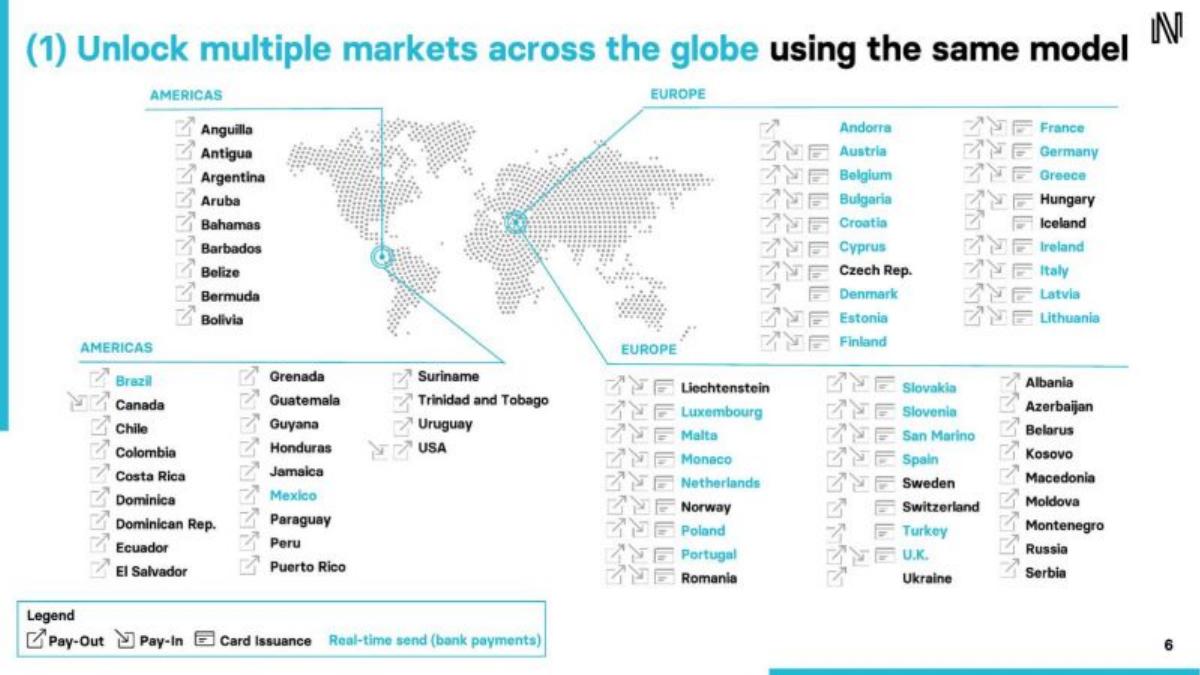
- Geographic dominance is visualized through exhaustive lists of supported markets in the Americas, Europe, Africa, and Asia (Slides 6-8).
- Operational efficiency is signaled by 99% uptime and 60% of payments completed in under 15 minutes (Slide 9).
- The management team features heavyweights from PayPal, Visa, Citi, and Standard Chartered (Slide 11).
The Infrastructure Play: Nium’s Series D Strategy
Nium’s 2021 pitch deck is a high-signal document designed for growth-stage investors. At the Series D level, investors are less concerned with 'the dream' and more focused on 'the machine.' Nium delivers this by showcasing a global regulatory footprint that is nearly impossible for new entrants to replicate quickly. The deck is structured to prove that Nium has already done the hard work of securing licenses and building rails, making them the default choice for any company needing embedded fintech solutions.
Slide 1: The Hook
The cover slide establishes Nium’s identity: Connecting the World to a Modern Payments Infrastructure with one API . The date is July 2021. The imagery is standard fintech—a smartphone with a glowing digital interface—but the sub-headline 'with one API' is the critical value driver. It promises simplicity in a notoriously complex industry.
Slide 2: The Value Proposition
Slide 2 immediately quantifies the 'one API' promise. It lists four pillars: Payouts in 100 countries , Licensed in 11 jurisdictions , Card Issuance in 40 countries and 24 currencies , and a Modern suite of composable APIs . By leading with these numbers, Nium signals that their value is in their reach and their regulatory compliance.
Slide 3: Proof of Scale
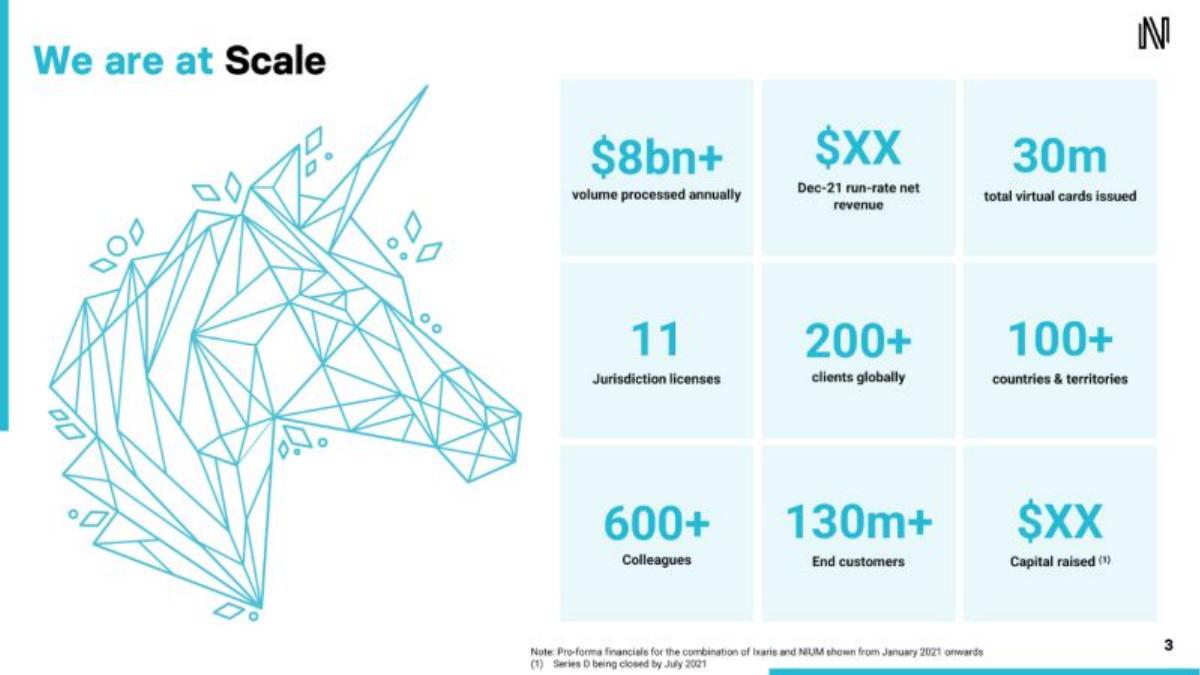
Titled 'We are at Scale,' this slide uses a 3x3 grid of metrics to overwhelm any doubt about their market position. Key figures include:
$8bn+ volume processed annually · 30m total virtual cards issued · 11 Jurisdiction licenses · 200+ clients globally · 600+ Colleagues · 130m+ End customers
The slide also notes that the Series D is being closed by July 2021, though the specific capital raised and net revenue figures are redacted as '$XX'.
Slide 4: The Market Leader in Embedded Fintech
This slide explains the 'how' and 'who.' Nium divides its product into four modules: Pay-out, Issuance, Pay-in, and Reporting/Compliance as a service. It then maps these to three customer tiers: Fintechs/PSPs, Established banks, and Corporates. This demonstrates a broad Total Addressable Market (TAM) that isn't reliant on a single customer type.
Slide 5: The Regulatory Moat
This is arguably the most important slide in the deck. Nium states: 'We don’t aggregate networks – we built and own our own through extensive licensing.' This is a direct shot at competitors who might just be 'wrappers' around other providers. They list specific licenses across the USA, Canada, EU/UK, Malaysia, Indonesia, India, Hong Kong, Japan, Singapore, and Australia. This slide proves that Nium is a primary provider, not a middleman.
Slides 6, 7, and 8: Global Market Unlock
These three slides provide an exhaustive, region-by-region breakdown of their capabilities. Slide 6 covers the Americas and Europe, Slide 7 covers Africa, and Slide 8 covers Asia and Oceania. Each country is tagged with icons for Pay-Out, Pay-In, Card Issuance, or Real-time send. The sheer density of these lists serves as a visual 'shock and awe' tactic to prove global dominance.
Slide 9: Platform Performance
Nium moves from 'where' they operate to 'how well' they operate. They highlight:
1M+ API calls per day · 60% of payments made within less than 15 mins · 99% Uptime · 90%+ go-live in under 6 months
They also mention their proprietary AML/KYC controls, reinforcing the 'Compliance-as-a-Service' aspect of their business.
Slide 10: The Summary
This slide acts as a recap, using a circular diagram to show how their global license portfolio, identity/KYC, AML, and payment processing create a virtuous cycle. The text boxes on the right emphasize speed to market, customization, and cost reduction through 'smart transaction routing.'
Slide 11: The Management Team
For a $200M round, the team must be world-class. Nium showcases 12 executives with logos from their former employers, including Visa, PayPal, Citi, JP Morgan, eBay, Western Union, and Standard Chartered . This slide communicates that the company is run by industry veterans who understand the legacy systems they are replacing.
Slide 12: External Reference
The final slide is a promotional page for the source of the deck, bestpitchdeck.com, and does not contain Nium-specific information.
What Nium Does Exceptionally Well
Nium’s deck is a masterclass in Moat Documentation . In fintech, the hardest thing to do is not writing the code, but getting the licenses. By dedicating Slide 5 and Slides 6-8 to their regulatory and geographic footprint, they make a compelling case that they are years ahead of any potential competitor. They also do an excellent job of balancing 'Hard Metrics' (Slide 3) with 'Operational Metrics' (Slide 9), showing that they are both big and efficient.
What is Missing from the Nium Deck
Despite its strengths, the deck has notable omissions: 1. Financial Projections: There is no slide showing where the company expects to be in 3-5 years. While typical for a redacted public version, it leaves the 'growth' story purely to the imagination. 2. The 'Ask': There is no slide detailing how the $200M will be deployed. Will it go toward more licenses? Marketing? M&A? (Though the catalogue facts mention the acquisition of Ixaris, the deck only hints at this in a footnote on Slide 3). 3. Competitive Landscape: Nium ignores competitors like Airwallex or Wise entirely. While Slide 5 hints at their differentiation (owning vs. aggregating), a direct comparison is missing. 4. Unit Economics: There is no mention of take rates, margins, or Customer Acquisition Cost (CAC). For a Series D, these are usually scrutinized heavily.
What Founders Should Copy
1. The 'One API' Narrative: If you are building infrastructure, your goal is to make the complex seem simple. Nium’s repeated use of 'One API' is a perfect example of this. 2. Visualizing Coverage: If your business relies on a network effect or geographic reach, don't just say 'we are global.' Show the list of countries. The density of Slides 6-8 is very persuasive. 3. Pedigree Alignment: Notice how Slide 11 uses logos of established giants (Visa, Citi). This transfers the trust of those massive institutions to the startup. 4. Modular Product Display: Slide 4 does a great job of showing how different products (Pay-in, Pay-out, Issuance) serve different customer segments. This helps investors see multiple paths to revenue.
Frequently asked questions
- How much did Nium raise with this deck?
- According to the catalogue facts, Nium raised $200M in a Series D round in 2021. Slide 3 mentions the Series D was being closed by July 2021, though the specific dollar amount is redacted as '$XX' on that slide.
- What is Nium's core value proposition?
- Nium positions itself as a 'one API' gateway to global payments. As shown on Slide 4 and Slide 9, they provide pay-out, pay-in, card issuance, and compliance-as-a-service, allowing customers to bypass the complexity of building their own international remittance infrastructure.
- What metrics does Nium use to prove scale?
- On Slide 3, Nium lists $8bn+ in annual volume, 30 million virtual cards issued, 200+ global clients, and 130m+ end customers. They also cite 1M+ API calls per day on Slide 9.
- Who are Nium's target customers?
- Slide 4 identifies three primary segments: Fintech companies and Payment Service Providers (PSPs), established banks, and large corporates launching digital financial services.
- What is missing from the Nium pitch deck?
- The deck lacks a traditional 'Competitor' slide and specific 'Unit Economics' or 'Financial Projections.' While it mentions revenue run-rate on Slide 3, the actual figures are redacted. There is also no explicit 'Ask' slide detailing how the $200M would be spent.