Bolt’s Series D deck is a departure from traditional pitch structures, opting for a high-level narrative on network effects rather than granular financial disclosures. Raising $393M in 2021, the company used just 12 slides to argue that they are the only player capable of unifying the fragmented e-commerce landscape. The deck highlights a network of 5.6 million shoppers and a 75% conversion rate for Bolt users compared to 49% for guest shoppers. Notably, the deck omits a traditional team slide, detailed unit economics, and a specific use-of-funds breakdown, suggesting a high degree of existin…
Key takeaways
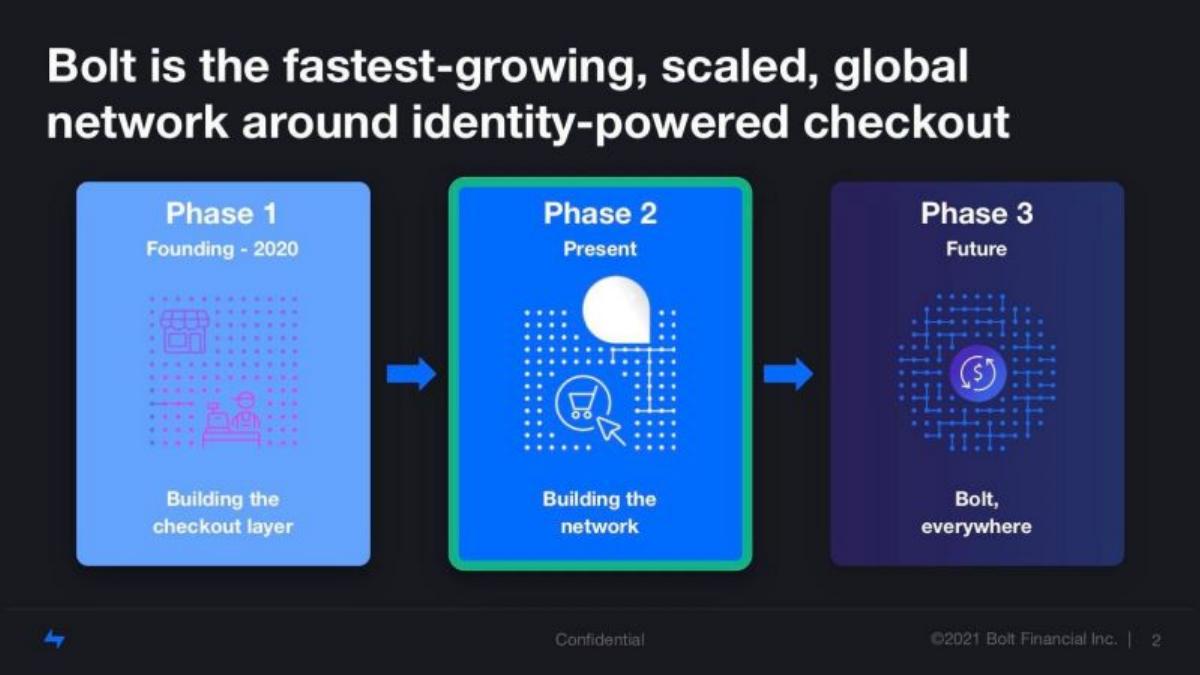
- The deck frames the company's evolution in three phases, moving from building a checkout layer to a global network (Slide 2).
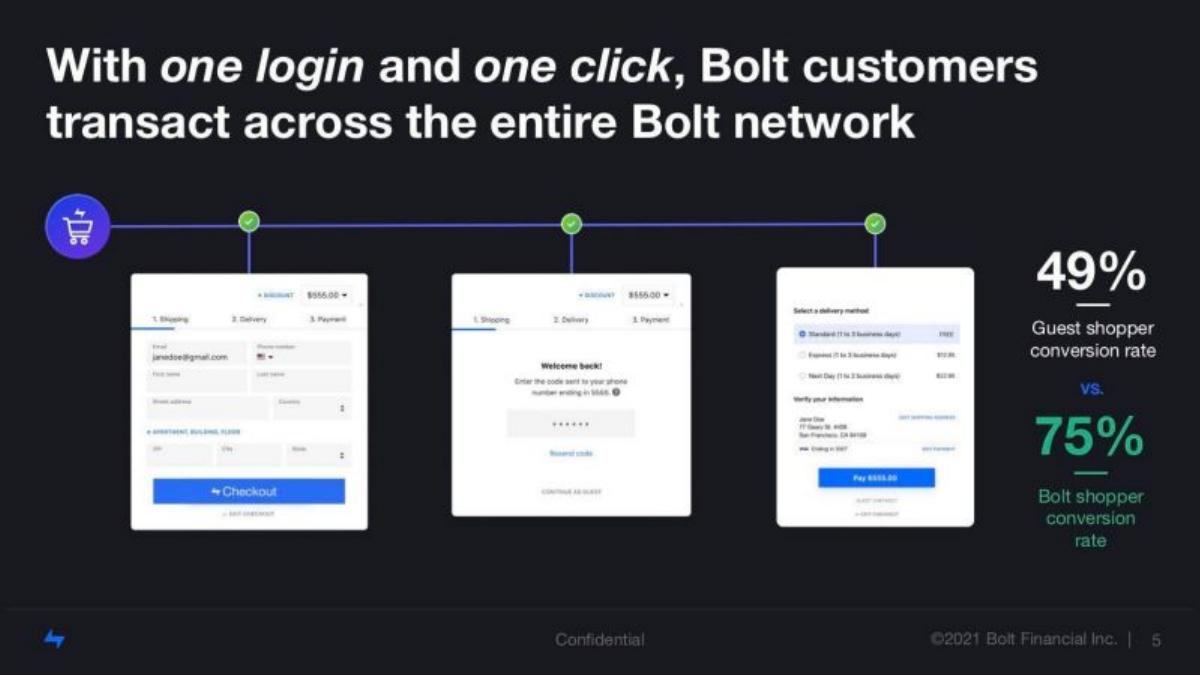
- Bolt claims a 75% conversion rate for its shoppers versus 49% for guest shoppers, a 53% relative increase (Slide 5).
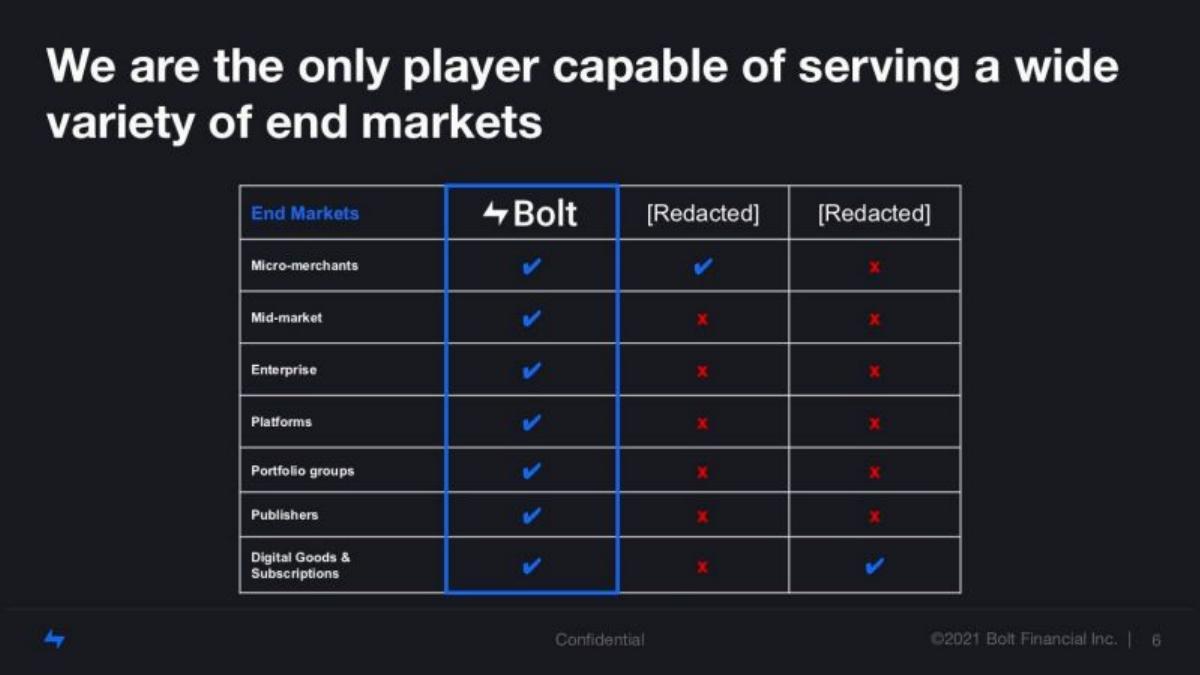
- A competitive matrix shows Bolt serving seven distinct end markets, while redacted competitors only serve one or two (Slide 6).
- The network reached 5.6 million one-click shoppers with 180%+ year-over-year growth at the time of the raise (Slide 7).
- Merchant metrics include a 50% higher conversion rate and a 38% faster completion time compared to guest checkout (Slide 7).
- Network-driven transactions as a percentage of total GMV grew from under 1% to nearly 5% in approximately 15 months (Slide 8).
- The deck projects that at 50 million accounts, Bolt will power approximately 1/3 of a merchant's transactions before they even sign up (Slide 10).
- There is no team slide, no financial projections, and no specific 'ask' or valuation mentioned within the 12 slides.
The Narrative of Ubiquity
Bolt’s Series D pitch deck is a masterclass in late-stage narrative building. Unlike seed or Series A decks that must prove a problem exists, Bolt assumes the problem of checkout friction is well-understood. Instead, the 12-slide presentation focuses entirely on scale, network effects, and the 'Holy Grail' of commerce . The deck is designed to justify a massive $393M infusion by showing that Bolt is no longer just a software tool, but a burgeoning financial network. The visual style is dark, minimalist, and data-heavy, signaling a level of institutional maturity expected at this stage.
Slides 1-3: The Vision and Evolution
Slide 1 is a standard title card, establishing the brand and the tagline: "The ubiquitous checkout." The use of the word "ubiquitous" is a deliberate choice, setting the stage for the network-scale arguments that follow.
Slide 2 provides a three-phase roadmap. Phase 1 (Founding - 2020) is described as "Building the checkout layer." Phase 2 (Present) is "Building the network." Phase 3 (Future) is "Bolt, everywhere." By highlighting Phase 2, Bolt tells investors exactly where their money is going: scaling the network that was validated in Phase 1. This slide is effective because it simplifies a complex business history into a logical progression toward total market saturation.
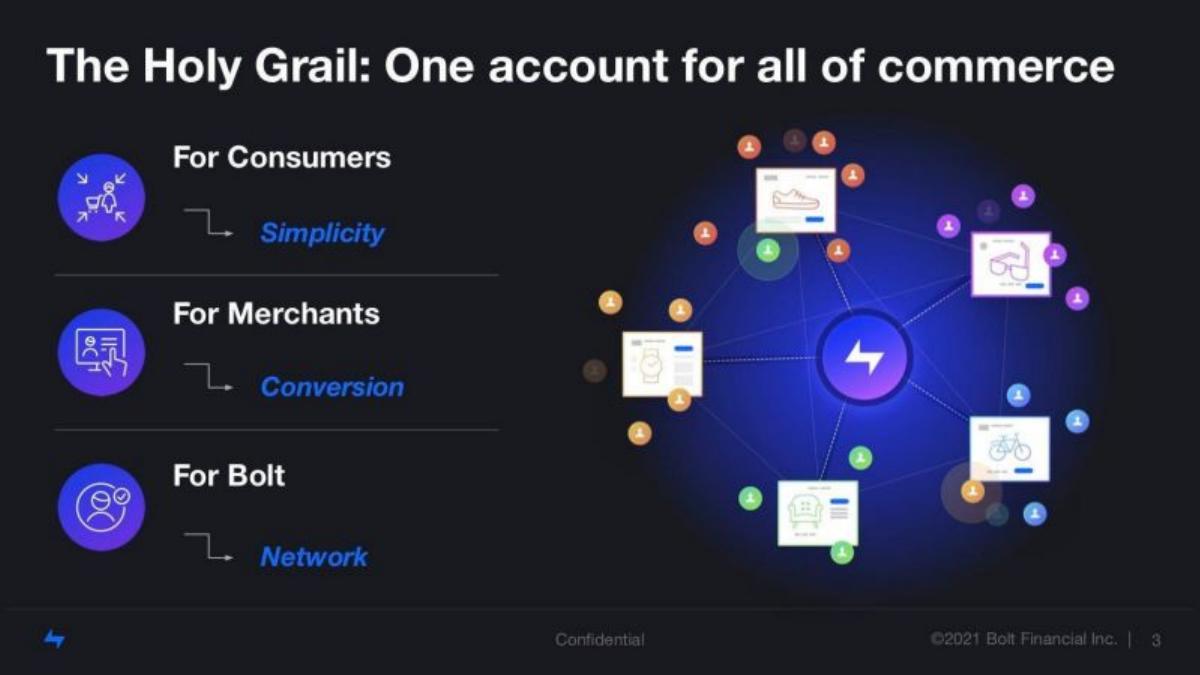
Slide 3 introduces "The Holy Grail: One account for all of commerce." It breaks down the value proposition into three pillars: Simplicity for consumers, Conversion for merchants, and Network for Bolt. The accompanying graphic shows a web of shoppers and merchants connected by the Bolt logo, visually reinforcing the idea that Bolt is the glue holding the fragmented e-commerce ecosystem together.
Slides 4-5: The Friction and The Solution
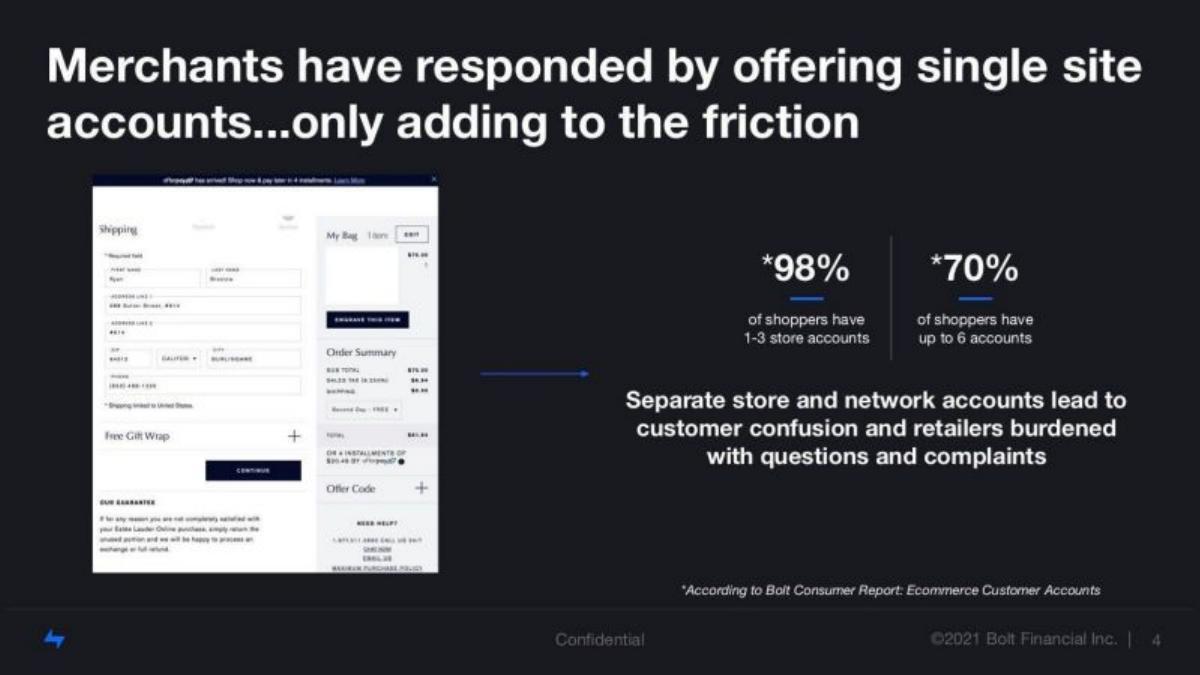
Slide 4 addresses the current market failure. It notes that 98% of shoppers have 1-3 store accounts and 70% have up to 6 accounts, citing the "Bolt Consumer Report." The slide argues that separate store and network accounts lead to confusion and retailer burden. This sets up the 'hero' moment on the next slide.
Slide 5 presents the core product value proposition with hard data. It shows a three-step checkout process (Shipping, Delivery, Payment) and contrasts two key metrics: a 49% guest shopper conversion rate versus a 75% Bolt shopper conversion rate . This 26-percentage-point difference is the primary economic engine of the company. If a merchant can increase conversion by over 50% just by switching checkout providers, the sales pitch becomes an easy mathematical decision.
Slides 6-8: Market Dominance and Network Effects
Slide 6 is a competitive matrix. Bolt lists seven "End Markets," including Micro-merchants, Mid-market, Enterprise, Platforms, Portfolio groups, Publishers, and Digital Goods & Subscriptions. Bolt claims to serve all seven, while two redacted competitors are shown serving only one or two each. This slide is intended to show that Bolt is a horizontal platform with a much larger Total Addressable Market (TAM) than its rivals.
Slide 7 focuses on the impact of network-driven transactions. It highlights a network of 5.6 million one-click shoppers growing at 180%+ YoY . It also lists four "Merchant Metrics": 50% higher conversion rate, 39% more likely to repurchase, 23% higher Average Order Value (AOV), and 38% faster completion time. These are the "meat" of the deck, providing the evidence that the network actually works for the retailers paying for the service.
Slide 8 titled "The network effect is explosive," contains two charts. The first shows "Network Driven Transactions (% all GMV)" climbing from near zero in early 2020 to approximately 5% by April 2021. The second chart shows "Breakout Verticals," with Furniture growing from 12% to 49% and Automotive from 12% to 31% between January 2020 and May 2021. This proves that the model is not just working in fashion or small-ticket items, but across high-value categories.
Slides 9-12: Scale, Future, and Culture
Slide 9 is a logo wall of merchants "Live with Bolt." Notable names include Forever 21, Badgley Mischka, and Swiss Gear. A blue box at the top contains the placeholder "$XB GMV Live with Bolt," suggesting that the specific multi-billion dollar figure was shared in person or in a different version of the deck.
Slide 10 asks, "What happens when we hit critical mass?" It posits that at 50 million accounts , Bolt will power approximately 1/3 of a merchant's transactions before the merchant even signs up. This is the ultimate 'moat' argument: if Bolt already owns the customer identity for a third of a store's traffic, the store is effectively forced to use Bolt to capture that revenue.
Slide 11 pivots to "Conscious Culture." It features a Fast Company article titled "This fintech startup thinks it can help companies build conscious business cultures," featuring founder Ryan Breslow. While seemingly out of place in a technical deck, this slide serves to humanize the brand and position the company as a thought leader in the "future of work," which was a high-priority topic for investors during the 2021 fundraising environment.
Slide 12 concludes with the vision statement: "One account for all of commerce," accompanied by a lifestyle image of a consumer using a tablet. It brings the deck back to the human element of the transaction.
What Makes This Deck Work?
The strength of this deck lies in its singular focus on the network effect . By Series D, investors aren't looking for a list of features; they are looking for a compounding advantage that makes the company's growth inevitable. Bolt uses Slide 8 and Slide 10 to paint a picture of a business that gets exponentially more valuable with every new user. The data points on Slide 7 (50% higher conversion, 38% faster completion) are powerful because they translate directly into bottom-line revenue for Bolt's customers, making the product 'sticky.'
What Is Missing?
For a teardown, the omissions are as interesting as the inclusions. There is no team slide , which is highly unusual for a standard pitch deck. This implies that the leadership was already well-known to the Series D investors or that this deck was part of a larger presentation suite. There are also no financial projections (revenue, EBITDA, burn rate) and no unit economics (CAC, LTV). While these are certainly in the data room, their absence here suggests this deck was intended to sell the 'dream' and the 'momentum' rather than the balance sheet. Finally, there is no specific 'Ask' slide detailing how the $393M would be spent, which is typical for late-stage rounds where the amount is often determined by investor appetite rather than a specific budget.
Lessons for Founders
Focus on the 'Why Now': Bolt frames their current state as the tipping point for a network effect. If you are raising a later round, you must show how your growth is becoming more efficient over time. · Use Comparative Metrics: The 75% vs 49% conversion rate comparison (Slide 5) is the most memorable part of the deck. Find the one metric where you crush the status quo and make it the centerpiece of your value prop. · Sell the Moat: Slide 10 is a brilliant way to describe a moat. By projecting what happens at 50M users, they show investors that the company's competitive advantage is self-reinforcing. · Keep it Lean: 12 slides for a $393M raise proves that you don't need a 50-page deck if your core metrics and narrative are strong enough.
Frequently asked questions
- Why does the deck omit a team slide and financial projections?
- At Series D, investors are typically already familiar with the founding team, or this information is provided in a comprehensive data room. Bolt's deck focuses on the 'macro' story of network effects and market dominance, which is often more critical for late-stage valuation than re-introducing the founders. The omission suggests the deck was a narrative tool to support a broader due diligence process.
- What is the significance of the 'Phase 2' highlight on Slide 2?
- Slide 2 positions Bolt in 'Phase 2: Building the network.' This is a strategic choice to show that the initial technical risk (Phase 1) is over, and the company is now in a high-growth scaling phase. It sets the stage for the Series D capital to accelerate the transition to 'Phase 3: Bolt, everywhere,' which represents the ultimate exit or IPO-scale vision.
- How does Bolt use competitive benchmarking without naming names?
- On Slide 6, Bolt uses a feature matrix with two '[Redacted]' competitors. By showing a column of checkmarks for Bolt across all markets (Micro-merchants to Publishers) versus mostly 'X' marks for competitors, they frame themselves as the only horizontal solution in a vertical-heavy market. This forces investors to focus on Bolt's versatility rather than comparing them feature-for-feature with a specific rival.
- What specific metrics are used to prove the network effect?
- Slide 8 is the most critical for this. It shows a line graph of 'Network Driven Transactions' as a percentage of total Gross Merchandise Volume (GMV). By showing this percentage steadily climbing toward 5%, Bolt proves that their value to a merchant increases as more shoppers join the Bolt network elsewhere, which is the definition of a classic network effect.
- What is the 'Conscious Culture' slide doing in a Series D deck?
- Slide 11 highlights Bolt's 'Conscious Culture' movement. In 2021, ESG (Environmental, Social, and Governance) and company culture were significant talking points for late-stage VCs. By including a Fast Company feature of CEO Ryan Breslow, Bolt signals that they are a 'modern' enterprise capable of attracting top talent and maintaining a public-facing brand identity beyond just being a checkout button.