Honey’s pitch deck is a concise 8-slide presentation that successfully transitioned the company from a simple browser extension to a massive data play. The deck identifies a specific friction point—the 'promo code' box—and quantifies the resulting cart abandonment. By January 2015, the company reported 330,634 active shoppers and over $50 million in Gross Merchandise Volume (GMV). The most effective part of the deck is the direct comparison to Ebates, using a known $1 billion exit as a benchmark to justify Honey's potential $1.8 million monthly monetization. While the deck lacks a formal 'Ask…
Key takeaways
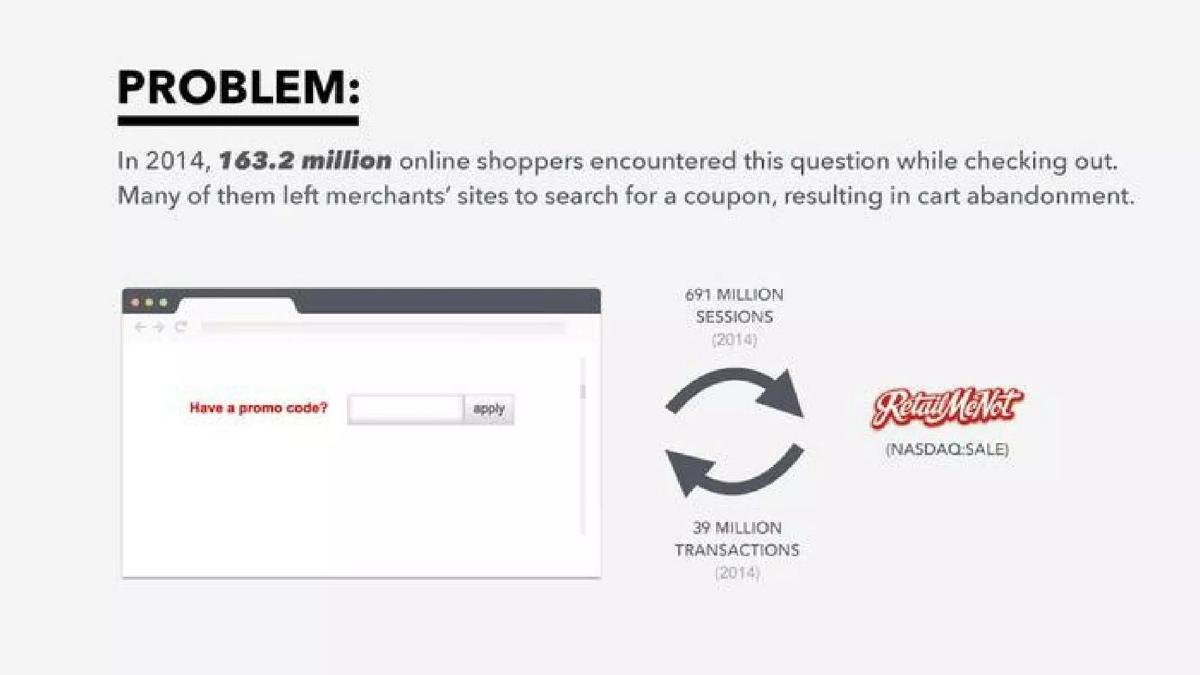
- The problem slide quantifies the market by stating 163.2 million shoppers encountered promo code boxes in 2014, leading to cart abandonment (Slide 2).
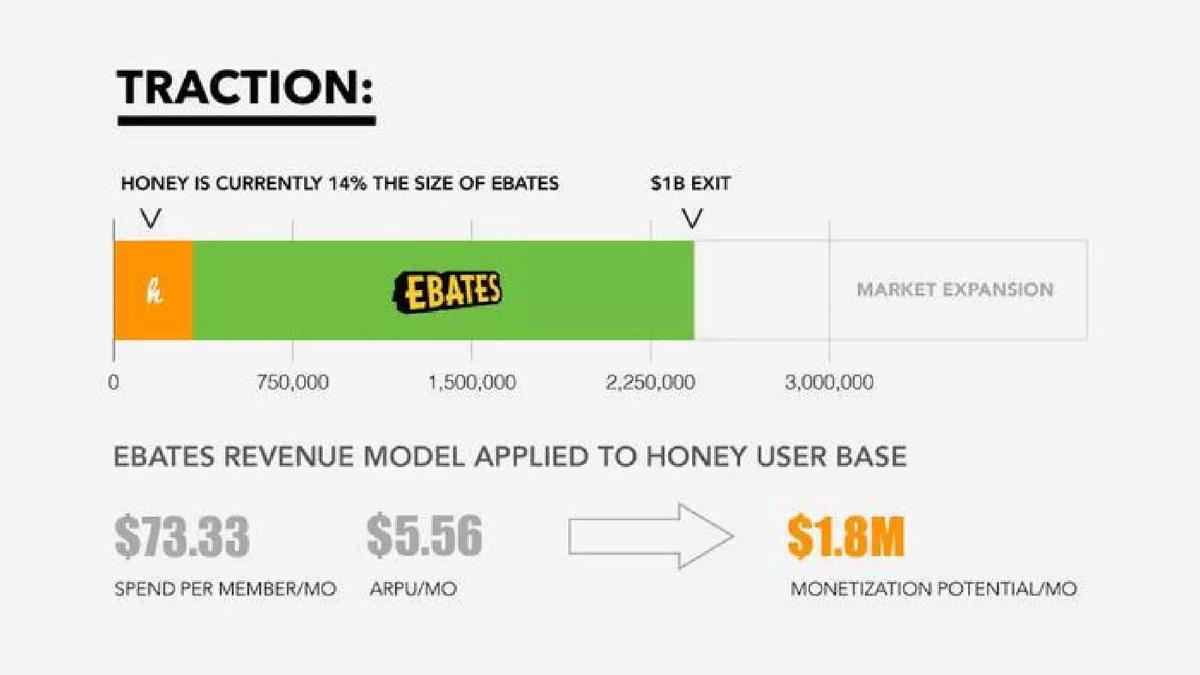
- Honey benchmarks its growth against Ebates, claiming to be 14% of their size with a clear path to a $1B exit (Slide 5).
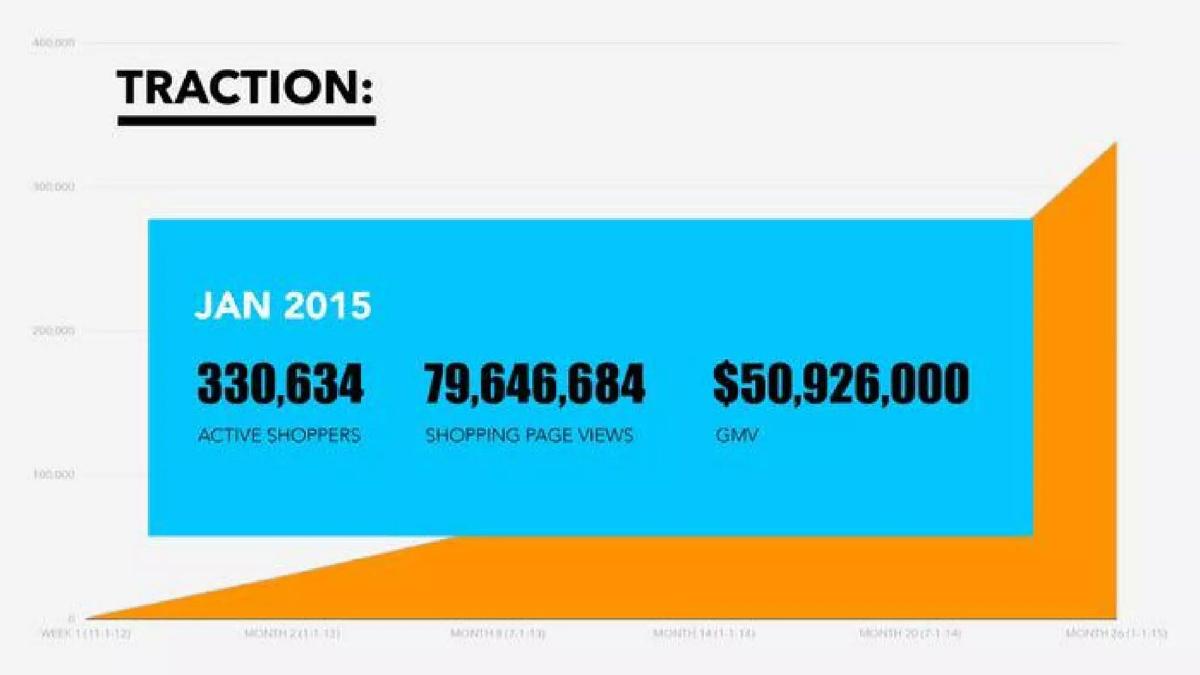
- Traction is demonstrated through three core metrics as of Jan 2015: 330,634 active shoppers, 79.6M page views, and $50.9M in GMV (Slide 4).
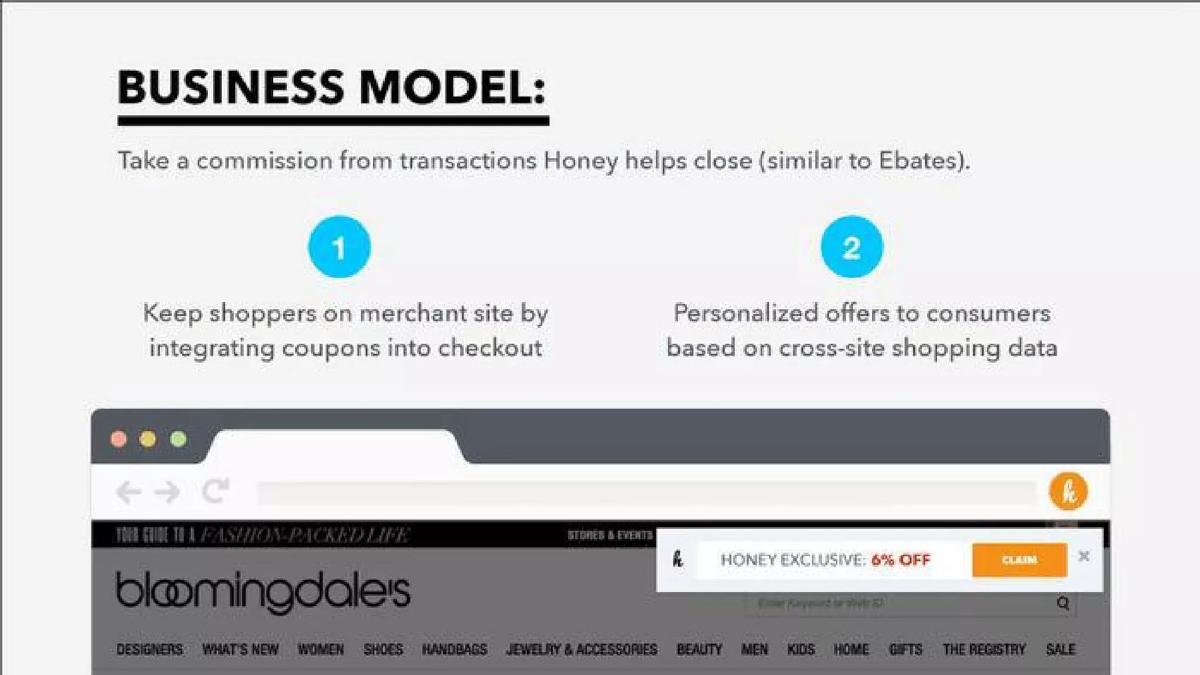
- The business model is explicitly commission-based, taking a cut of transactions the extension helps close (Slide 6).
- Honey defines its 'Unfair Advantage' as the ability to predict user intent and price sensitivity through cross-site shopping data (Slide 7).
- The monetization potential is calculated at $1.8M per month based on an ARPU of $5.56 applied to their current user base (Slide 5).
- The team slide highlights George Ruan as a serial entrepreneur with 3x previous exits and Ryan Hudson with degrees from Cornell and MIT Sloan (Slide 8).
- The deck completely omits a slide for the 'Ask,' leaving the specific funding requirements and valuation unstated within the presentation (Slide 8).
The Lean Data Play: Honey's 8-Slide Strategy
Honey’s pitch deck is a masterclass in brevity and metric-driven storytelling. At just 8 slides, it manages to move from a relatable consumer pain point to a massive data-moat play. The deck was used during a period where the company was scaling rapidly, eventually raising $31.8 million in later-stage funding before its landmark acquisition. The core strength of this presentation lies in its ability to quantify the 'friction' of online shopping and then immediately prove that Honey has the traction to solve it at scale.
The Hook: Problem and Solution (Slides 1-3)
Slide 1: Title The title slide is minimalist, featuring only the Honey logo and contact information for George Ruan. It includes an AngelList URL, suggesting this deck was used for platform-based fundraising or as a follow-up to initial introductions.
Slide 2: Problem Honey identifies a very specific moment in the e-commerce journey: the 'Have a promo code?' box. According to the slide, 163.2 million online shoppers encountered this question in 2014. The problem isn't just the lack of a code; it's the 'cart abandonment' that occurs when users leave a site to search for one. The slide includes a graphic of RetailMeNot (labeled with 'NASDAQ: SALE'), highlighting that while competitors exist, they actually contribute to the problem by pulling users away from the merchant's checkout flow.
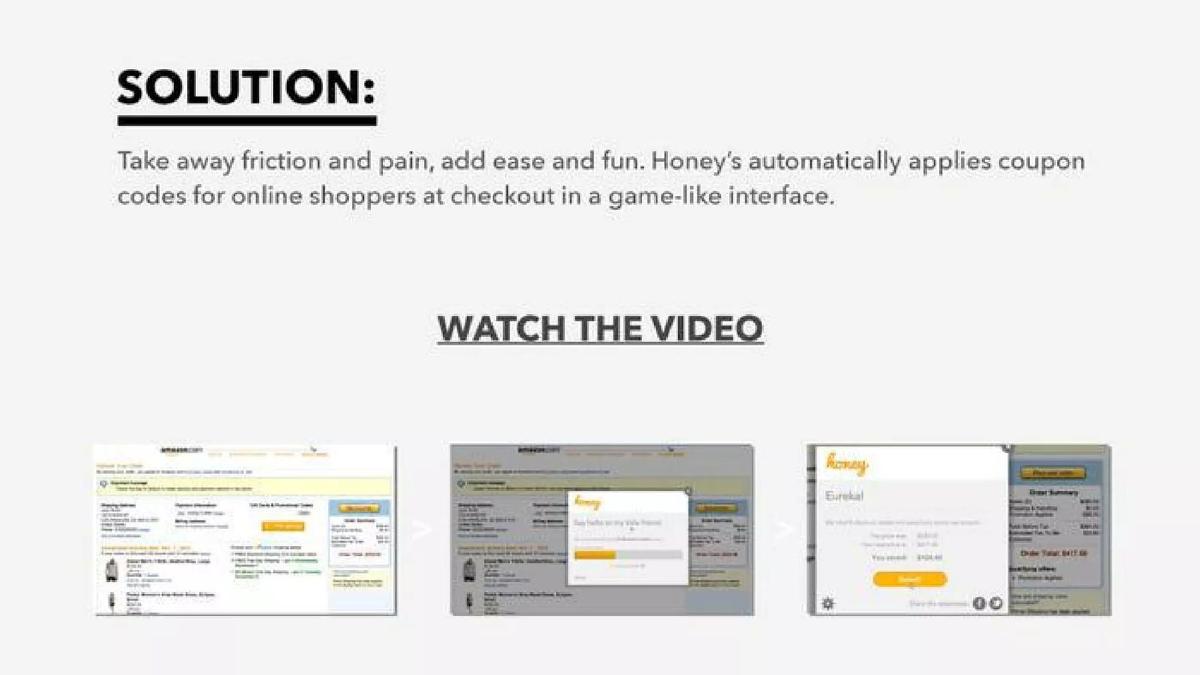
Slide 3: Solution The solution is presented as a way to 'take away friction and pain' by automatically applying codes in a 'game-like interface.' The slide features a call to 'Watch the Video' and three small screenshots showing the extension in action on an Amazon checkout page. The visual progression shows the extension appearing, searching for codes, and finally displaying a 'You saved $164.40' message. This emphasizes the 'set it and forget it' nature of the product.
Quantifying Success: Traction and Benchmarking (Slides 4-5)
Slide 4: Traction (Growth) This is the 'meat' of the deck. Honey displays an orange growth chart that starts in late 2012 and spikes significantly toward January 2015. Overlaid on this chart are three massive numbers: 330,634 Active Shoppers, 79,646,684 Shopping Page Views, and $50,926,000 in GMV. By including page views alongside GMV, Honey demonstrates that their users aren't just installing the app; they are actively using it to browse and spend significant amounts of money.
Slide 5: Traction (Market Comparison) Honey uses a horizontal bar chart to compare itself to Ebates. They state they are 'currently 14% the size of Ebates' and point to Ebates' '$1B Exit' as a valuation North Star. The slide then performs a 'revenue model application,' showing that based on a $73.33 monthly spend per member and a $5.56 ARPU, Honey has a 'monetization potential' of $1.8 million per month. This is a clever way to project revenue without having to show historical revenue if the company was still in a growth-first, monetization-second phase.
The Business and The Moat (Slides 6-7)
Slide 6: Business Model The model is simple: 'Take a commission from transactions Honey helps close.' The slide breaks this down into two steps: keeping shoppers on the merchant site and providing personalized offers based on 'cross-site shopping data.' A screenshot of a Bloomingdale’s site shows a 'Honey Exclusive: 6% Off' pop-up, illustrating how the company moves from a passive coupon finder to an active marketing partner for retailers.
Slide 7: Our Unfair Advantage This slide shifts the narrative from a utility tool to a data powerhouse. Honey claims their data allows them to predict 'what each user is about to buy, when they intend to purchase, and how much they are willing to pay.' A colorful radial chart represents the 'User Behavioral Profile,' which is built from stores visited, products viewed, and purchase history. This slide is intended to justify a high multiple by showing that Honey is actually a predictive analytics company disguised as a browser extension.
The Team (Slide 8)
Slide 8: Team The final slide introduces the leadership. Ryan Hudson (Cofounder) is credited with a Cornell CS degree and an MIT Sloan MBA. George Ruan (Cofounder) is described as a 'serial entrepreneur with 3x previous exits.' The slide also lists a '+10' team with logos from Wharton, Stanford, UCLA, Apple, Microsoft Research, and Duke. This establishes both technical credibility and business pedigree.
What Works in the Honey Pitch Deck
The 'Ebates' Benchmark: By anchoring their potential to a known $1 billion exit, Honey makes the investment opportunity feel tangible and de-risked. · Quantified Friction: Slide 2 doesn't just say 'people like coupons.' It identifies the specific number of shoppers (163.2 million) and the specific business pain (cart abandonment). · Metric Density: Slide 4 provides three different ways to view traction, ensuring that if an investor isn't impressed by user count, they will be impressed by the $50M+ GMV. · The Data Pivot: Slide 7 successfully rebrands the company from a 'coupon app' to a 'predictive data' company, which is a much more venture-scale narrative.
What is Missing from the Honey Pitch Deck
The Ask: There is no slide detailing how much money they are raising, the terms of the round, or the specific milestones they intend to hit with the new capital. · Unit Economics: While they show ARPU potential, they do not show the cost to acquire these users (CAC). For a browser extension, virality and acquisition costs are critical. · Competitive Landscape: Aside from mentioning Ebates and RetailMeNot, the deck ignores other extension-based competitors or the threat of browsers (like Chrome or Safari) building these features natively. · Roadmap: The deck is very focused on the 'now' and the 'potential.' It doesn't outline the next 12-24 months of product development or market expansion.
What a Founder Should Copy
Use 'Lookalike' Modeling: If you are in a crowded space, find a successful incumbent (like Ebates) and show exactly how your metrics track against their historical path to an exit. · Focus on GMV: If your product facilitates commerce, the total dollar amount flowing through your system is often more impressive than your actual revenue in the early stages. · Identify the 'Moment of Pain': Honey’s use of the 'promo code box' image is a perfect example of identifying a specific, visual trigger that everyone recognizes as a point of friction. · Visualizing Data Moats: Use a slide like 'Unfair Advantage' to explain why your data is unique. Don't just say you have data; explain what that data allows you to predict that no one else can.
Frequently asked questions
- What was Honey's primary traction metric in this deck?
- Honey focused on three primary metrics on Slide 4: Active Shoppers (330,634), Shopping Page Views (79,646,684), and Gross Merchandise Volume or GMV ($50,926,000). These figures were dated January 2015. By showing a high GMV relative to the user count, they demonstrated that their audience was highly transactional and engaged in high-intent shopping behavior.
- How did Honey justify its valuation and business model?
- Honey used a comparative analysis on Slide 5, benchmarking itself against Ebates. They noted that Ebates had a $1 billion exit and applied the Ebates revenue model to their own user base. By calculating an ARPU of $5.56 and a monthly spend per member of $73.33, they projected a monetization potential of $1.8 million per month.
- What is the 'Unfair Advantage' Honey claims to have?
- On Slide 7, Honey moves beyond being a simple utility. They claim their unfair advantage is 'unique data' that allows them to predict what a user will buy, when they will buy it, and their price sensitivity. They track user behavioral profiles, stores visited, products viewed, and purchase history to build a comprehensive map of consumer intent.
- Who were the founders and what was their background?
- The team slide (Slide 8) features two co-founders. Ryan Hudson is highlighted for his academic background (Cornell OR/CS and MIT Sloan MBA). George Ruan is presented as a 'serial entrepreneur with 3x previous exits.' The slide also notes a supporting team of 10 with experience from Apple, Microsoft Research, and Recurly.
- What is missing from the Honey pitch deck?
- The deck is notably missing a 'Fundraising Ask' slide, which usually details how much capital is being raised and how it will be spent. It also lacks a formal competition matrix (other than the Ebates comparison), a detailed roadmap, and a deep dive into unit economics like Customer Acquisition Cost (CAC) or Lifetime Value (LTV).