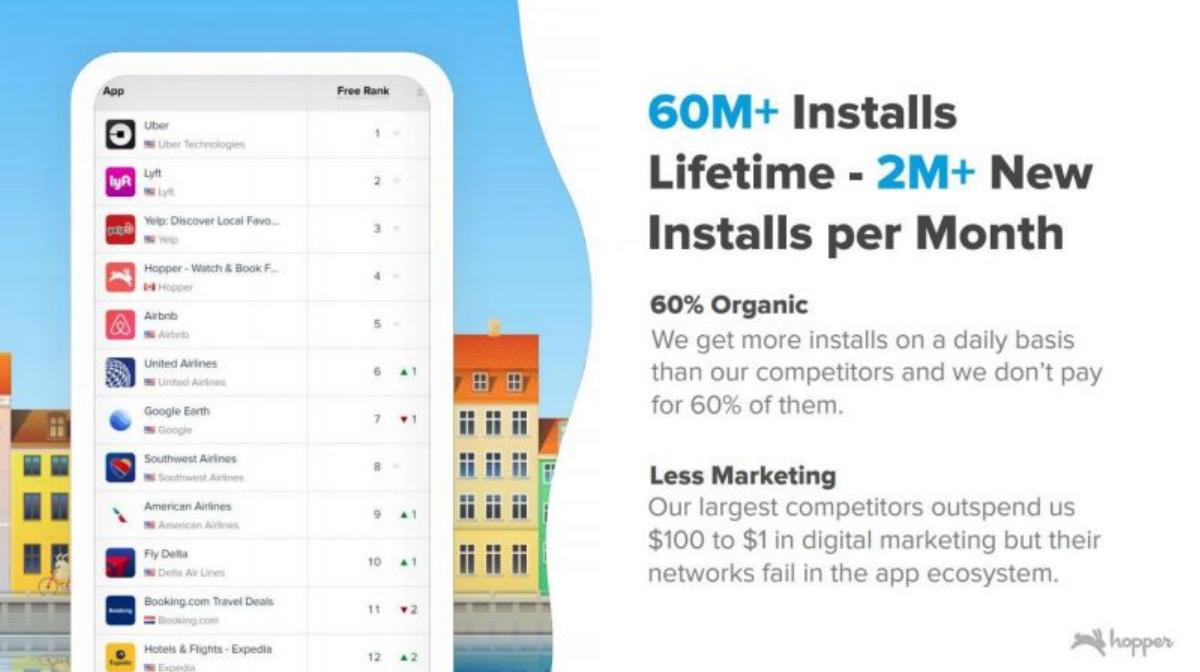
Hopper’s Series G deck is a high-signal presentation that emphasizes market share gains and business model evolution. By 2021, the company had moved beyond flight forecasting into high-margin fintech products like Price Freeze and Disruption Protection. The deck reports over 60 million downloads and $1.5B in annual sales of travel and financial services. A standout feature is their customer acquisition strategy; unlike competitors who rely on Google, Hopper claims 65% of its users come from direct channels and 30% from social. The deck also introduces 'Hopper Cloud,' a B2B play to white-label…
Key takeaways
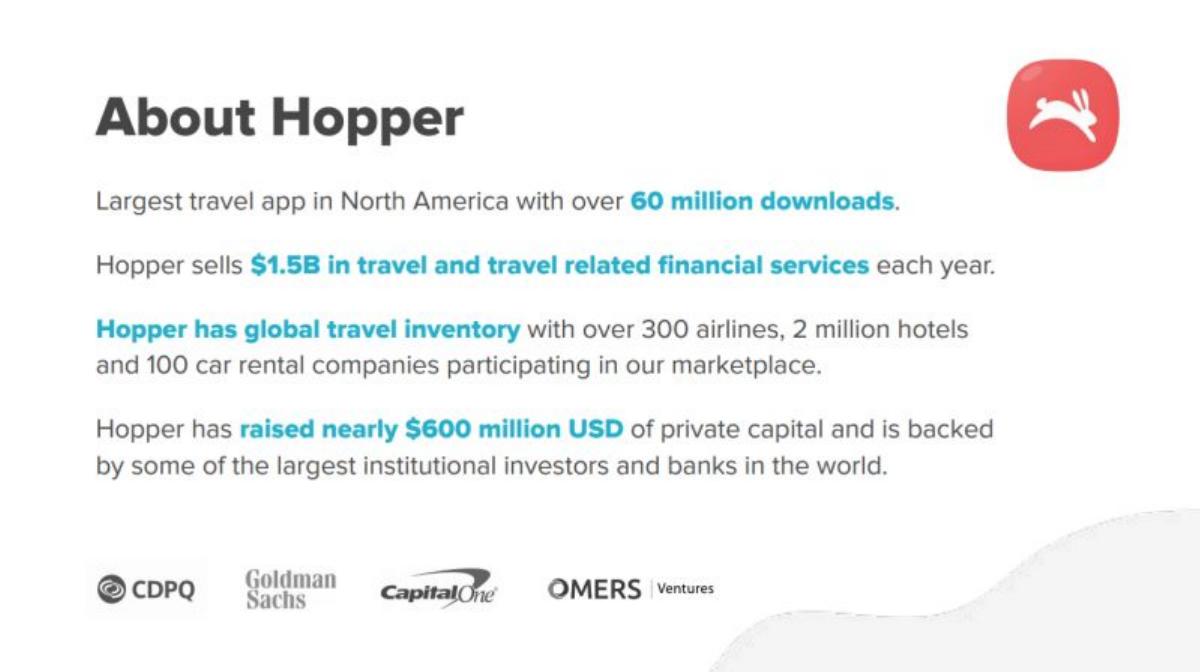
- Hopper identifies as the largest travel app in North America with over 60 million downloads (Slide 2).
- The company sells $1.5B in travel and travel-related financial services annually (Slide 2).
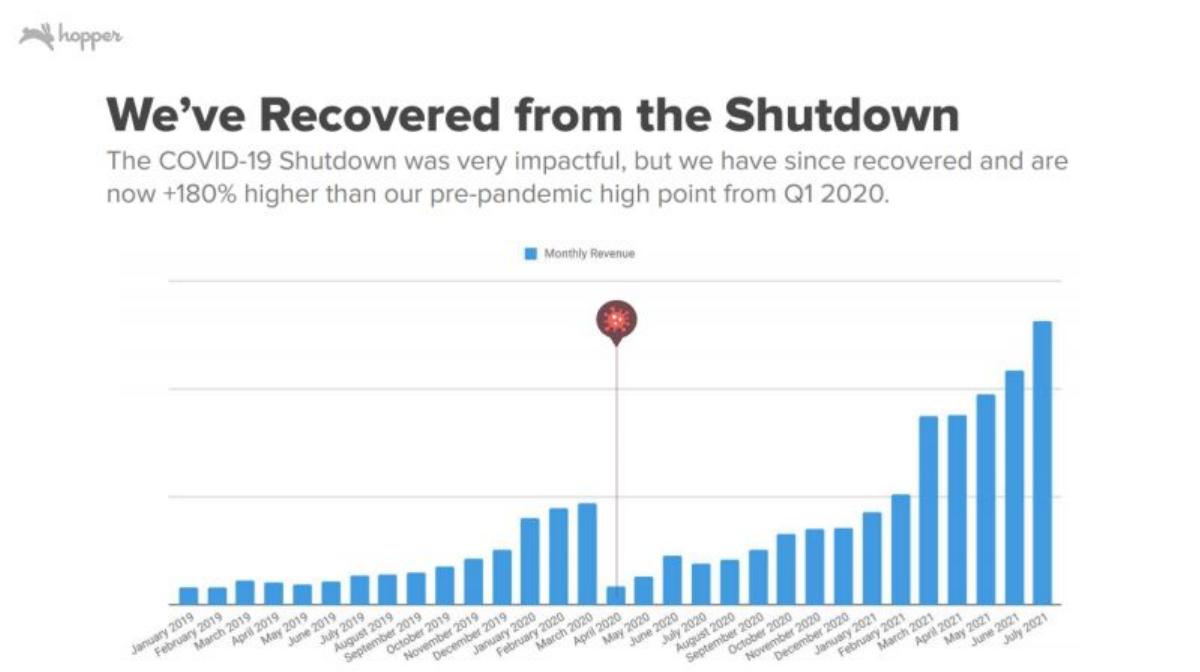
- Hopper's recovery from the pandemic was significantly faster than the OTA competition, reaching 151% of 2019 performance by June 2021 (Slide 4).
- A massive competitive advantage is cited in user acquisition: 65% of users are direct, compared to heavy reliance on paid search by Booking.com and Expedia (Slide 5).
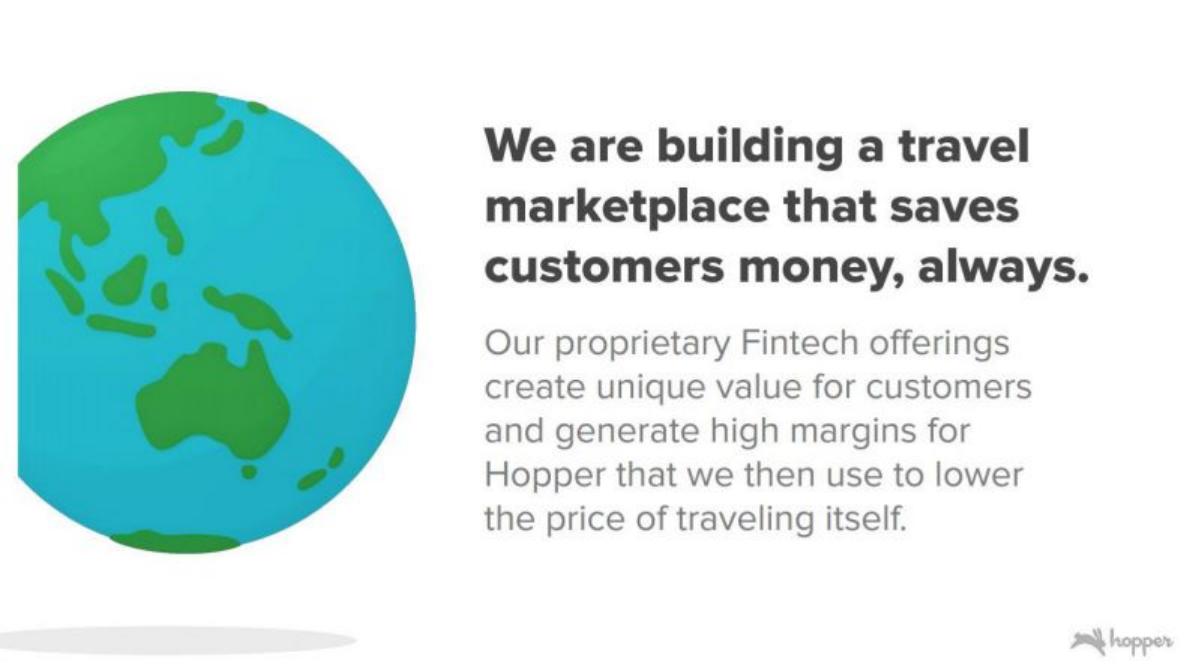
- Fintech products like Price Freeze and Disruption Protection are used to generate high margins that subsidize lower travel prices (Slide 8).
- The 'Price Freeze' product sees users pay an average of $60 to lock in a price for up to 14 days (Slide 9).
- Hopper claims industry-leading booking retention, showing 2019 cohorts significantly outperforming Airbnb's historical retention curves (Slide 12).
- The company is expanding into a B2B model via 'Hopper Cloud,' offering fintech products and travel inventory via API to partners (Slide 13).
Executive Summary: The Fintech Pivot
Hopper’s Series G pitch deck, used to raise $175M in 2021, is a masterclass in shifting a company’s perceived category. While the world knows Hopper as a travel booking app, this deck spends the majority of its time arguing that Hopper is actually a fintech marketplace . By the time this deck was circulated, Hopper had already raised nearly $600 million and established itself as a dominant player in North America. The narrative here isn't about proving people want to book flights on mobile; it is about proving that Hopper has built a superior economic engine that can out-earn and out-retain giants like Expedia and Booking.com.
Slides 1-2: Traction and Market Position
The deck opens with a high-impact summary of the business. Slide 2, titled "About Hopper," establishes immediate credibility with four massive data points: 60 million downloads , $1.5B in annual sales , global inventory including 2 million hotels, and $600 million in prior capital raised . By listing heavy-hitting backers like Goldman Sachs, Capital One, and OMERS Ventures at the bottom of the slide, Hopper signals that they are already a late-stage winner. This slide serves as a 'trust' anchor before they dive into more complex financial engineering concepts.
Slides 3-4: The Value Proposition and Pandemic Recovery
Slide 3 introduces the core thesis: Hopper is a marketplace that uses high-margin fintech products to subsidize lower travel prices. This is a critical distinction from traditional Online Travel Agencies (OTAs) that survive on thin commissions. Slide 4 provides a powerful visual of Hopper’s resilience. A line graph shows Hopper’s air bookings indexed against 2019 performance. While the broader OTA competition (the "OTA Comp Set") was still struggling at roughly 58% of pre-pandemic levels by June 2021, Hopper had surged to 151% . This data point is used to prove that Hopper is not just recovering, but actively gaining market share in a post-COVID world.
Slide 5: The Anti-Google Strategy
Perhaps the most strategically important slide in the deck is Slide 5, "We Don’t Rely on Google to Acquire Users." For years, the bear case for travel startups has been that Google eventually captures all the margin through paid search. Hopper counters this by showing pie charts of user acquisition channels. While Booking.com and Expedia are shown to be heavily dependent on Web Search, Hopper claims 65% Direct and 30% Social traffic. This suggests that Hopper has built a brand that lives on the user's home screen, bypassing the expensive 'Google tax' that plagues the rest of the industry.
Slides 6-7: Diversification and Direct Supply
Slide 6 outlines the transition from a flight-only app to a full-travel suite, including Hotels (launched 2018), Cars (late 2020), and a future "Homes" product aimed at the under-35 demographic. Slide 7 focuses specifically on the Hotel product. Hopper notes they are moving away from just aggregating third-party rates to a direct sales strategy . They mention a 20+ person team hired to bring top hotels under contract, which they estimate will improve category margins by 50% . This move toward direct supply is a classic late-stage play to capture more of the value chain.
Slides 8-11: The Fintech Engine
The heart of the deck is the deep dive into fintech. Slide 8 introduces the four pillars: Price Prediction, Price Freeze, Cancel for Any Reason, and Disruption Protection. Slide 9 provides a specific look at "Price Freeze," noting that users pay an average of $60 for the privilege of locking in a price. This is pure margin for Hopper if the user books or if the price doesn't fluctuate beyond the deposit. Slide 10 covers "Disruption Protection," where Hopper uses predictive data to dynamically price the risk of flight delays and offers instant rebooking. Slide 11 introduces "Carrot Cash," their loyalty currency. The logic here is a growth loop : fintech revenue allows for lower prices, which increases conversion, which leads to more data, which improves the fintech underwriting.
Slide 12: Retention Benchmarking
To prove the 'stickiness' of their platform, Hopper compares their booking retention against Airbnb. Slide 12 shows that their 2019 cohort is performing significantly better than previous years and is trending well above the Airbnb benchmark from its S-1 filing. This slide is intended to combat the idea that travel apps are transactional and low-retention. By showing net negative revenue churn , Hopper is positioning itself more like a SaaS company than a travel agent.
Slides 13-14: The B2B Expansion (Hopper Cloud)
The final section of the deck introduces "Hopper Cloud." Slide 13 explains that Hopper is now selling its fintech stack and travel inventory to other companies via API. This includes white-label portals and modular travel categories. Slide 14 emphasizes that integration is "straightforward," with Hopper taking on all the risk and claims resolution while the partner receives an upfront commission. This B2B pivot is a common strategy for companies looking to justify a higher valuation multiple by becoming a platform rather than just a consumer app.
What Works in This Deck
Category Re-definition: By framing themselves as a fintech company, Hopper justifies a higher valuation than a traditional travel agency. · Defensible Acquisition: The data showing 95% of traffic coming from non-search channels is a massive 'moat' signal for investors. · Clear Unit Economics: The deck explains exactly how they make money (fintech margins) and how they use that money to win (lower travel prices). · Comparative Traction: Using the pandemic recovery to show they are outperforming the market is a very effective way to demonstrate momentum.
What Is Missing
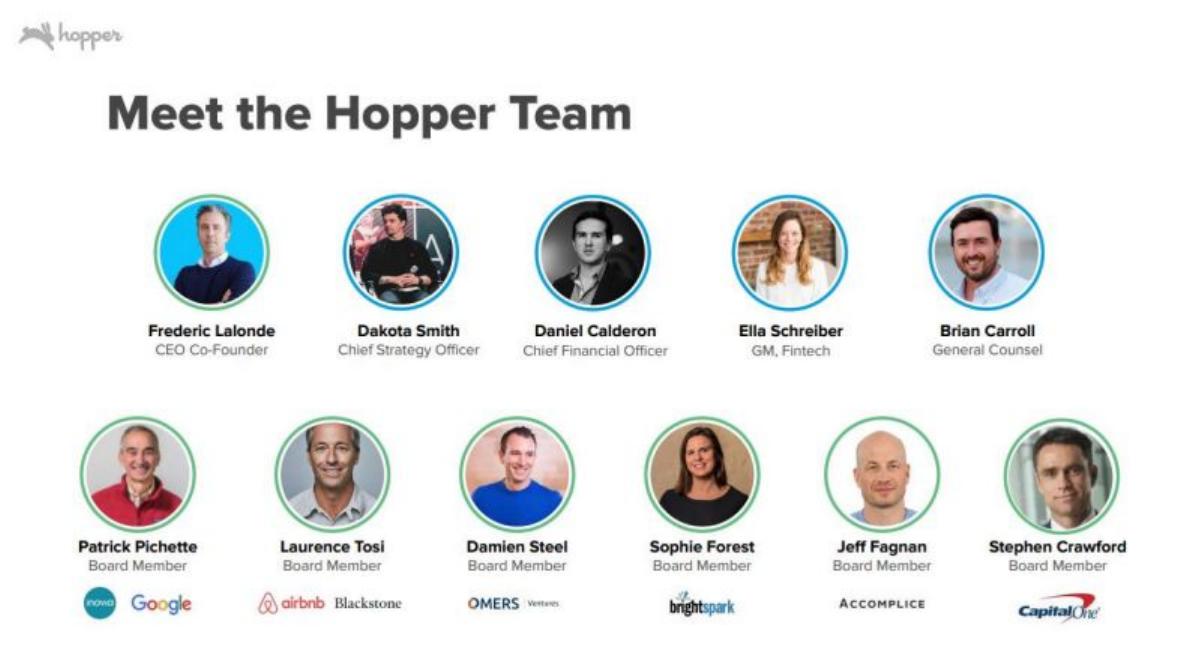
Team Slide: In this 15-slide selection, there is no mention of the founders or the executive leadership team. While likely present in the full 29-slide version, its absence here leaves a gap in the 'who' behind the 'what.' · The Ask: There is no specific slide detailing the $175M raise or how those specific funds will be allocated. · Profitability Timeline: While the deck mentions high margins and $1.5B in sales, it does not explicitly state whether the company is currently EBITDA positive or when it expects to be. · Risk Factors: For a company underwriting travel risk (Price Freeze, Disruption Protection), there is very little detail on the capital reserves or the downside risk if their 95% prediction accuracy fails during a period of extreme volatility.
What a Founder Should Copy
The 'Growth Loop' Visual: If your business has a mechanism where one product subsidizes the growth of another, use the logic found on Slide 11 to explain it. · Benchmarking Against Winners: Don't just show your retention; show it against a gold standard like Airbnb (Slide 12). It gives the numbers context. · Addressing the 'Google Tax': If you are in a crowded consumer space, have a slide that explicitly shows how you acquire users more cheaply than the incumbents. · Modular Product Expansion: Slide 6 is a great example of how to show a roadmap that feels like a natural evolution rather than a distracted pivot.
Frequently asked questions
- How does Hopper differentiate its business model from traditional OTAs?
- Hopper differentiates by positioning itself as a fintech company within the travel sector. According to Slide 3, they use proprietary fintech offerings to generate high margins, which are then used to lower the actual price of travel for the consumer. This creates a 'growth loop' where lower prices lead to higher conversion and retention, further fueled by their high-margin financial products rather than just commissions on bookings.
- What are Hopper's primary fintech products?
- As detailed on Slide 8, Hopper offers four main fintech pillars: Price Prediction (95% accuracy), Price Freeze (locking prices for 1-14 days), Cancel/Change for Any Reason (underwriting non-refundable fares to make them flexible), and Disruption Protection (instant rebooking or reimbursement for delays and missed connections). These products are integrated directly into the booking flow to provide a 'safety net' for travelers.
- How does Hopper acquire users without relying on Google?
- Slide 5 shows a stark contrast between Hopper and incumbents like Expedia or TripAdvisor. While competitors rely heavily on web search and paid meta-search, Hopper claims that 65% of its traffic is Direct and 30% comes from Social channels. Only 5% is attributed to the App Store. This suggests a highly effective organic and social-first brand strategy that reduces their dependency on expensive search engine marketing.
- What is the significance of the 'Hopper Cloud' offering?
- Hopper Cloud, introduced on Slide 13, represents the company's expansion into B2B. It allows other travel companies to integrate Hopper’s fintech products (like Price Freeze) and their global travel inventory via API. This transforms Hopper from a consumer app into a platform infrastructure provider, diversifying their revenue streams and allowing them to monetize their technology stack through third-party travel portals.
- What metrics does Hopper use to prove customer loyalty?
- Hopper uses 'Booking Retention' as a primary loyalty metric. Slide 12 compares Hopper’s 2016-2019 cohorts against Airbnb’s S-1 data. The chart shows that Hopper’s 2019 cohort achieved approximately 160% retention against Year 1 by their second year, which is significantly higher than the benchmarked Airbnb data and their own previous year cohorts, indicating improving product-market fit and cross-selling success.