Honeycomb utilized this 18-slide deck to secure a $50M Series D round in 2023, positioning itself as the 'observability category king.' The narrative focuses heavily on the shift from simple application monitoring to complex, cloud-native observability, citing a 177% Net Revenue Retention (NRR) at Year 1 and 255% at Year 2. A significant portion of the deck is dedicated to market education and social proof, including its debut as a Leader in the 2022 Gartner Magic Quadrant. The deck outlines a dual-track Go-To-Market strategy where individual developer 'groundswell' feeds into high-touch ente…
Key takeaways
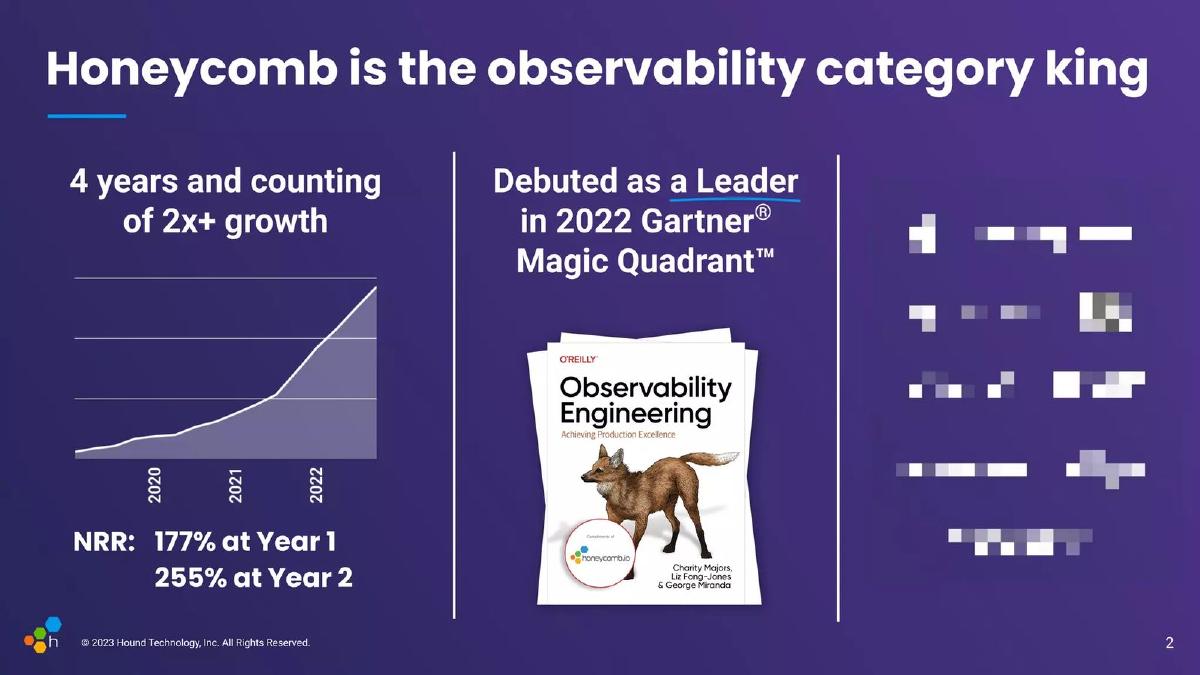
- The company reports exceptional expansion metrics, with NRR reaching 255% by the second year of a customer's tenure (Slide 2).
- Honeycomb positions itself against 'traditional' tools by using a four-quadrant map that defines observability as fast and flexible, unlike slow logging or rigid monitoring (Slide 9).
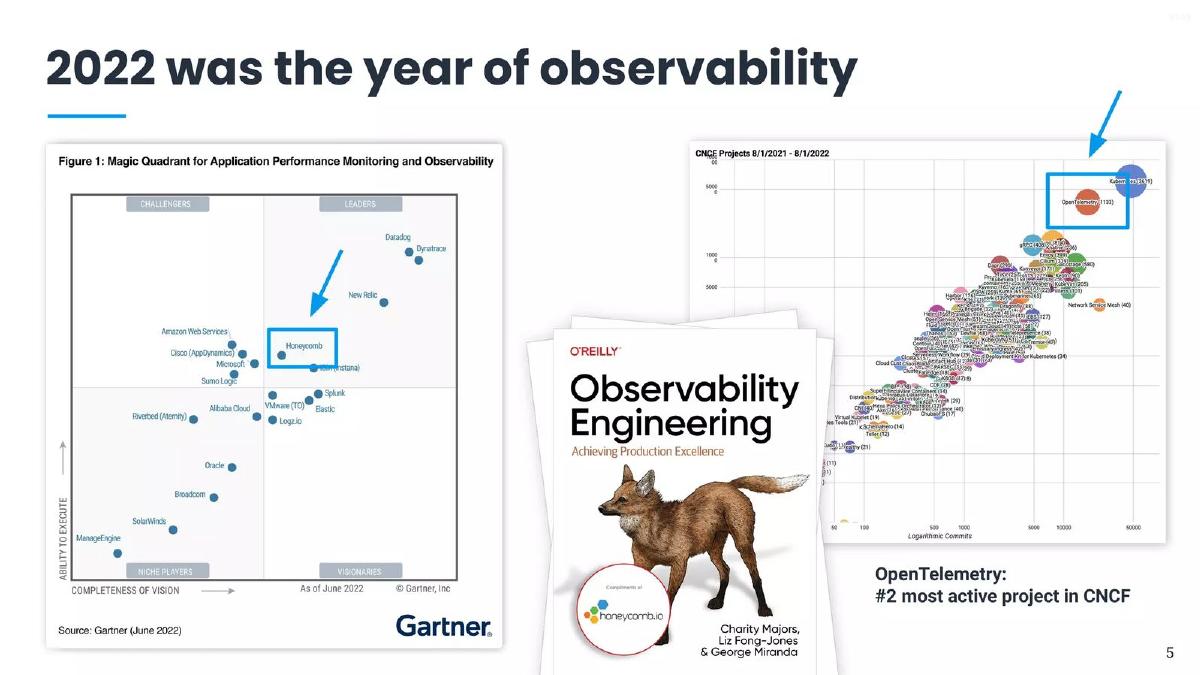
- The deck relies heavily on third-party authority, featuring the O'Reilly 'Observability Engineering' book and Gartner Magic Quadrant placement (Slide 5).
- A detailed case study of Vanguard demonstrates the platform's ability to displace incumbents like Splunk and AppDynamics while lowering total cost of ownership (Slide 10).
- The Go-To-Market slide reveals that 53% of sales-led ARR originates from a 'Free/Pro' developer groundswell (Slide 13).
- Specific vertical success is highlighted with the gaming sector showing 161% ARR growth and 116% logo growth in 2022 (Slide 14).
- The team slide emphasizes deep infrastructure roots, with founders and executives hailing from Parse, Facebook, Google, and Slack (Slide 16).
- The funding ask is clearly defined as a $50M+ round to reach IPO readiness and extend cash runway into 2026 (Slide 17).
Introduction: The Series D Narrative
The Honeycomb Series D deck, dated 2023, is a masterclass in growth-stage storytelling. At this stage, a company is no longer selling a dream; it is selling a proven machine. The deck focuses on category dominance, massive net revenue retention, and a clear path to an IPO. The visual style is clean, corporate, and data-heavy, reflecting a company that understands its enterprise audience.
Slides 1-2: The Hook and The Proof
Slide 1 is a standard title slide, but the subtitle 'Redefining software engineering through observability' immediately sets the stage for a category-creation play. Slide 2 is the 'money slide.' It claims the title of 'observability category king' and backs it up with three pillars: four years of 2x+ growth, a debut as a Leader in the Gartner Magic Quadrant, and staggering NRR figures of 177% at Year 1 and 255% at Year 2. These NRR numbers are top-decile for SaaS and indicate a product that becomes deeply embedded in the customer's workflow.
Slides 3-5: Market Dynamics and Timing
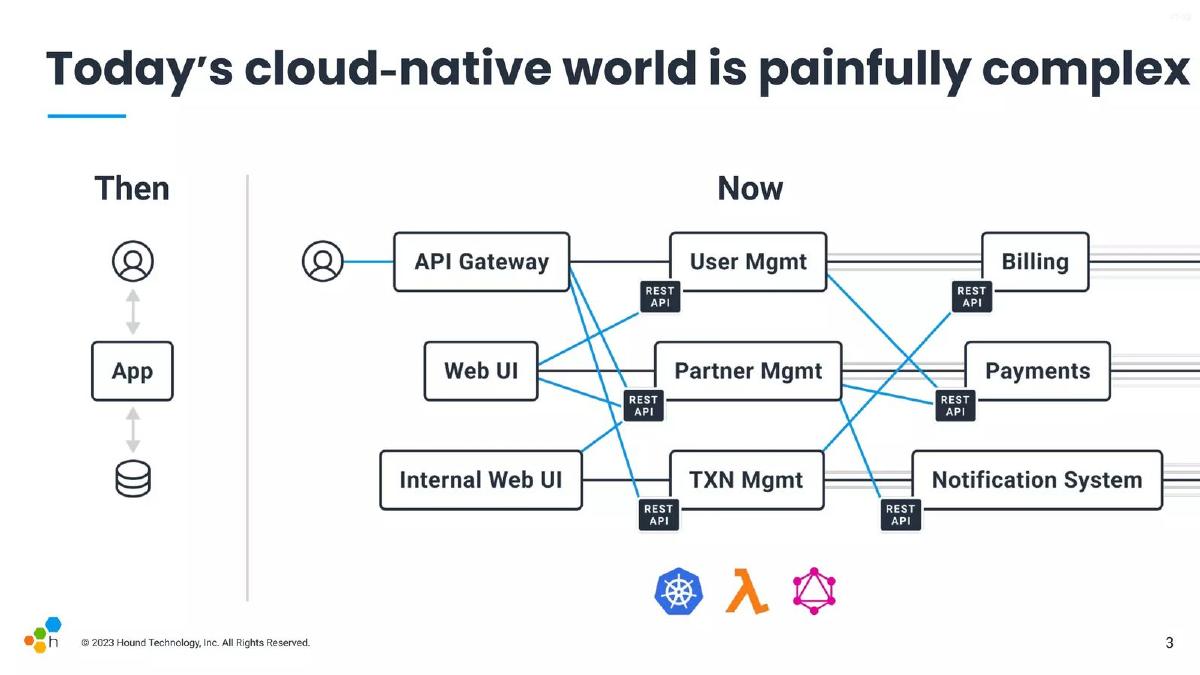
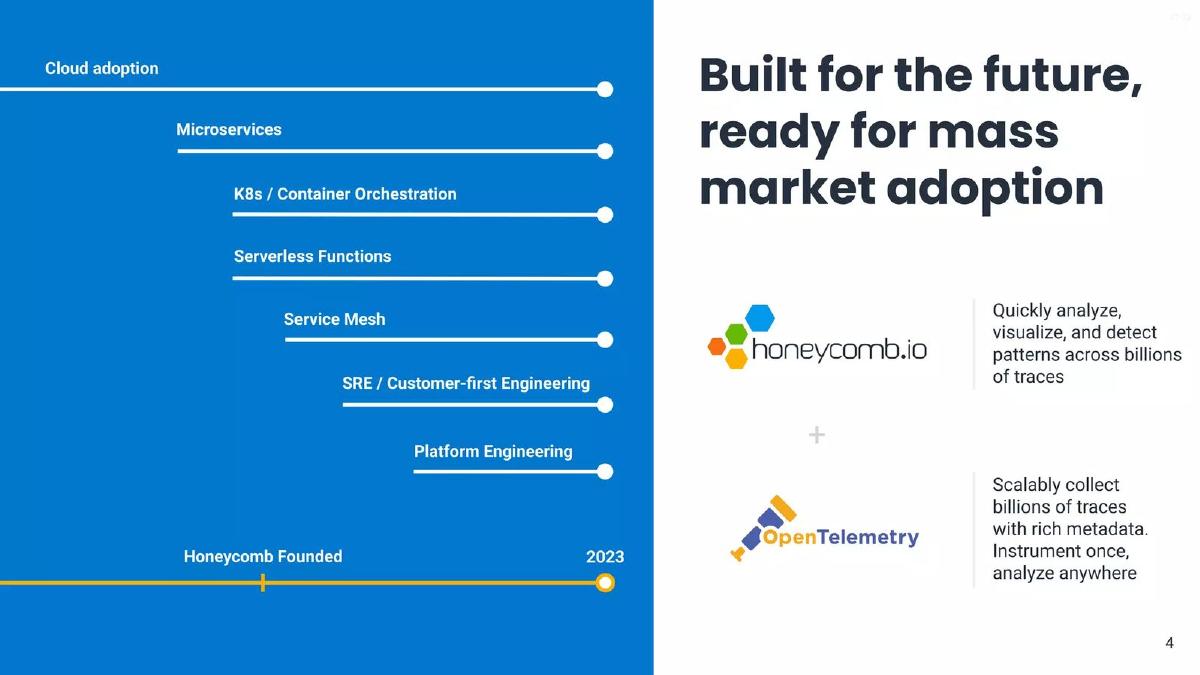
Slide 3 uses a 'Then vs. Now' visual to illustrate the transition from monolithic apps to complex cloud-native environments involving Kubernetes, Lambda, and GraphQL. This justifies why old tools no longer work. Slide 4 aligns Honeycomb's growth with industry trends like Microservices and Platform Engineering, while introducing their partnership with OpenTelemetry. Slide 5 doubles down on social proof, showing the Gartner Magic Quadrant and the O'Reilly book 'Observability Engineering,' co-authored by Honeycomb founders. This establishes them as the intellectual leaders of the space.
Slides 6-9: Defining the Category
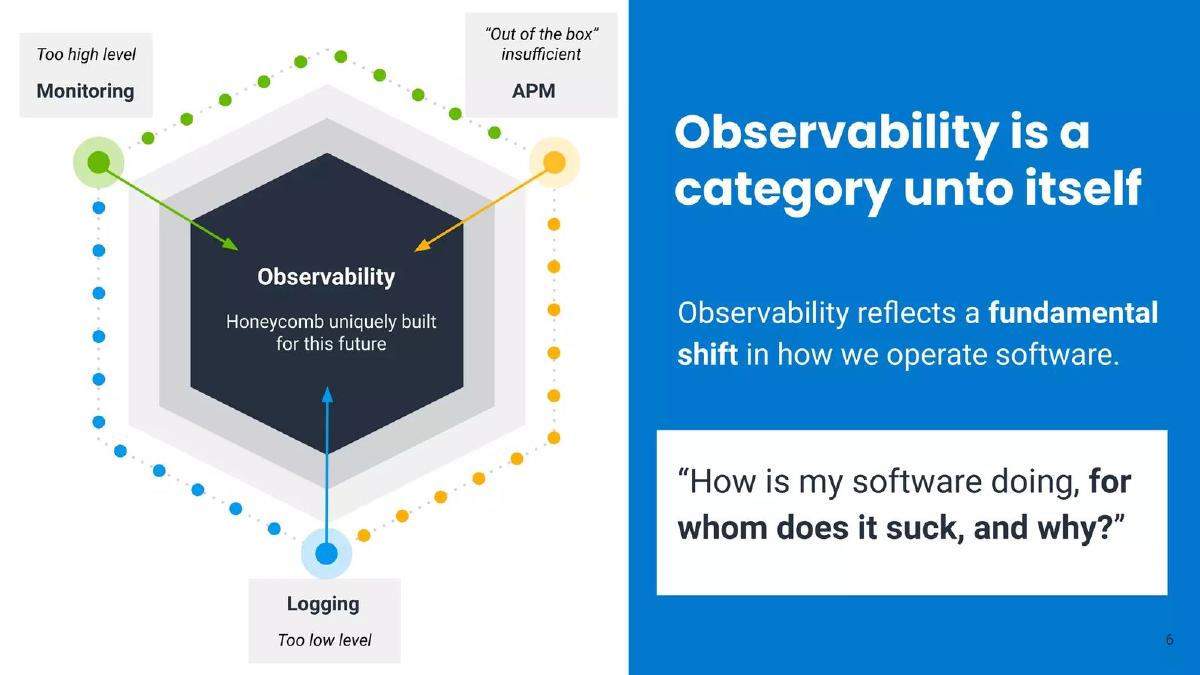
Slide 6 attempts to define 'Observability' as a distinct category, separate from monitoring, logging, and APM. It uses a hexagon graphic to show that while other tools are 'too high level' or 'too low level,' Honeycomb is the only one built for the future. Slides 7 and 8 use a logo cloud (partially blurred in this version) to show that demand is 'universal,' spanning Fintech, Gaming, and Healthcare. Slide 9 is a classic competitive matrix, positioning Honeycomb in the 'Fast and Flexible' quadrant, contrasting it with 'Slow' logging and 'Rigid' monitoring.
Slides 10-11: Case Studies and The 'Redacted' Customer
Slide 10 provides a concrete enterprise case study with Vanguard. It lists specific results: lowered MTTR, reduced reputational impact, and the displacement of Splunk and AppDynamics. This is crucial for Series D investors who want to see that the company can win against billion-dollar incumbents. Slide 11 follows a single (redacted) customer's journey from 2016 to 2023, showing how they moved from high-cardinality data needs to a full 'culture of observability,' eventually moving off Datadog APM. A chart of GitHub issues mentioning Honeycomb provides a unique proxy for internal developer adoption.
Slides 12-14: Go-To-Market Strategy
Slide 12 is a transition slide for 'Company and GTM.' Slide 13 explains the 'Individuals try, teams buy' motion. It reveals that 53% of sales-led ARR comes from the developer groundswell (Free/Pro tiers), while 47% is pure sales-led enterprise acquisition. This 'land and expand' model is the engine behind their high NRR. Slide 14 highlights a specific 'win' in the gaming sector, showing 161% ARR growth. Highlighting a specific vertical success proves the GTM strategy is repeatable and scalable.
Slides 15-18: The Team and The Ask
Slide 15 is a transition to the future. Slide 16 showcases the team, featuring CEO Christine Yen and CTO Charity Majors. The logos under the team members (Parse, Facebook, Google, Slack, VMware) signal deep technical expertise and experience at scale. Slide 17 contains the 'Ask.' The company has raised $97M to date and is seeking a '$50M+ round.' The goals are explicit: IPO readiness, cash runway into 2026, and specific ARR targets (redacted). Slide 18 closes with the tagline 'We make the impossible, possible.'
What Works Well in This Deck
Third-Party Validation: By featuring the Gartner Magic Quadrant and an O'Reilly textbook, Honeycomb lets industry authorities do the bragging for them. · NRR Focus: The 255% Year 2 NRR is the strongest metric in the deck. It proves that once a customer starts using Honeycomb, they don't just stay; they spend significantly more every year. · Displacement Narrative: Explicitly naming Splunk, AppDynamics, and Datadog as tools they have replaced (Slides 10 and 11) proves they are a 'must-have' rather than a 'nice-to-have' add-on. · GTM Clarity: Slide 13 clearly explains how they bridge the gap between bottom-up developer adoption and top-down enterprise sales.
What Is Missing
Unit Economics: While NRR is highlighted, there is no mention of Customer Acquisition Cost (CAC), LTV/CAC ratios, or gross margins. At Series D, investors typically want to see the efficiency of the growth engine. · Burn Rate and Path to Profitability: Slide 17 mentions the 'option to pivot to cash-flow neutral,' but does not provide current burn rates or a specific timeline for reaching breakeven. · Product Screenshots: For a tool that claims to be 'redefining software engineering,' there are surprisingly few visuals of the actual interface or how it 'visualizes billions of traces.' · TAM/SAM/SOM: The deck assumes the investor already understands that the observability market is massive. It lacks a formal market sizing slide.
What a Founder Should Copy
The 'Then vs. Now' Slide: Slide 3 is an excellent way to show why a market is ripe for disruption due to changing underlying technology. · Vertical Deep Dives: Slide 14 shows how to use a specific sector (Gaming) to prove a broader GTM point. It makes the 'universal demand' claim feel more grounded. · The Funding Roadmap: Slide 17 is a model for how to present a late-stage ask. It ties the money to specific business outcomes (IPO readiness, runway dates) rather than just 'hiring and marketing.' · Proxy Traction Metrics: Using GitHub issue mentions (Slide 11) is a clever way to show 'developer love' in a way that feels more authentic than a standard marketing survey.
Frequently asked questions
- What is Honeycomb's core value proposition according to the deck?
- Honeycomb defines its value through the lens of 'observability,' which it distinguishes from traditional monitoring and logging. According to Slide 6, it answers the fundamental question: 'How is my software doing, for whom does it suck, and why?' It is built to handle the high-cardinality data and complex queries inherent in modern cloud-native, microservices-based architectures that traditional APM tools struggle to manage.
- How does Honeycomb demonstrate market traction?
- Traction is shown through both quantitative and qualitative metrics. Slide 2 highlights four years of 2x+ growth and NRR that scales from 177% in Year 1 to 255% in Year 2. Slide 7 and 8 show a 'universal' demand across sectors like Fintech, Ecommerce, and IoT, while Slide 14 specifically calls out 161% year-over-year ARR growth in the gaming vertical for 2022.
- What is the significance of OpenTelemetry in this deck?
- OpenTelemetry is presented as a critical tailwind for the company. Slide 5 notes it is the #2 most active project in the CNCF (Cloud Native Computing Foundation). Honeycomb positions itself as a leader in this vendor-neutral movement, allowing customers to 'instrument once, analyze anywhere,' which reduces the friction of adopting Honeycomb's specialized analysis platform (Slide 4).
- Who are Honeycomb's primary competitors mentioned in the slides?
- The deck explicitly names incumbents that it has displaced in enterprise environments. Slide 10 mentions displacing Splunk and AppDynamics at Vanguard. Slide 11 references a customer moving off Datadog APM. The Gartner Magic Quadrant on Slide 5 also visually positions Honeycomb against leaders like Datadog, Dynatrace, and New Relic.
- What is the stated goal for the $50M Series D round?
- As stated on Slide 17, the primary objective is 'IPO readiness.' This includes securing a cash runway into 2026, reaching a specific (though redacted) ARR target, and expanding geographically and through new alliances. The round is intended to give the company the option to either pivot to cash-flow neutral operations or continue investing for accelerated growth.