HoneyBook’s deck focuses on the massive shift toward independent, service-based work, highlighting that 59 million Americans freelanced in 2020. The narrative centers on the 'fragmentation' of business tools, positioning HoneyBook as the unified operating system that replaces a dozen disparate apps. Financially, the deck is exceptionally strong, showcasing a 146% net dollar retention rate—outperforming public peers like Shopify and Bill.com. The company successfully argued that their expansion from 'Events' into 'Professional Services' tripled their TAM to 13.8 million businesses. With a 224%…
Key takeaways
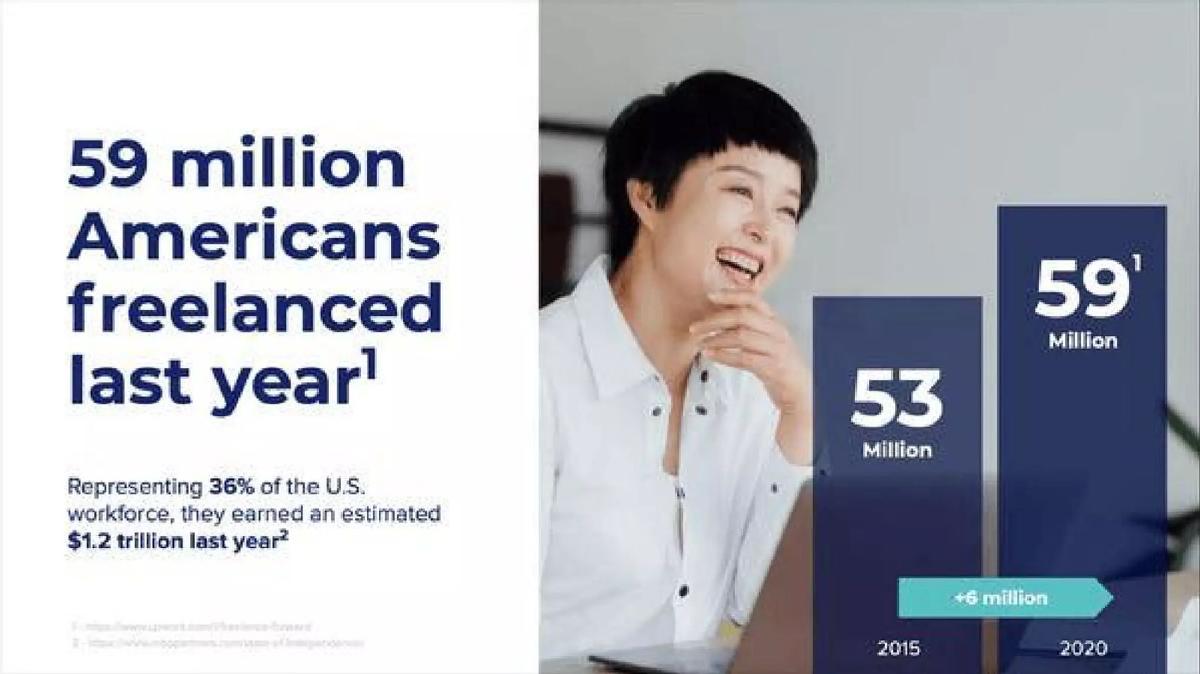
- The deck identifies a massive market of 59 million freelancers representing 36% of the U.S. workforce (Slide 3).
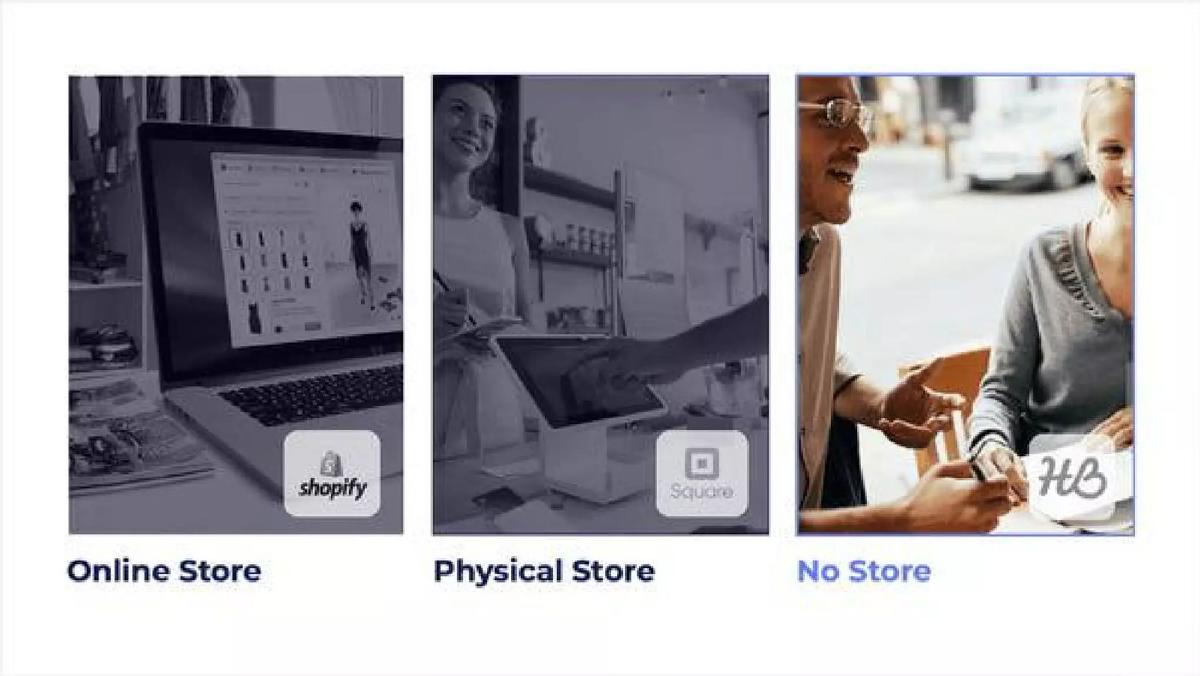
- HoneyBook positions itself as the 'No Store' solution, contrasting with Shopify (Online) and Square (Physical) (Slide 5).
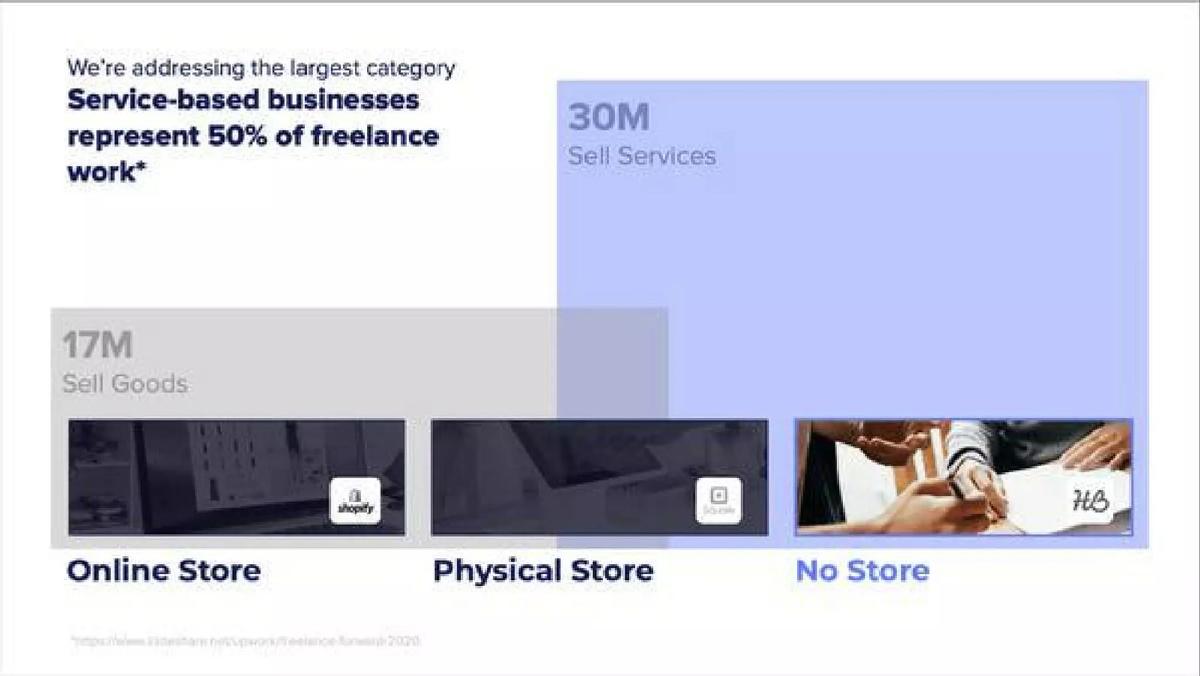
- Service-based businesses represent 50% of all freelance work, totaling 30 million individuals (Slide 6).
- The platform consolidates fragmented point solutions like Wix, Calendly, DocuSign, and QuickBooks into one workflow (Slide 9).
- HoneyBook reports a best-in-class Net Dollar Retention Rate of 146%, significantly higher than the 117% median for public companies (Slide 11).
- The business model is a hybrid of $40/month subscriptions and a 3% transaction card fee (Slide 11).
- Vertical expansion beyond 'creatives' increased the company's addressable market by 3x, reaching 13.8 million potential users in 2021 (Slide 15).
- The 'Creatives & Professionals' segment showed a 224% CAGR between 2017 and 2021 (Slide 17).
The Vertical SaaS Playbook for the Freelance Economy
HoneyBook’s pitch deck is a clinical example of how to present a vertical SaaS company that is successfully moving upmarket and expanding its horizontal reach. Founded in 2013, the company has raised nearly $500 million, and this deck illustrates the 'inflection point' that justified those later-stage rounds. The narrative is built on three pillars: the macro shift toward independent work, the inefficiency of fragmented toolsets, and the superior unit economics of a hybrid subscription-transaction model.
The Macro Opportunity: The Rise of the Independent Worker
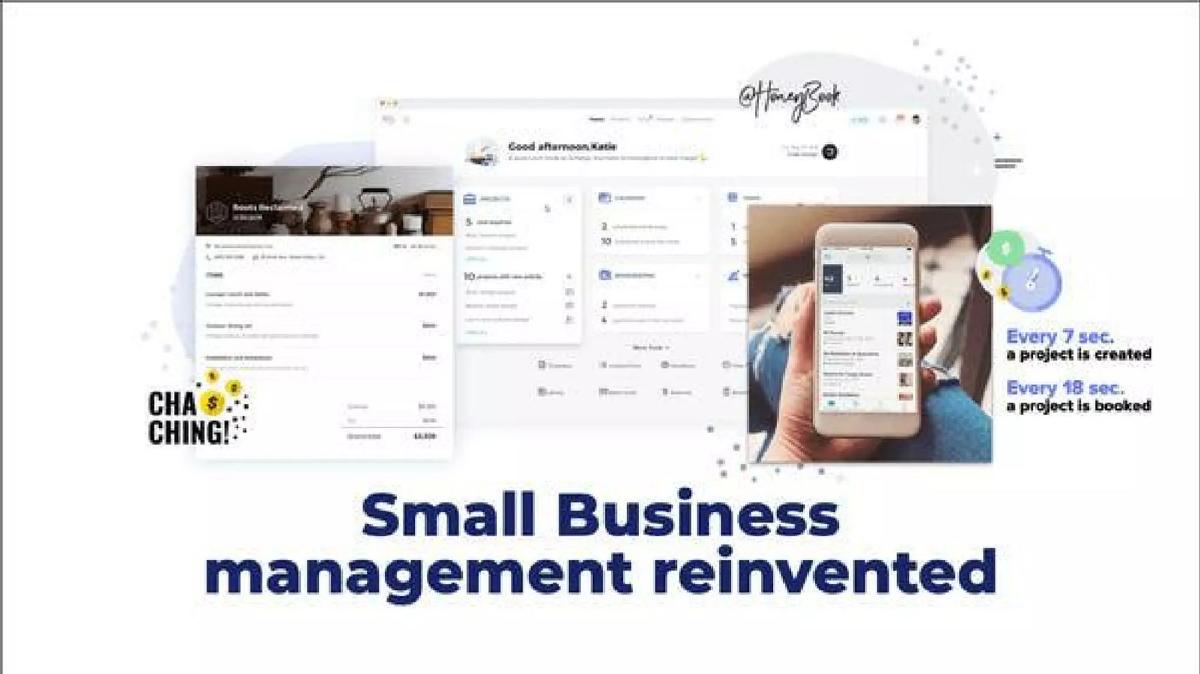
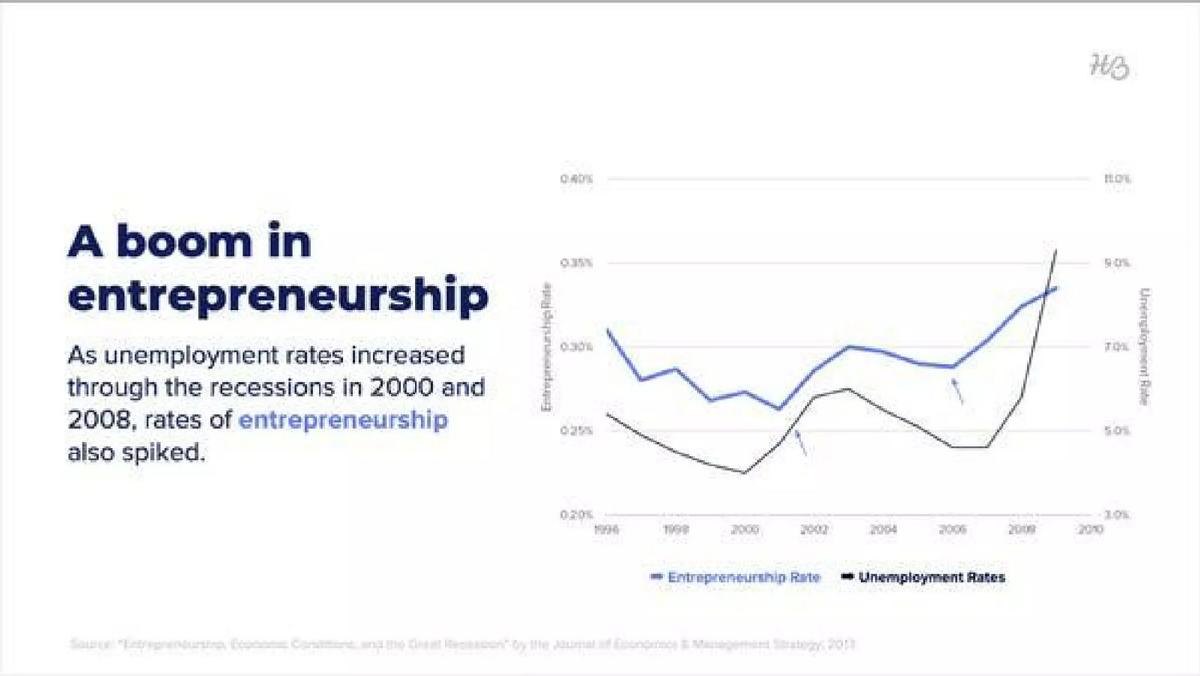
The deck opens with a clean title slide and immediately moves into high-level traction on Slide 2, noting that 'Every 7 sec. a project is created' and 'Every 18 sec. a project is booked.' This establishes immediate scale before diving into the 'Why Now' on Slide 3. HoneyBook cites that 59 million Americans (36% of the workforce) earned $1.2 trillion freelancing in the previous year. Slide 4 connects this to historical trends, showing that entrepreneurship rates spike during recessions (citing 2000 and 2008), suggesting that the post-2020 era is a prime environment for their growth.
The Strategic Positioning: The 'No Store' Category
One of the most effective parts of this deck is the competitive positioning on Slide 5. HoneyBook identifies three types of commerce: Online Store (dominated by Shopify), Physical Store (dominated by Square), and 'No Store.' HoneyBook claims the 'No Store' category. Slide 6 quantifies this, showing that while 17 million freelancers sell goods, 30 million sell services. Slide 7 lists these personas—from photographers and web designers to doulas and dog trainers—emphasizing that 'Their inventory is time.' Slide 8 highlights the pain point: these professionals spend most of their time on management rather than their actual craft.
The Solution: Eliminating Fragmentation
Slide 9 visualizes the 'fragmented process' of using Wix for lead capture, Calendly for meetings, DocuSign for contracts, and QuickBooks for accounting. This is the classic 'unbundled' vs. 'bundled' SaaS argument. Slide 10 provides a 'Before and After' comparison, claiming that HoneyBook allows users to flip their time allocation from 20% service delivery to 80% service delivery by automating the administrative stack.
Financial Excellence: Best-in-Class Metrics
This section is the 'meat' of the deck for investors. Slide 11 is a standout, showing a 146% Net Dollar Retention Rate. By comparing themselves to Shopify (100%) and Bill.com (121%), HoneyBook positions itself as a top-tier SaaS performer. The revenue model is clearly stated: $40/month plus a 3% transaction fee. Slide 12 shows a clear inflection point in July 2020 where Monthly Active Member growth accelerated from a 58% CAGR to a 109% CAGR. Slide 13 and 14 reinforce this, showing GAAP revenue growth and 2021 performance tracking significantly ahead of their original operating plan.
Market Expansion: Tripling the TAM
Investors often worry about vertical SaaS companies hitting a ceiling. HoneyBook addresses this on Slide 15, showing how they expanded from 'Events' (1.2M addressable market in 2017) to 'Creatives' and finally 'Professional Services,' tripling their addressable market to 13.8M businesses. Slide 16 and 17 prove that this isn't just theoretical; the 'Creatives & Professionals' segment is growing at a 224% CAGR, now making up roughly 50% of their total member base.
Operational Efficiency and Social Proof
The deck concludes with efficiency metrics. Slide 18 shows a steadily decreasing CAC (Customer Acquisition Cost) over four years, and Slide 19 shows a similar downward trend for support costs per member. This suggests that the business becomes more profitable as it scales. Slide 20 provides a qualitative 'NPS of 75' with a customer testimonial, and Slide 21 ends with a team photo and a mission statement. Notably, there is no individual team breakdown or specific funding request in this version of the deck.
What Works in the HoneyBook Deck
The 'No Store' Framework: Categorizing the market into Online, Physical, and 'No Store' is a brilliant way to differentiate from giants like Shopify and Square while still being in their league. · Comparative Benchmarking: Directly comparing their 146% Net Dollar Retention to public companies like Bill.com and Shopify provides immediate context for how 'good' their numbers actually are. · The Inflection Narrative: Using Slide 12 to show a specific date (July 2020) where growth accelerated creates a sense of urgency and momentum. · TAM Expansion Logic: Clearly showing the step-by-step expansion from Events to Professional Services (Slide 15) de-risks the 'niche' concern often associated with vertical SaaS.
What is Missing from the HoneyBook Deck
Detailed Team Bios: While there is a team photo on Slide 21, the deck lacks a slide detailing the founders' backgrounds, previous exits, or the expertise of the executive leadership team. · The 'Ask': There is no slide stating how much money is being raised, the valuation sought, or the specific use of funds. This is common in later-stage decks that are leaked or used for general investor updates, but it is a critical omission for a standard pitch. · Unit Economics (LTV/CAC): While CAC and support costs are shown as trending down (Slides 18-19), the deck does not explicitly state the Lifetime Value (LTV) or the CAC payback period in months. · Competitive Matrix: While they mention point solutions (Slide 9), they do not provide a direct feature-by-feature comparison against other 'all-in-one' competitors in the freelance management space.
What a Founder Should Copy
Visualizing the Workflow: Slide 9 is a perfect example of how to show the 'messy' reality of a customer's current life. Use logos of well-known tools to show what you are replacing. · The 'Pay-as-you-grow' Slide: If you have a hybrid revenue model (SaaS + Fintech), copy the layout of Slide 11. It clearly explains how the two revenue streams work together to drive retention. · CAGR by Segment: If you are expanding into new markets, don't just show total growth. Show the CAGR of the new segment specifically (as seen on Slide 17) to prove product-market fit in that new vertical. · Trend Lines Over Raw Numbers: Notice that Slides 18 and 19 do not have Y-axis dollar amounts. They show the trend of decreasing costs. If you aren't ready to share exact dollar amounts, showing the direction of the trend is still highly effective.
Frequently asked questions
- What is HoneyBook's core value proposition?
- HoneyBook positions itself as the end-to-end operating system for service-based freelancers who do not have a physical or online storefront. According to Slide 10, the platform allows business owners to shift from spending only 20% of their time on actual service delivery to 80%, by automating lead management, proposals, scheduling, contracts, invoicing, and payments.
- How does HoneyBook's retention compare to other SaaS giants?
- The deck makes a direct comparison on Slide 11. HoneyBook claims a 146% Net Dollar Retention Rate. This is contrasted against Shopify at 100%, Bill.com at 121%, and a median for public enterprise companies of 117%. This indicates that existing HoneyBook users spend significantly more with the platform over time.
- What is the size of the market HoneyBook is targeting?
- Slide 3 states that 59 million Americans freelanced last year, earning an estimated $1.2 trillion. Slide 6 narrows this down to the 30 million individuals who specifically 'Sell Services' rather than goods. By 2021, HoneyBook estimated its specific addressable market at 13.8 million businesses (Slide 15).
- What does the revenue model look like?
- As shown on Slide 11, HoneyBook uses a 'pay-as-you-grow' model. This includes a flat subscription fee of $40 per month and a transactional component consisting of a 3% card fee on payments processed through the platform. This dual-stream approach is credited for their high dollar retention.
- Is the company's growth accelerating or slowing down?
- The data suggests significant acceleration. Slide 12 shows that Monthly Active Members (MAM) grew at a 58% CAGR from 2017 to mid-2020, but jumped to a 109% CAGR after July 2020. Furthermore, Slide 14 indicates that 2021 performance was tracking 26% ahead of their internal operating plan by March.