Fly nimbus is a travel tech startup focused on 'surprise traveling,' a model where users book a fixed-price trip ($250+) and only discover their destination two days before departure. The deck positions the company as a first-mover in North America, citing a validated European market with over 50 competitors and 90 million Euros in revenue since 2015. With a reported Customer Acquisition Cost (CAC) of $19.07 and an average profit margin of 21%, the company demonstrates early unit economic viability. However, the deck lacks a formal 'Ask' slide and details on the core founding team, instead fo…
Key takeaways
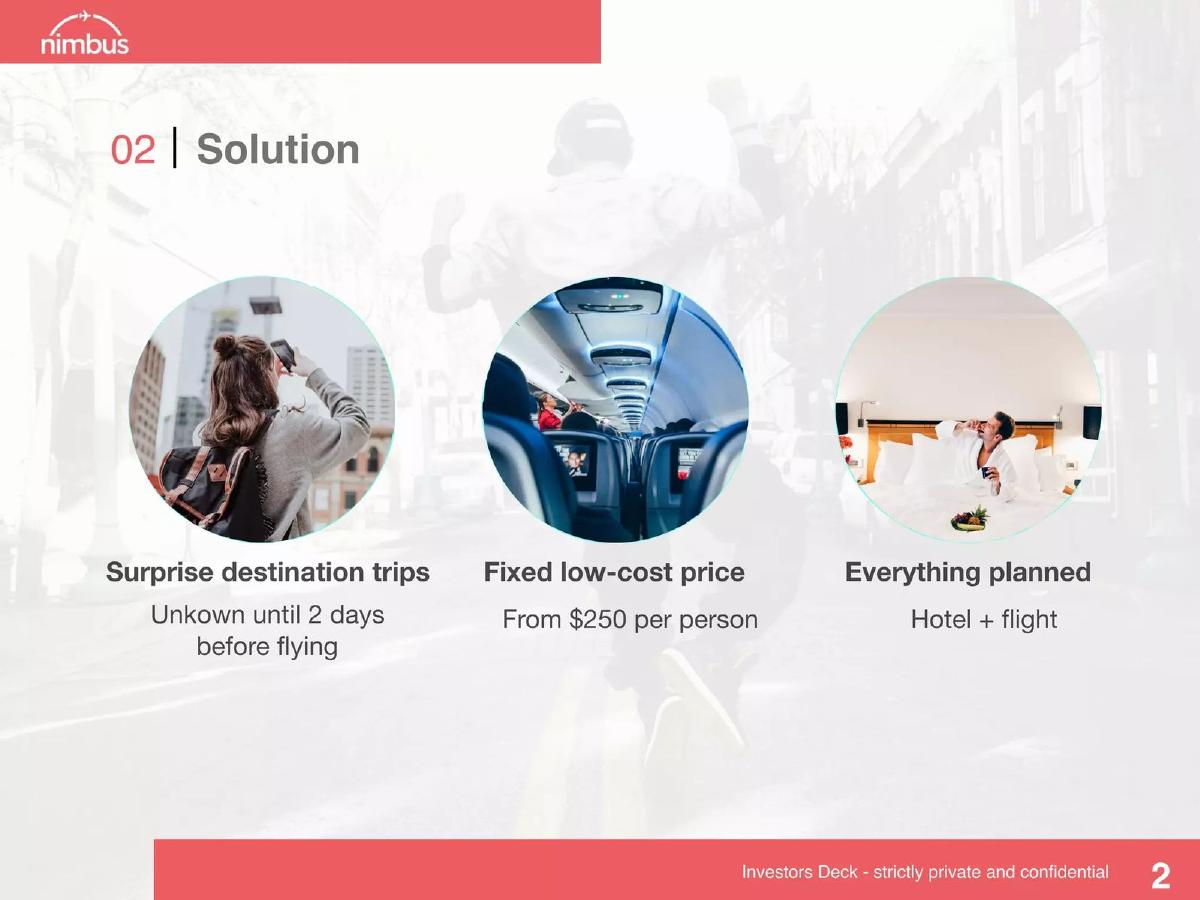
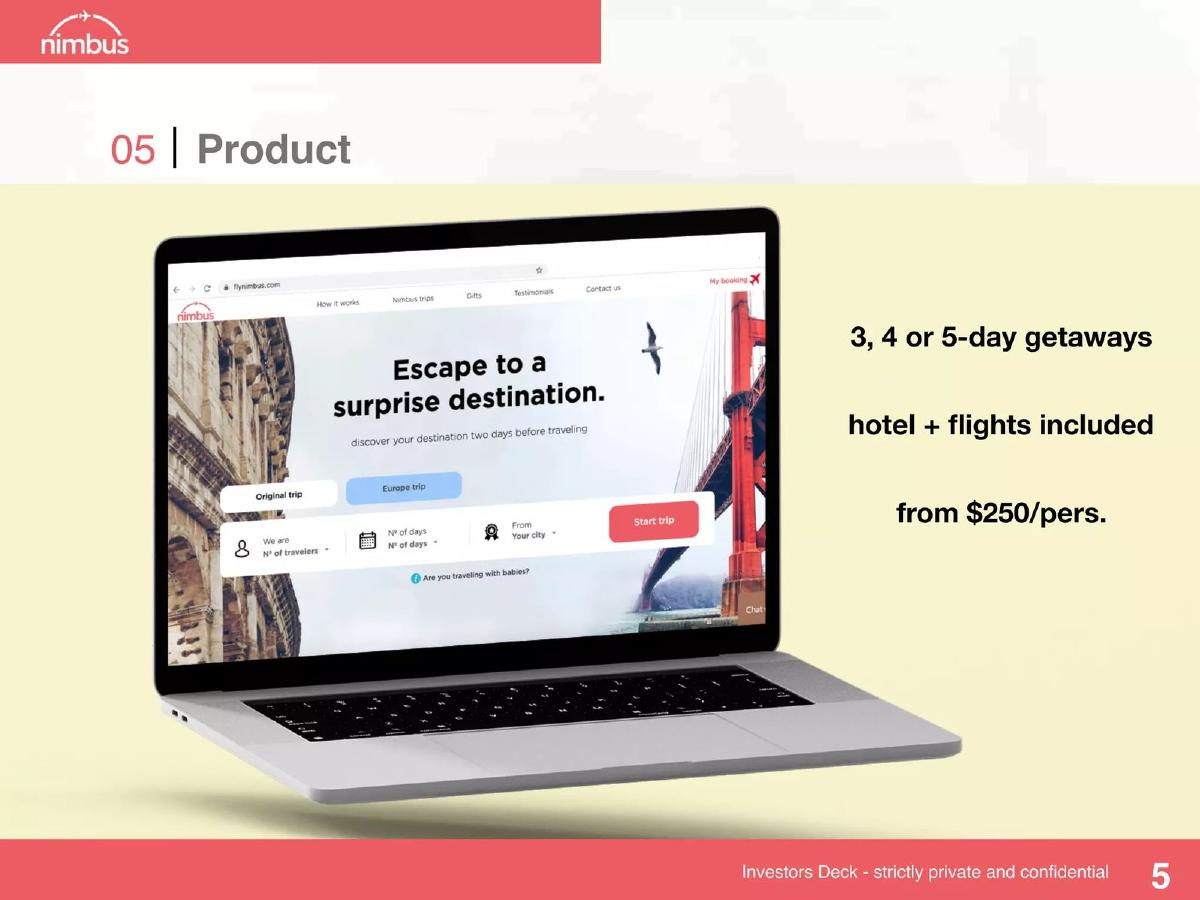
- The service offers fixed-price trips starting from $250 per person, including hotel and flight (Slide 2).
- Destinations are kept secret from the traveler until 2 days before the flight (Slide 2).
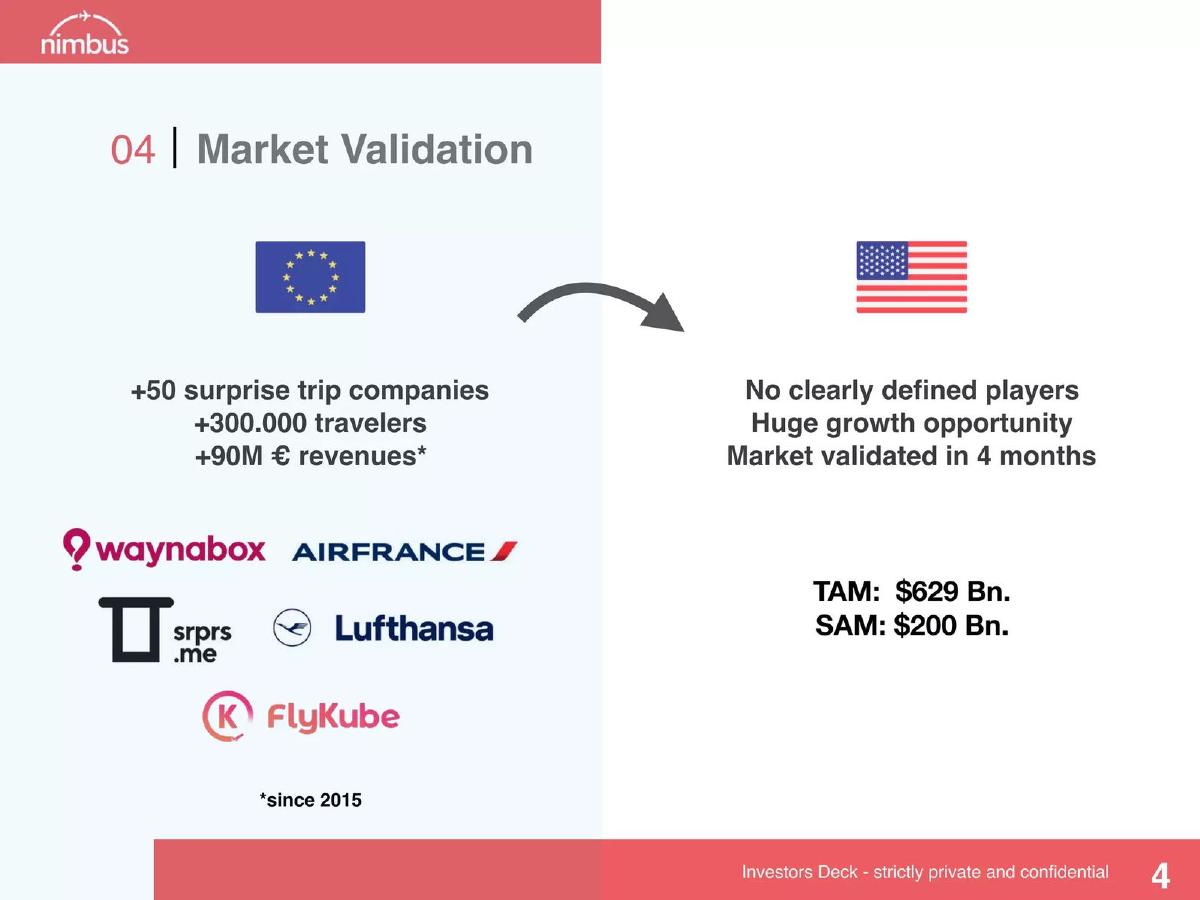
- The European market for surprise travel is cited as having 300,000+ travelers and 90M+ Euros in revenue (Slide 4).
- Product features include the ability to remove up to 4 undesired destinations, with the first discard being free and subsequent ones costing $12 (Slide 6).
- Reported CAC is $19.07 against an average ticket price of $367 per person (Slide 10).
- The company claims a 21% average profit margin and a very low monthly cash burn rate of $400 (Slide 10).
- Revenue peaked in May at approximately $16,000 before dipping in June and July (Slide 10).
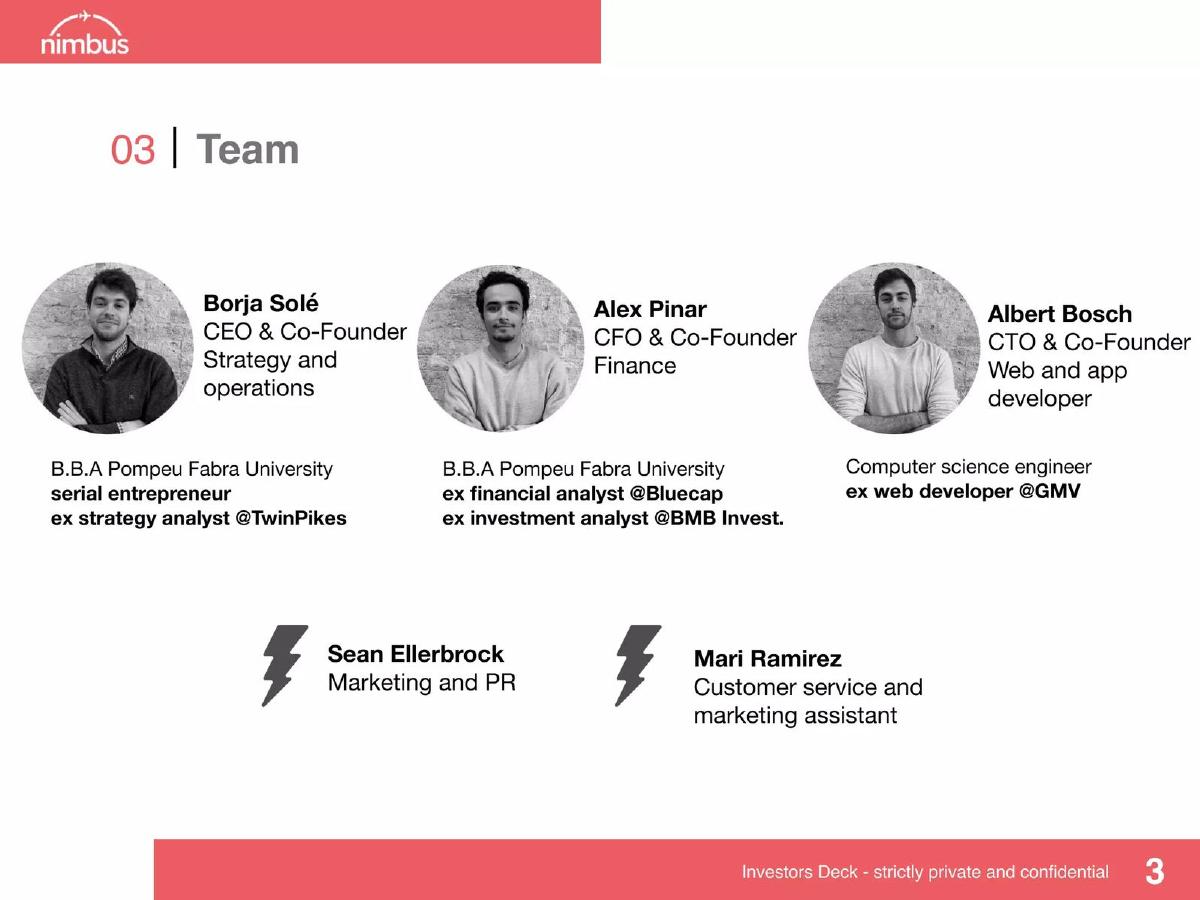
- The deck lists mentors from San Diego Ventures and Waynabox but omits the actual founding team members (Slide 14).
Fly nimbus Pitch Deck Analysis
Fly nimbus presents a travel model built on spontaneity and price certainty. The deck focuses heavily on the arbitrage opportunity of bringing a proven European business model to the North American market. By offering fixed-price 'surprise' trips, the company aims to capture a demographic that values experience and ease over specific destination planning.
Slide 1: Title Slide
The title slide features the brand name 'nimbus' with the tagline 'Surprise Traveling.' The visual identity is clean, using a red-orange palette and a minimalist airplane arc logo. The background imagery of the Colosseum and the Golden Gate Bridge reinforces the dual-market focus (Europe and North America) mentioned later in the deck.
Slide 2: The Solution
Slide 2 defines the core product offering. It breaks the solution into three pillars: Surprise destination trips (unknown until 2 days before flying), Fixed low-cost price (starting from $250 per person), and Everything planned (inclusive of hotel and flight). This slide effectively addresses the 'what' of the business immediately, though it contains a typo ('Unkown').
Slide 4: Market Validation
This slide uses the European market as a proxy for North American potential. It claims that since 2015, the European surprise travel market has grown to over 50 companies, 300,000 travelers, and 90 million Euros in revenue. It lists competitors like Waynabox, FlyKube, and even legacy carriers like Air France and Lufthansa. The slide then contrasts this with the US, stating there are 'no clearly defined players' and citing a TAM of $629 Bn and a SAM of $200 Bn . The claim that the market was 'validated in 4 months' suggests a rapid pilot phase.
Slide 6: Product Interface
Slide 6 provides a look at the user experience via a laptop mockup. The key feature highlighted is the ability to 'Remove destinations you DON'T like!' The interface shows a grid of 15 possible destinations, including Boston, Denver, Aspen, and Los Angeles. The monetization of choice is clear: the first discard is free, but each subsequent discard costs $12 per traveler. This is a critical detail as it shows how the company manages the risk of sending travelers to undesirable locations while generating incremental revenue.
Slide 8: Go-to-Market Strategy
The strategy is described as a 'single channel way of acquiring new customers.' The funnel moves from awareness (Facebook, Instagram, Reddit, YouTube) to a website visit, online conversion, and finally a loyalty program for repetition. While it calls it a 'single channel,' the icons represent a multi-platform social media strategy. The emphasis is on digital-first acquisition to keep costs low.
Slide 10: Traction and Metrics
This is the most data-dense slide in the deck. It shows two charts: Revenue and Average Ticket per person. Revenue shows a growth trend from December through May (peaking near $16k) before a seasonal or operational dip in June and July. The average ticket price has steadily increased from approximately $225 to $367. Key metrics listed at the bottom include:
$19.07 CAC: A very low acquisition cost for a high-ticket travel product. · 21% avg. profit margin: Indicating healthy spreads between booking costs and retail price. · $367 average ticket: Confirming the move away from the $250 entry point. · $400 cash burn rate: An exceptionally low burn rate, suggesting a lean, perhaps founder-led operation.
Slide 12: Roadmap
The roadmap is split between 2019 and 2020. For 2019, the goals include launching exotic destinations, trip insurance, talent acquisition, and automating the booking system. For 2020, the focus shifts to brand building in North America, new products like cruises, and 'Eat Nimbus,' which is described as 'Surprise Restaurants.' The inclusion of restaurant surprises suggests an ambition to own the broader 'surprise' experience economy.
Slide 14: Mentors & Partners
Slide 14 lists four individuals: Vic Wintriss (ex-partner at San Diego Ventures), Jose Luis Llacuna (CEO at International Cookware), Pepe Agell (CSO at Chairboost), and Oriol Esteban (ex-CMO at Waynabox). The inclusion of an ex-CMO from a direct European competitor (Waynabox) is a strong signal of industry expertise. The slide also mentions 'ThinkTank' and 'OneTreePlanted' as partners. Notably, the actual founders are not listed on this slide or anywhere else in the provided 8 slides.
What Fly nimbus Does Well
The deck excels at identifying a clear market gap. By showing the success of the model in Europe and the lack of competition in North America, they create a compelling 'why now' narrative. The unit economics presented on slide 10 are also a highlight; a $19 CAC for a $367 ticket is an enviable ratio that suggests a highly efficient marketing engine or a very underserved audience.
The product slide (Slide 6) is also effective because it addresses the primary consumer objection to surprise travel: 'What if I end up somewhere I hate?' By showing the 'discard' feature and its associated cost, they demonstrate both a user-centric solution and a secondary revenue stream.
What is Missing from the Deck
The most glaring omission is the Founding Team . While mentors are helpful for credibility, investors fund founders. The lack of bios for the people actually running the day-to-day operations is a significant red flag in a standard pitch process. Furthermore, there is no Ask Slide . We do not know if the company is looking for $500k or $5M, nor do we know how they intend to allocate the capital (e.g., 50% marketing, 30% engineering).
The Traction Slide (Slide 10) shows a revenue decline in June and July. While travel can be seasonal, a pitch deck should ideally explain a dip in the trend line to prevent investors from assuming the business is losing steam. Finally, the deck lacks a Competitive Landscape slide for the US market. While they claim there are no 'clearly defined players,' they should still acknowledge indirect competitors or smaller niche players to show they have done their homework.
Founder Takeaways
Use Proxy Markets for Validation: If you are bringing a model from one geography to another, use the established market's data (as Fly nimbus did with Europe on Slide 4) to prove the concept works at scale. It reduces the perceived risk of the business model itself.
Monetize Friction: The $12 fee to discard a destination is a brilliant way to turn a product limitation (the risk of a bad destination) into a revenue opportunity. Founders should look for ways to charge for 'certainty' in an uncertain product offering.
Be Transparent About Metrics: Including CAC, profit margins, and burn rate on a single slide (Slide 10) is a great way to show you understand the levers of your business. However, always be prepared to explain any downward trends in your charts during the Q&A.
Don't Hide the Team: Never substitute mentors for founders. Investors want to see who is in the trenches. If you have a mentor from a competitor, that's a bonus, but the core team must be front and center.
Frequently asked questions
- How does Fly nimbus make money?
- Fly nimbus generates revenue through fixed-price travel packages starting at $250 per person. According to slide 10, they maintain an average profit margin of 21%. They also monetize product customizations, such as charging $12 per person to discard specific destinations from the potential surprise pool after the first free discard, as shown on slide 6.
- What is the primary market opportunity identified by the company?
- The company identifies a massive gap in the North American market. Slide 4 notes that while Europe has over 50 surprise trip companies and 90 million Euros in revenue, North America has 'no clearly defined players.' They cite a Total Addressable Market (TAM) of $629 billion and a Serviceable Addressable Market (SAM) of $200 billion.
- What are the key metrics for customer acquisition?
- Fly nimbus reports a Customer Acquisition Cost (CAC) of $19.07 on slide 10. Their go-to-market strategy relies on a 'single channel' approach using digital platforms like Facebook, Instagram, Reddit, and YouTube to drive traffic to their webpage for online conversion and eventual loyalty program participation (Slide 8).
- What is missing from the Fly nimbus pitch deck?
- The most significant omission is the founding team slide; while slide 14 lists mentors and partners, it does not identify the founders or their specific backgrounds. Additionally, there is no explicit 'Ask' slide detailing how much capital is being raised or the valuation sought. Detailed unit economics beyond the basic margin and CAC are also absent.
- What is the 'surprise' element of the product?
- The core value proposition is 'Surprise Traveling.' As detailed on slide 2, the destination of the trip remains unknown to the traveler until 48 hours before they fly. The traveler selects a date and a price point, and the company handles the planning of both the flight and the hotel stay.