How to Show Time to Value on a Pitch Deck (7 Real Slides)
How startups show that customers get set up and see results fast: phased go-live plans, product-by-product onboarding times, before-and-after claims.
How to Show Time to Value on a Pitch Deck
Seven slides from real pitch decks that make one argument: a new customer gets set up and sees results quickly. For each, we record what the slide actually states — a dated go-live plan, an onboarding time per product, a before-and-after claim, a comparison with replacing a legacy system, or the time to a first business outcome — and whether the figure is a plan, a claim or a measurement. None of the seven reports a measured customer average.
TL;DR
Time to value is how long a new customer waits between signing and getting the result they bought. On a pitch deck it matters because it drives sales cycle, implementation cost, early churn and how fast revenue starts. Real decks show it in five forms, from most to least checkable: a phased plan with day ranges (Bringg: setup day 0–30, initial go-live day 30–60, scale up day 60+); a time per product line (Cleary: an onboarding customer can onboard its next cohort "in about an hour", EX Platform customers in "a few days to a few weeks"); time to a first outcome (Breakout: new leads "in less 4 weeks"); a single go-live figure (Exotec: "Go live in 6 month"); and relative claims (Duco: "months to hours"; Fabric: 12–16 months of replatforming versus "Launch in weeks"; Evisort: "weeks, not months").
Every one of these is the company's own claim or plan; none states how many customers, over what period, achieved the figure. The strongest slide gives a number, says what starts and stops the clock, and names what the customer must do. The weakest compares itself with an unsourced "before". If you have measured data — median days from contract to go-live across your last cohort of customers — that beats every example here.
Time-to-value slides from real pitch decks
Each example shows the exact stored slide beside its analysis and links to the full teardown. Figures are the companies' own claims or plans; none is a measured customer average. Stage and year are given only where the slide states them.
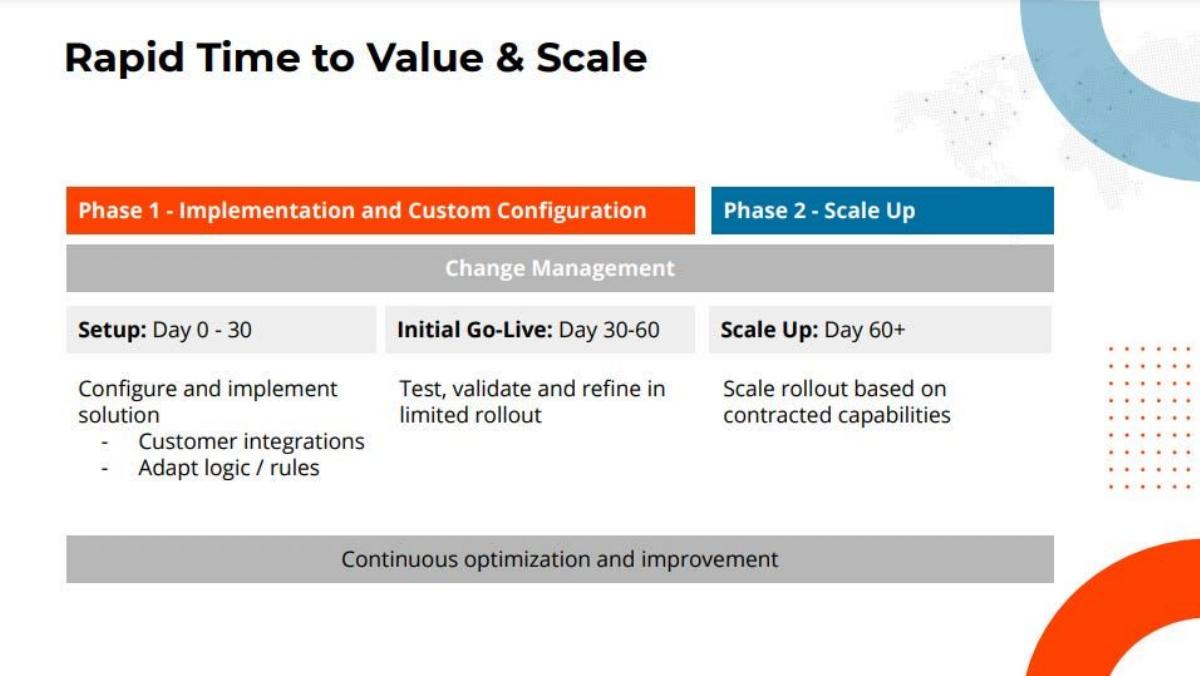
Bringg go to market slide — slide 20
Delivery and fulfilment orchestration software sold to enterprises. The slide sits in the go-to-market part of the deck.
Bringg deck, slide 20. Exact stored slide matched to this analysis.
Our analysis: The slide treats time to value as a managed project, not a product feature: integrations and rule changes take a month, a limited rollout takes another, and scale follows contracted scope. That honesty about real setup work makes the 60-day go-live claim more believable than a bare "fast".
Evidence and limitation: A delivery plan with day ranges. No count of deployments that met it, no customer named, no median.
What a founder can adapt: If setup needs customer work, show the phases with day ranges and say how many deployments have followed the plan.
Supporting analysis
What the deck claims: Title "Rapid Time to Value & Scale". Phase 1 – Implementation and Custom Configuration; Phase 2 – Scale Up; a Change Management bar spans both. Setup: Day 0 - 30 — configure and implement solution, customer integrations, adapt logic / rules. Initial Go-Live: Day 30-60 — test, validate and refine in limited rollout. Scale Up: Day 60+ — scale rollout based on contracted capabilities. Footer bar: "Continuous optimization and improvement".
Presentation choice: It is the only slide here that defines every stage of the clock and what happens in each.
When it does not fit: Don't present a plan as if it were a measured result.
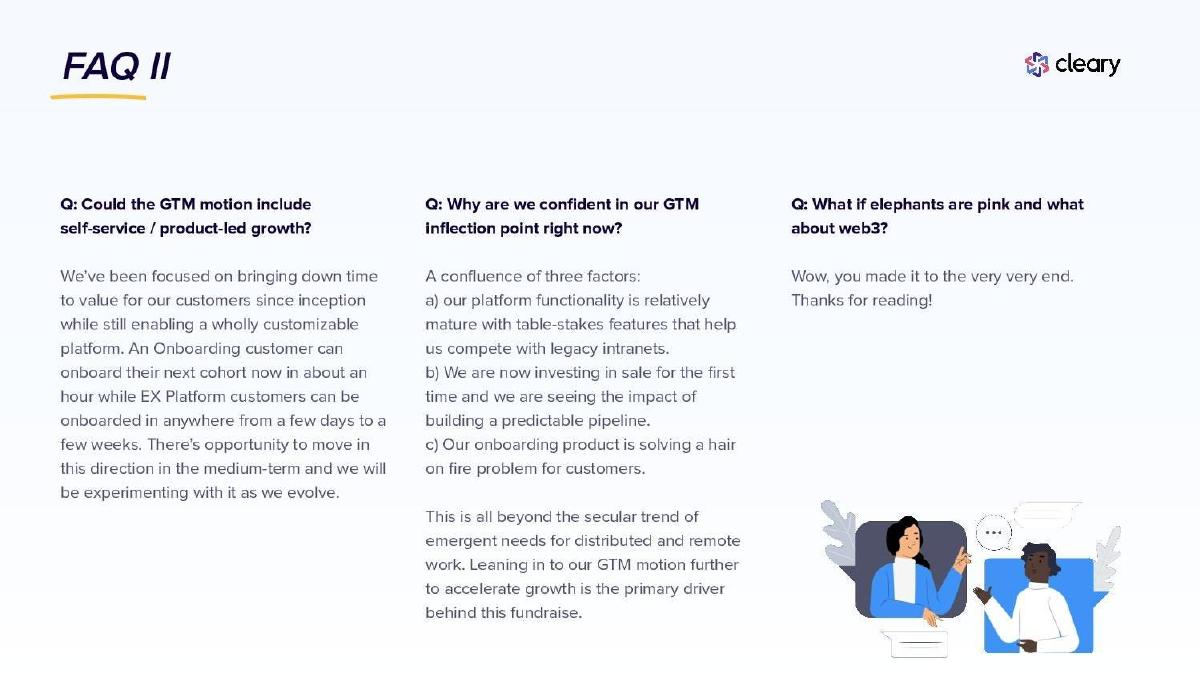
Employee onboarding and experience platform. The figures sit in an FAQ slide near the end of the deck.
Cleary deck, slide 18. Exact stored slide matched to this analysis.
Our analysis: Splitting by product keeps the fast figure from being read as the norm, and linking time to value to a self-service motion explains why it matters for go-to-market. The hour describes onboarding a further cohort for an existing customer, not the customer's own first setup — a distinction worth making explicit.
Evidence and limitation: Claimed times for two products; no customer count or period.
What a founder can adapt: Give a time per product or segment, and say whether it is the first setup or a repeat use.
Supporting analysis
What the deck claims: Q: "Could the GTM motion include self-service / product-led growth?" A: "We've been focused on bringing down time to value for our customers since inception while still enabling a wholly customizable platform. An Onboarding customer can onboard their next cohort now in about an hour while EX Platform customers can be onboarded in anywhere from a few days to a few weeks. There's opportunity to move in this direction in the medium-term and we will be experimenting with it as we evolve."
Presentation choice: It shows how to report different times for different products rather than one blended claim.
When it does not fit: Don't let your fastest product's time stand for the whole company.
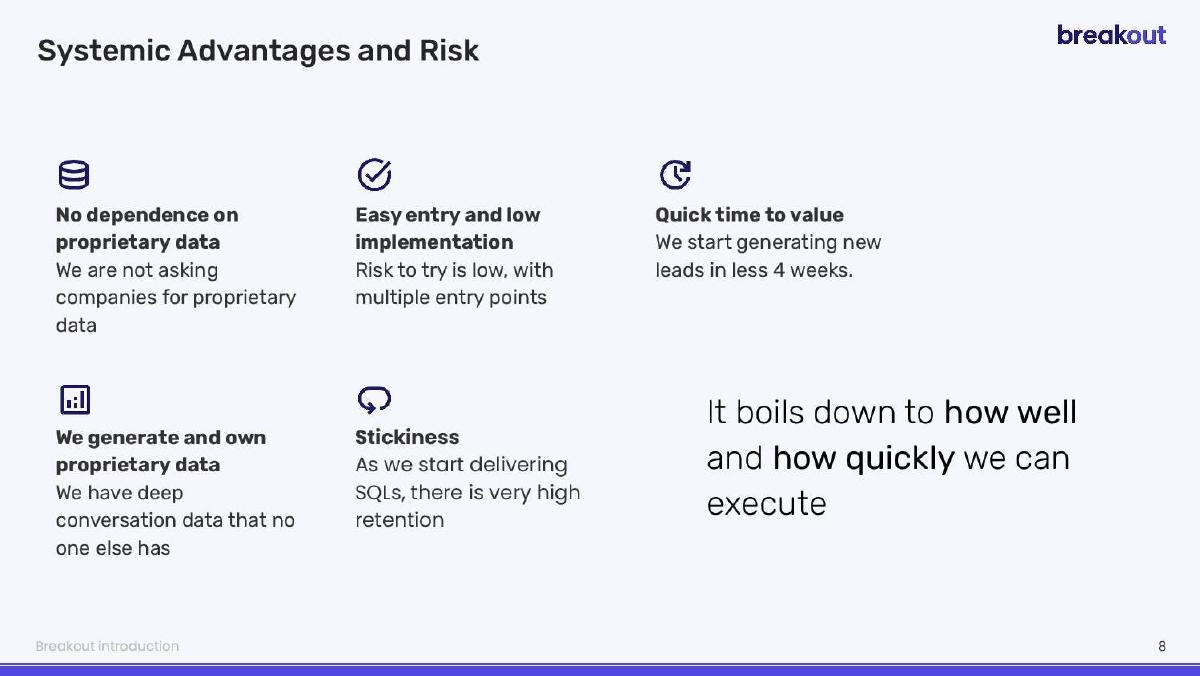
AI sales-development service generating qualified leads. The slide is titled "Systemic Advantages and Risk".
Breakout deck, slide 8. Exact stored slide matched to this analysis.
Our analysis: The clock runs to the outcome the customer pays for, not to software installed — the more useful definition. The slide also links fast value to retention, which is the argument investors care about, but offers no figure for either.
Evidence and limitation: Claimed time to first leads; "very high retention" is not quantified.
What a founder can adapt: Count to the first outcome your customer buys, and back the link to retention with a number.
Supporting analysis
What the deck claims: "Quick time to value — We start generating new leads in less 4 weeks." Beside it: "Easy entry and low implementation — Risk to try is low, with multiple entry points" and "Stickiness — As we start delivering SQLs, there is very high retention". Closing line: "It boils down to how well and how quickly we can execute".
Presentation choice: It defines time to value as time to a first business result.
When it does not fit: Don't claim a retention benefit from fast value without data.
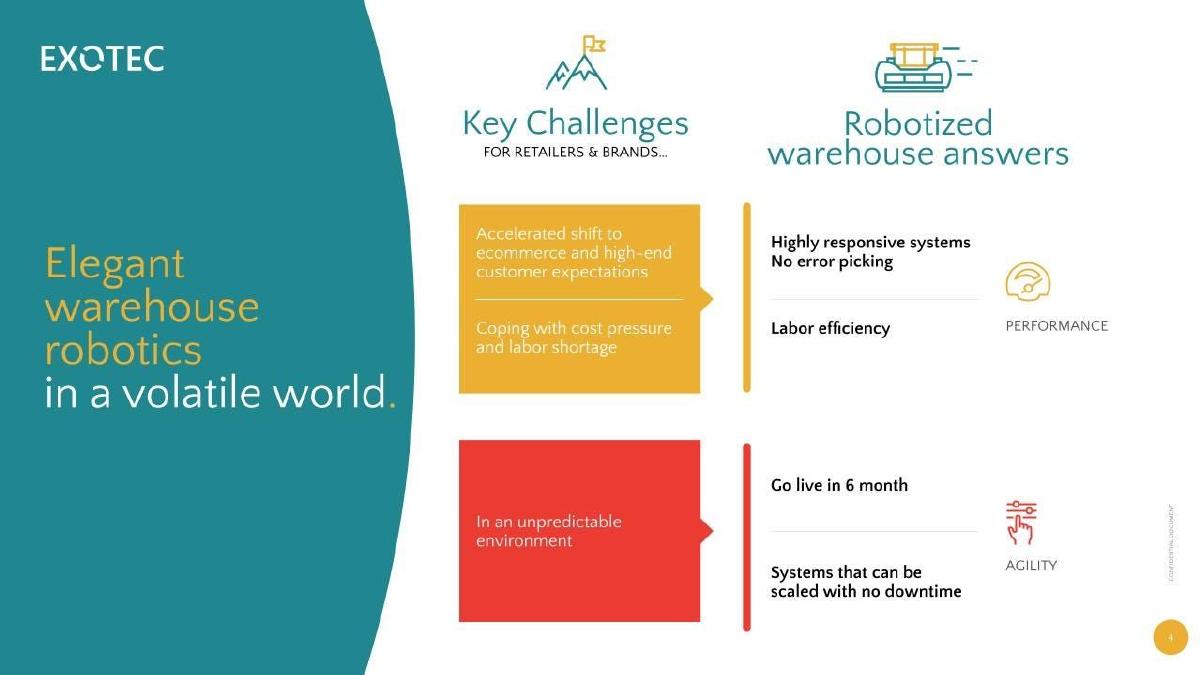
Warehouse robotics for retailers and brands. The slide pairs customer challenges with "Robotized warehouse answers"; footer page 4.
Exotec deck, slide 5. Exact stored slide matched to this analysis.
Our analysis: For physical automation, six months can be fast — but the slide leaves the reader to supply the comparison. It answers "how long?" without saying from what event, for what project size, or against what alternative.
Evidence and limitation: One claimed go-live figure; no definition of what is included and no comparison stated.
What a founder can adapt: State the go-live figure with its start event, typical project scope and the alternative timeline.
Supporting analysis
What the deck claims: Key challenges: accelerated shift to ecommerce and high-end customer expectations; coping with cost pressure and labor shortage; an unpredictable environment. Answers under Performance: highly responsive systems, no error picking, labor efficiency. Under Agility: "Go live in 6 month" and "Systems that can be scaled with no downtime".
Presentation choice: It shows a hardware business putting a concrete number on time to value.
When it does not fit: Don't leave the comparison that makes your figure impressive unstated.
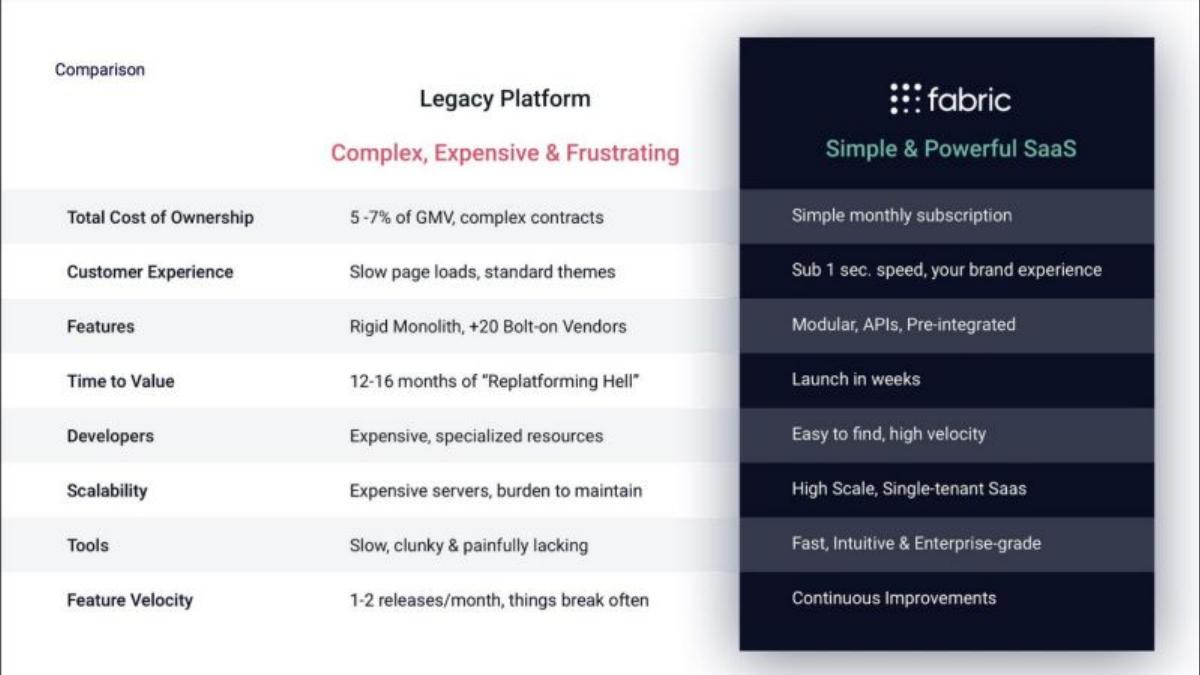
Commerce platform software for retailers. A comparison table of a legacy platform versus Fabric.
Fabric deck, slide 12. Exact stored slide matched to this analysis.
Our analysis: Placing time to value in a row of a comparison table makes it a buying criterion. The persuasive figure is the incumbent's 12–16 months, which is a market characterisation rather than a measurement — and "weeks" on Fabric's side is vaguer than the number it is compared with.
Evidence and limitation: The legacy baseline is unsourced; Fabric's side gives no number of weeks.
What a founder can adapt: Source the legacy baseline and give your own figure with the same precision.
Supporting analysis
What the deck claims: Rows comparing Legacy Platform ("Complex, Expensive & Frustrating") with Fabric ("Simple & Powerful SaaS"). Time to Value: "12-16 months of 'Replatforming Hell'" versus "Launch in weeks". Other rows include total cost of ownership ("5 -7% of GMV, complex contracts" versus "Simple monthly subscription") and feature velocity ("1-2 releases/month, things break often" versus "Continuous Improvements").
Presentation choice: It frames time to value as a reason to switch from an incumbent.
When it does not fit: Don't compare a precise competitor figure with an unquantified one of your own.
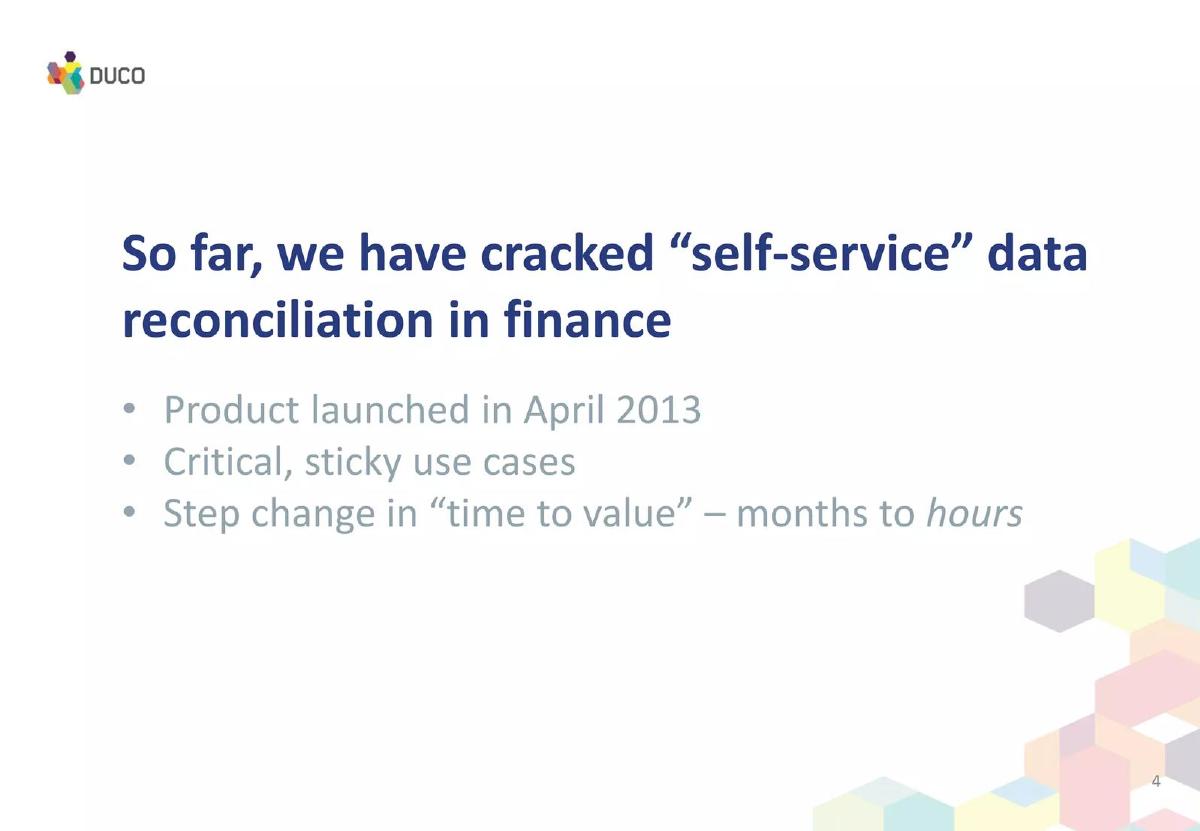
Data reconciliation software for financial institutions; footer page 4.
Duco deck, slide 5. Exact stored slide matched to this analysis.
Our analysis: The headline ties fast time to value to self-service — no implementation project needed — which is a strong positioning argument. As evidence it is thin: a reader learns the direction and scale of the claim but not what took months before, or for whom.
Evidence and limitation: Relative claim; neither the "months" baseline nor the "hours" figure is sourced or quantified.
What a founder can adapt: Name what used to take months, cite who measured it, and give your own figure in hours with a customer count.
Supporting analysis
What the deck claims: "So far, we have cracked 'self-service' data reconciliation in finance" — "Product launched in April 2013"; "Critical, sticky use cases"; "Step change in 'time to value' – months to hours".
Presentation choice: It shows the before-and-after form at its most compressed.
When it does not fit: Don't rest the claim on an unsourced baseline.
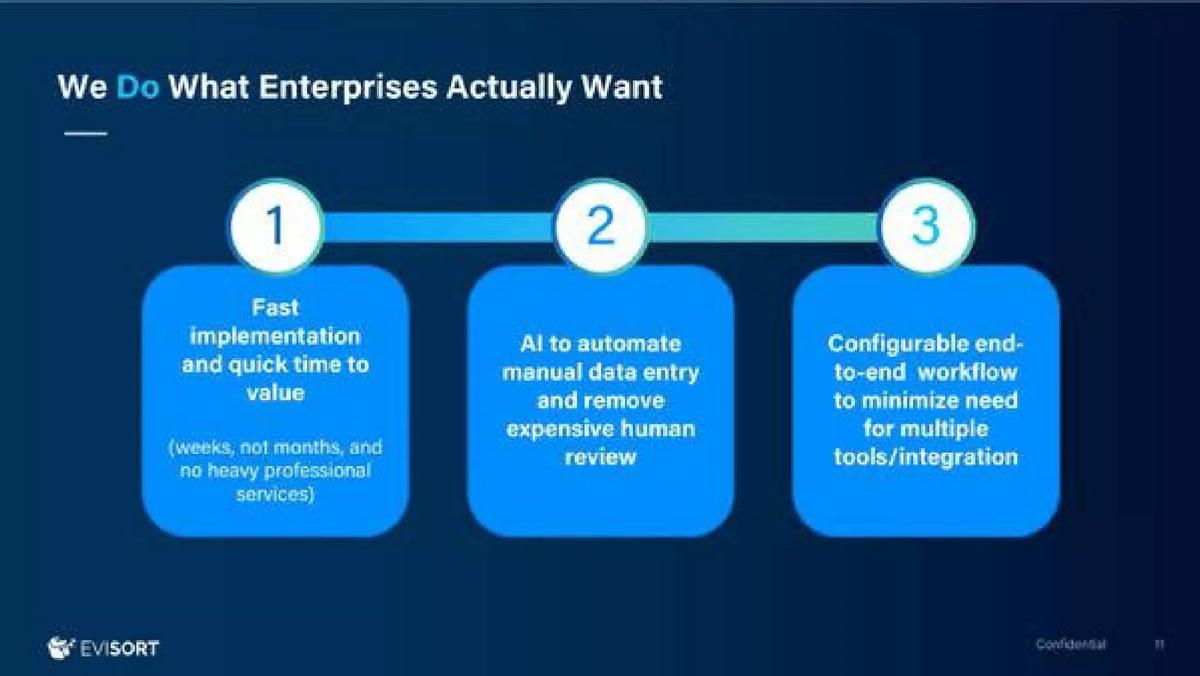
AI contract management software. The slide is titled "We Do What Enterprises Actually Want"; footer page 11.
Evisort deck, slide 10. Exact stored slide matched to this analysis.
Our analysis: "Weeks, not months" sets an order of magnitude and the mention of professional services hints at the cost argument, but nothing on the slide can be checked. It is the floor of this set — a positioning statement waiting for evidence elsewhere in the deck.
Evidence and limitation: No number, start event or customer reference.
What a founder can adapt: Replace "weeks, not months" with a median and the number of customers it covers.
Supporting analysis
What the deck claims: Three numbered points: (1) "Fast implementation and quick time to value (weeks, not months, and no heavy professional services)"; (2) "AI to automate manual data entry and remove expensive human review"; (3) "Configurable end-to-end workflow to minimize need for multiple tools/integration".
Presentation choice: It marks the weakest form: an unquantified relative claim.
When it does not fit: Don't present an order-of-magnitude slogan as evidence.
Columns report what each slide states; the last column notes what a reader can check.
Example
Type
Figure
Clock ends at
Baseline
What a reader can check
Bringg
Plan
Go-live day 30–60; scale day 60+
Initial go-live
None
Stages and tasks
Cleary
Claim
About an hour / days to weeks
Cohort onboarded
None
Which product is fast
Breakout
Claim
Under 4 weeks
First new leads
None
The outcome counted
Exotec
Claim
6 months
Go live
Unstated
The figure only
Fabric
Claim
Weeks vs 12–16 months
Launch
Legacy, unsourced
The comparison made
Duco
Claim
Months to hours
Unstated
Unsourced
Direction of the claim
Evisort
Claim
Weeks, not months
Implementation
Unsourced
Nothing specific
Key Takeaways
Define the clock. Breakout counts to the first new leads; Bringg counts to initial go-live; Cleary counts to a cohort onboarded. Say which you mean.
Give a number with a unit. "Go live in 6 month" (Exotec) and "in about an hour" (Cleary) can be tested; "quick time to value" cannot.
Show the phases if setup is real work. Bringg splits implementation and custom configuration from scale-up and names what happens in each.
Separate products. Cleary gives an hour for one product and days to weeks for the other instead of blending them.
Source your "before". Fabric's 12–16 months and Duco's "months" are the baselines that make the claim; neither slide says where they come from.
Measured beats claimed. Report a median across real customers when you have it, and label plans as plans.
Build your time-to-value line
Answer each prompt in one line, with a number where possible.
Clock. What event starts the clock (contract, kickoff) and what ends it (go-live, first result)?
Figure. What is the median time across your customers, and how many customers does it cover?
Phases. Which steps need customer work — integrations, data, training — and how long does each take?
Segments. Does the time differ by product, plan or customer size? Give each separately.
Baseline. What does the alternative take, and who measured it?
Copyable framework: Customers [reach first result] a median [x days] after [contract] ([n] customers since [date]); setup takes [y days] of which [z] need customer work; the alternative typically takes [baseline] ([source]).
Illustrative example 1 — written by us
Before: Fast implementation and quick time to value (weeks, not months).
After: Median [x] days from contract to first contracts processed across [n] customers signed since [date]; the alternative typically takes [baseline] ([source]).
What improved: Illustrative template for Evisort's line; bracketed values are for the company to supply.
Why time to value belongs on the go-to-market story
An investor reading a go-to-market slide asks how quickly a signed customer turns into recognised revenue and a reference. Time to value sits between the two. A long implementation stretches the sales cycle because buyers price in the effort; it ties up services staff whose cost rarely appears in gross margin forecasts; and it delays the moment a customer sees the result that keeps them renewing. A short one does the reverse — which is why so many decks assert it. The guide on sales cycles covers the time to close a deal; this guide covers what happens after the contract is signed.
Because the claim is common, it is cheap. "Fast implementation" appears in many enterprise decks with no number behind it. What distinguishes the slides below is how much of the claim a reader can check: whether there is a number, whether the start and end of the clock are defined, whether the baseline is sourced, and whether anything is measured rather than promised.
Hardware and services businesses face a different version of the same question. Exotec's warehouse robots take months to install, and the slide presents six months as fast against an implicit alternative. Time to value is always relative to what a buyer would otherwise endure, so the comparison has to be stated, not assumed.
The five forms, most checkable first
A phased plan with day ranges (Bringg) shows the reader the work. Bringg's slide, titled "Rapid Time to Value & Scale", divides delivery into Phase 1 (implementation and custom configuration) and Phase 2 (scale up), with change management spanning both. Setup runs day 0–30 (configure and implement the solution, customer integrations, adapting logic and rules); initial go-live runs day 30–60 (test, validate and refine in limited rollout); scale up starts at day 60 (scale rollout based on contracted capabilities). It is a plan, not a record, but it defines every stage and its owner's task.
A time per product line (Cleary) avoids a blended average that describes no customer. In an FAQ slide, Cleary says an onboarding customer "can onboard their next cohort now in about an hour" while EX Platform customers "can be onboarded in anywhere from a few days to a few weeks" — and ties it to a go-to-market question about self-service. The honesty is in the split: one product is fast, the other is not, and the slide says so.
Time to a first outcome (Breakout) measures value, not setup. "We start generating new leads in less 4 weeks" counts until the customer receives what it pays for — leads — rather than until software is installed. That is the more meaningful clock, though the slide does not say how many customers it describes.
A single go-live figure (Exotec) gives a testable number with no detail. "Go live in 6 month" appears as one line under an "Agility" heading, beside "Systems that can be scaled with no downtime". A reader knows the claim but not what is included, nor what a typical warehouse automation project takes.
Relative claims (Duco, Fabric, Evisort) compare against a baseline. Duco claims a "step change in 'time to value' – months to hours" for self-service data reconciliation; Fabric's comparison table puts "12-16 months of 'Replatforming Hell'" for a legacy commerce platform against "Launch in weeks"; Evisort promises "weeks, not months, and no heavy professional services". The baseline carries the persuasive weight in each case and none of the three sources it.
Planned, claimed or measured — label it
The seven slides fall into two of three categories. Bringg's is a plan: it describes how a deployment is scheduled. The other six are claims: statements of how fast the company says customers get value. None is a measurement, which would state a figure observed across named customers or a defined cohort — for example, median days from contract to go-live for customers signed in a given period.
An investor will ask which category a time-to-value figure belongs to, so label it before they do. If you have measurements, say how many customers they cover and over what dates. If you only have a plan, show it as a plan and add the evidence you do have — how many deployments have followed it. If you only have a claim, give it a number and a definition, and expect to be asked for references.
Watch the baseline. A "before" figure such as Fabric's 12–16 months reads as fact on the slide but is a market characterisation. Cite a source (analyst research, your own customers' prior projects, a named reference) or present it as typical rather than measured.
Common mistakes
No defined clock. Say what starts and what ends the time you quote.
Plans shown as results. Label a schedule as a plan and add how many deployments met it.
Unsourced baselines. A "before" figure needs a source or the word typical.
Blended averages. Report each product or segment separately.
Slogans without numbers. "Weeks, not months" needs a median and a customer count.
Hiding customer work. Name integrations, data and training the customer must supply.
Diagnostic checklist
The slide gives a number with a unit.
The start and end of the clock are defined.
Each figure is labelled as planned, claimed or measured.
Measured figures state how many customers and over what period.
Any baseline comparison is sourced.
Different products or segments are reported separately.
Frequently asked questions
How do I show time to value on a pitch deck?
Give a number, define what starts and ends the clock, and label whether it is a plan, a claim or a measurement. Bringg shows a phased plan with day ranges, Cleary separates products, and Breakout counts to the first business outcome.
Should time to value count to go-live or to the first result?
The first result the customer pays for is the more meaningful clock. Breakout counts to new leads; Bringg counts to initial go-live. If you use go-live, say how long after it the customer sees value.
Can I compare my time to value with an incumbent's?
Yes, as Fabric does with 12–16 months for a legacy replatforming, but source the incumbent figure and give your own with equal precision.
What if setup genuinely takes months?
Show the phases and what the customer must do, as Bringg does, and state the alternative timeline. Exotec's six months reads as fast only against an unstated comparison.
What is the weakest way to claim fast time to value?
An unquantified relative phrase such as "weeks, not months" (Evisort) with no customer count, start event or baseline source.
How we chose these examples
Search (2026-10-01): the durable corpus index (70,729 unique pages, deduplicated by deck-file sha256 + page) was searched for time to value, implementation time, go live in, and onboarded or onboarding with a number of minutes, days or weeks. Listed-company, SPAC, mining, energy-utility and cannabis-producer investor-relations decks were excluded; all seven companies used are private. Earlier leads on customer concentration and price increases were rejected because existing guides cover them or the evidence came from excluded decks.
Seven candidate pages were rendered from the original public deck files and read from the images; all seven are used: Bringg 20, Cleary 18, Breakout 8, Exotec 5, Fabric 12, Duco 5 and Evisort 10. Page numbers are PDF pages; printed footers show none, none, 8, 4, none, 4 and 11 respectively. Not used: Awake Security 16 ("Immediate time to value" with no figure), Airslate 2, Aisera 9, Ardoq 4 and Auquan 9 (time to value named without a figure), Intersailclub 24 (not rendered; its text lists a six-month implementation among other targets).
Figures are as printed on each slide and have not been verified against customer data; none is a measured customer average.
How we built this: drafted and checked with AI assistance (editorial model review against the original slide images); no human editor has reviewed this guide.