Sales Cycle Length in a Pitch Deck: 6 Real Slide Examples
How founders show how long it takes to close a customer: by customer size, by buyer, by stage and by pilot.
How to Show Your Sales Cycle Length by Customer and by Stage
Six slides from real pitch decks that state how long it takes to win a customer. We record what each slide states, whether it is measured, claimed or a benchmark, and what it leaves out.
TL;DR
A single sales-cycle number is less useful than a split. SportID gives an average of 3-4 months, then 1-2 months for small companies and 6-24 months for enterprises. Deep Render and Lattice Biologics break the cycle into stages, including a paid proof of concept of up to 6 months and a payment step of 1-4 months.
None of the six slides says how the figure was measured (from first contact or first meeting, to signature or to payment), over how many deals, or in what period. A cycle length with its start point, end point and sample is the part most decks leave out.
Sales-cycle slides from real pitch decks
Each example shows the exact page from the original public deck above its analysis and links to the full teardown. Figures are the companies' own and have not been verified. Page numbers are PDF pages.
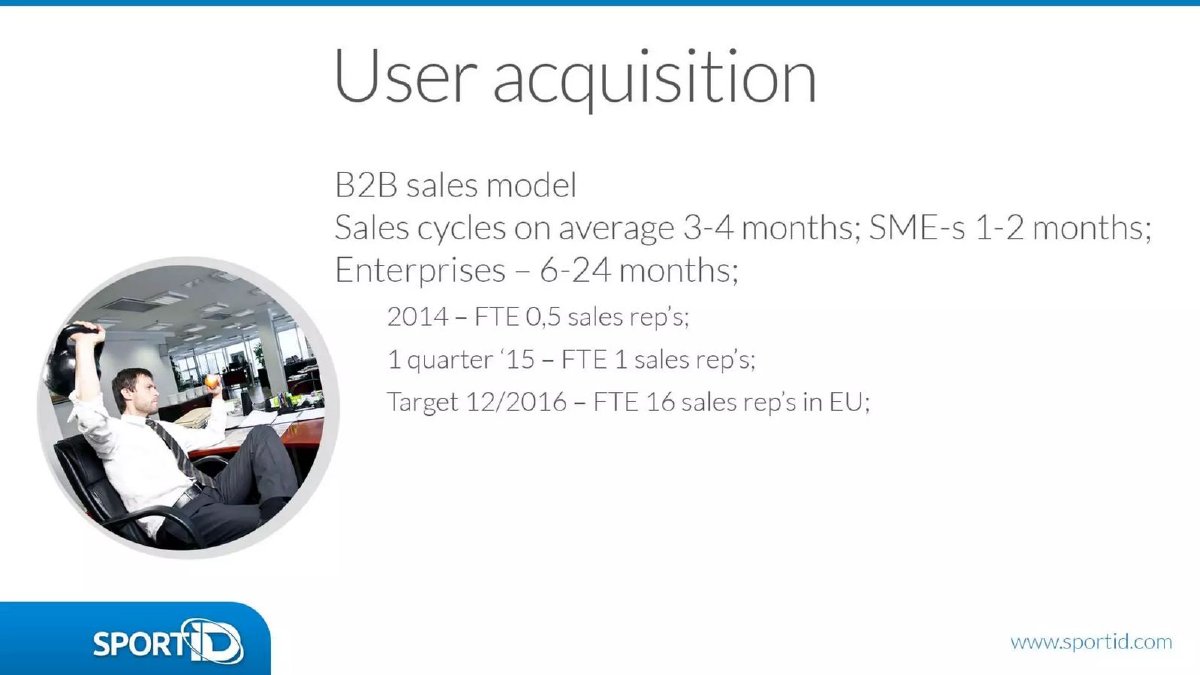
SportID go to market slide — slide 20
Sports-club software sold business to business. "User acquisition" slide.
SportID deck, slide 20. Exact stored slide matched to this analysis.
Our analysis: It is the only example here that splits the cycle by customer size, and the split shows why the average misleads: at the extremes of its ranges, an enterprise deal (24 months) takes twelve times as long as a small-company deal (2 months), by our calculation.
Evidence and limitation: The 6-24 month range is too wide to plan hiring against, and the slide does not say how many deals each figure rests on. Plans to go from one sales rep to 16 are a target, not evidence the cycle will hold.
What a founder can adapt: Give the cycle for each customer size you sell to, then the mix of deals by size so a reader can see which cycle dominates.
Supporting analysis
What the deck claims: "B2B sales model. Sales cycles on average 3-4 months; SME-s 1-2 months; Enterprises – 6-24 months;" then sales headcount: "2014 – FTE 0,5 sales rep's; 1 quarter '15 – FTE 1 sales rep's; Target 12/2016 – FTE 16 sales rep's in EU".
Presentation choice: It is the only example here that splits the cycle by customer size, and the split shows why the average misleads: at the extremes of its ranges, an enterprise deal (24 months) takes twelve times as long as a small-company deal (2 months), by our calculation.
When it does not fit: The 6-24 month range is too wide to plan hiring against, and the slide does not say how many deals each figure rests on. Plans to go from one sales rep to 16 are a target, not evidence the cycle will hold.
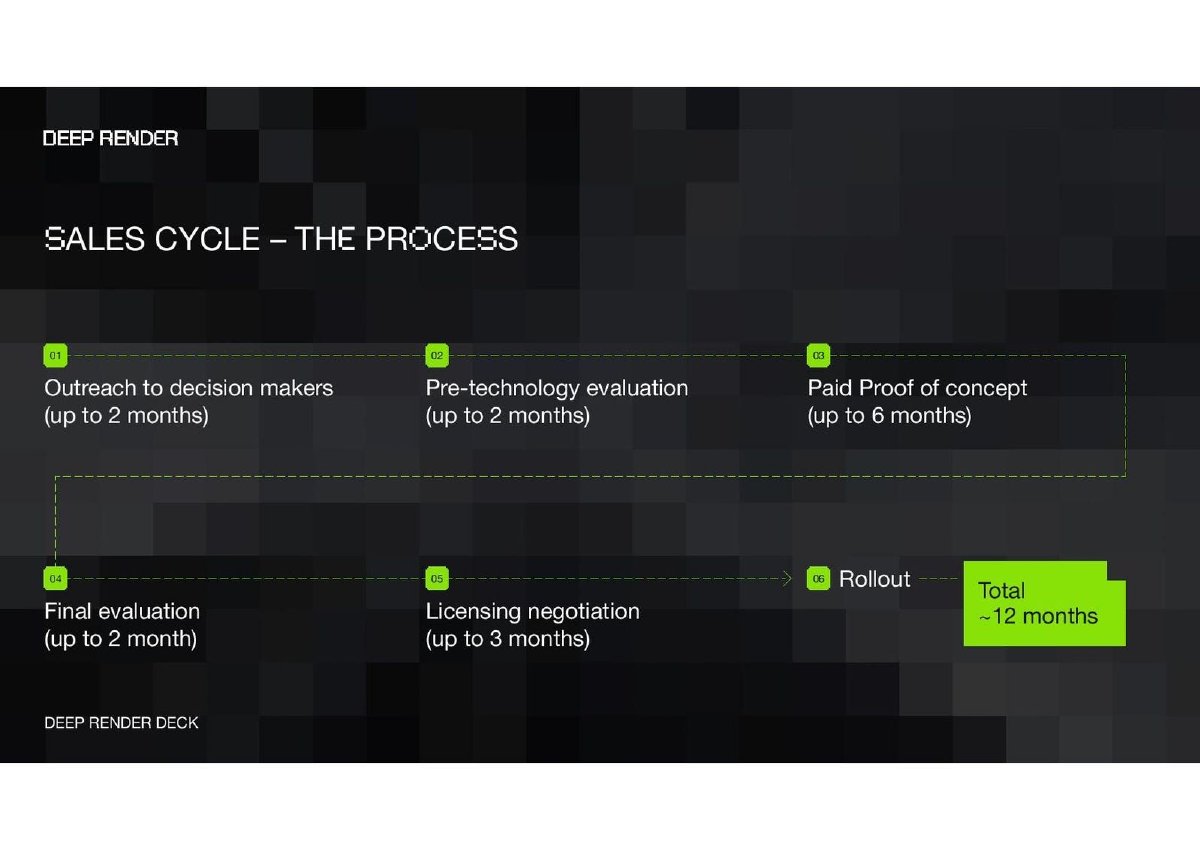
Video compression technology licensed to large companies. "Sales cycle – the process" slide, later in the deck.
Deep Render deck, slide 35. Exact stored slide matched to this analysis.
Our analysis: Breaking a year-long cycle into stages shows where the time goes: the paid proof of concept is the longest step. It is also one of very few slides in the collection that states how long a pilot can run.
Evidence and limitation: Every stage is "up to", so these are maximums; they add up to 15 months, not the ~12 total shown, and the slide does not explain the gap (overlapping stages, or typical rather than maximum times). No deal has been counted through the full path. Later pages in the same deck propose dropping proofs of concept to shorten the cycle.
What a founder can adapt: List each stage with its typical length, mark which stage is paid, and give the total.
Supporting analysis
What the deck claims: Six steps: "Outreach to decision makers (up to 2 months)", "Pre-technology evaluation (up to 2 months)", "Paid Proof of concept (up to 6 months)", "Final evaluation (up to 2 month)", "Licensing negotiation (up to 3 months)", "Rollout"; "Total ~12 months".
Presentation choice: Breaking a year-long cycle into stages shows where the time goes: the paid proof of concept is the longest step. It is also one of very few slides in the collection that states how long a pilot can run.
When it does not fit: Every stage is "up to", so these are maximums; they add up to 15 months, not the ~12 total shown, and the slide does not explain the gap (overlapping stages, or typical rather than maximum times). No deal has been counted through the full path. Later pages in the same deck propose dropping proofs of concept to shorten the cycle.
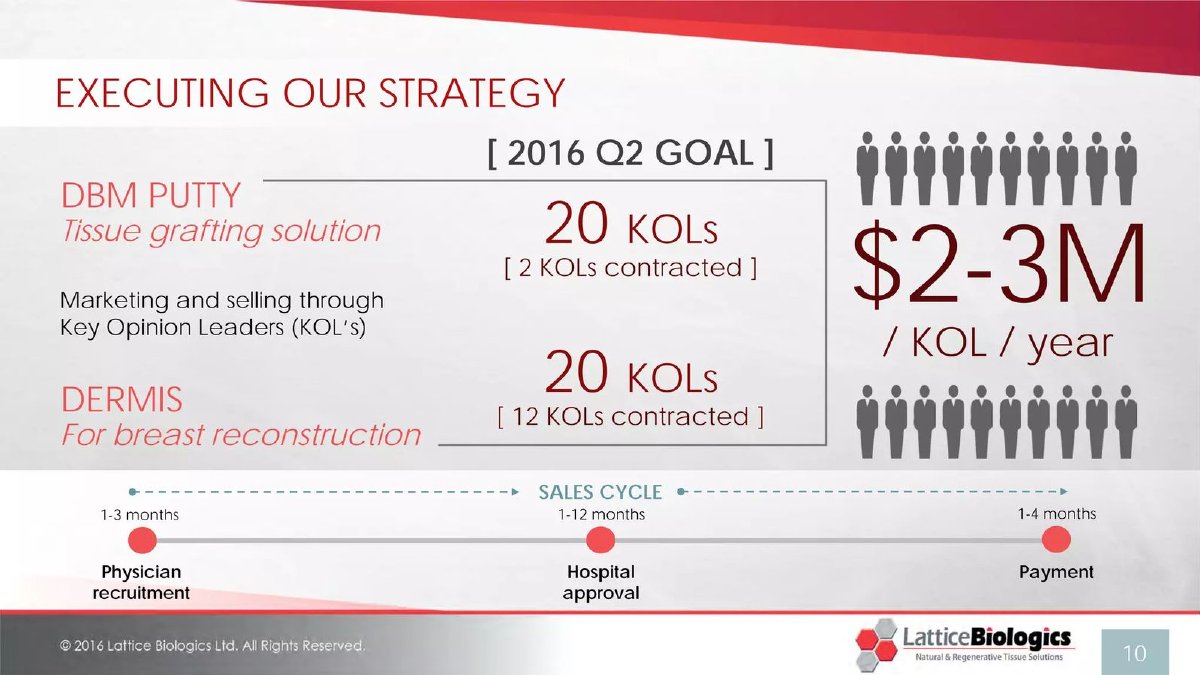
Tissue-grafting products sold through surgeons to hospitals. "Executing our strategy" slide.
Lattice Biologics deck, slide 10. Exact stored slide matched to this analysis.
Our analysis: It counts the cycle to cash, not to signature, and shows that hospital approval is the uncertain step. Including payment is rare and useful for a runway plan.
Evidence and limitation: Adding the step ranges gives 3 to 19 months in total (our calculation), and the slide does not give a typical figure. "$2-3M / KOL / year" is an expectation per surgeon, not measured revenue.
What a founder can adapt: If the buyer who decides is not the buyer who pays, show each step and add the time from contract to first payment.
Supporting analysis
What the deck claims: A "Sales cycle" timeline: "Physician recruitment 1-3 months", "Hospital approval 1-12 months", "Payment 1-4 months". Above it: a 2016 Q2 goal of 20 key opinion leaders per product ("2 KOLs contracted" and "12 KOLs contracted") and "$2-3M / KOL / year".
Presentation choice: It counts the cycle to cash, not to signature, and shows that hospital approval is the uncertain step. Including payment is rare and useful for a runway plan.
When it does not fit: Adding the step ranges gives 3 to 19 months in total (our calculation), and the slide does not give a typical figure. "$2-3M / KOL / year" is an expectation per surgeon, not measured revenue.
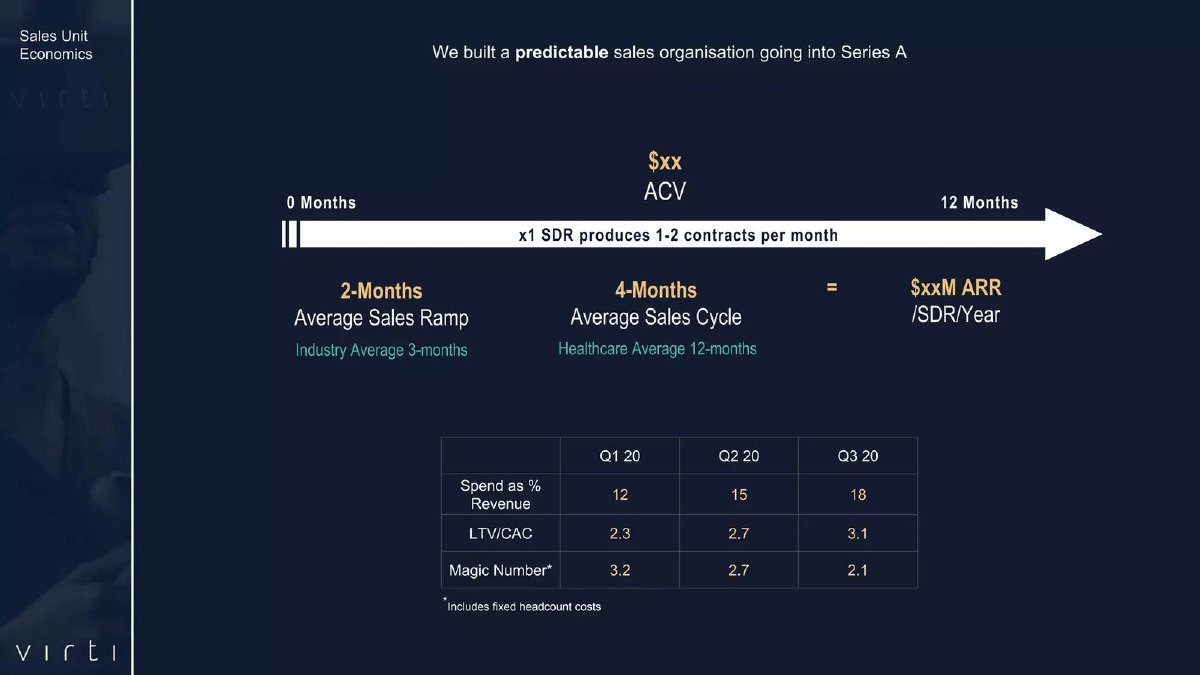
Training software sold to healthcare and enterprise customers. "Sales unit economics" slide.
Virti deck, slide 9. Exact stored slide matched to this analysis.
Our analysis: It places the cycle next to the other numbers that decide sales efficiency (rep ramp, contracts per rep, LTV/CAC), so a reader can connect a short cycle to payback.
Evidence and limitation: The healthcare and industry averages have no source, and the ACV and ARR per rep are redacted, so the claim of a cycle three times faster than the sector cannot be checked.
What a founder can adapt: Put the cycle beside rep ramp and deals per rep, and cite any benchmark you compare against.
Supporting analysis
What the deck claims: "We built a predictable sales organisation going into Series A." "2-Months Average Sales Ramp" ("Industry Average 3-months"); "4-Months Average Sales Cycle" ("Healthcare Average 12-months"); "x1 SDR produces 1-2 contracts per month"; ACV "$xx". A table for Q1–Q3 2020: spend as % of revenue 12, 15, 18; LTV/CAC 2.3, 2.7, 3.1; magic number 3.2, 2.7, 2.1.
Presentation choice: It places the cycle next to the other numbers that decide sales efficiency (rep ramp, contracts per rep, LTV/CAC), so a reader can connect a short cycle to payback.
When it does not fit: The healthcare and industry averages have no source, and the ACV and ARR per rep are redacted, so the claim of a cycle three times faster than the sector cannot be checked.
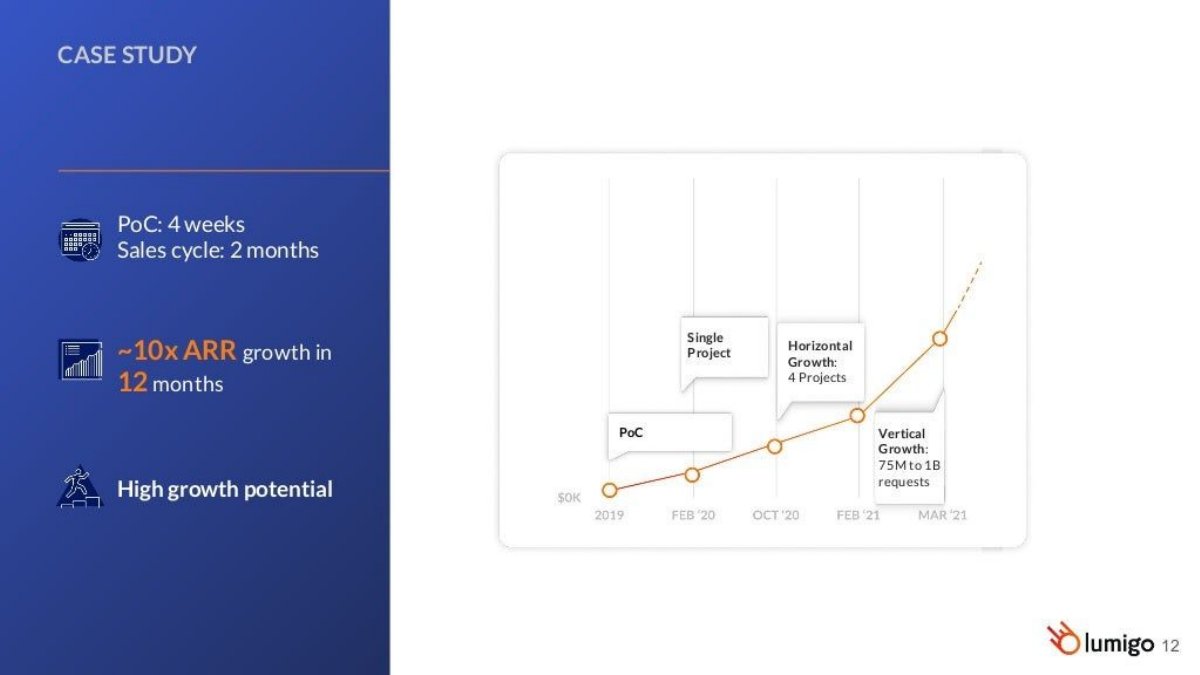
Monitoring software for cloud applications. "Case study" slide; the customer is not named.
Lumigo deck, slide 12. Exact stored slide matched to this analysis.
Our analysis: It states both the proof-of-concept length and the full cycle for one customer, then shows what happened after the sale, which connects a short cycle to expansion.
Evidence and limitation: One unnamed case is not an average cycle. The chart's revenue axis has no figures, and the slide does not say whether the proof of concept was paid.
What a founder can adapt: If you show one customer's path, give the pilot length and the time to contract, then say how typical that customer is.
Supporting analysis
What the deck claims: "PoC: 4 weeks"; "Sales cycle: 2 months"; "~10x ARR growth in 12 months"; "High growth potential". A chart runs from 2019 to March 2021 through "PoC", "Single Project", "Horizontal Growth: 4 Projects" and "Vertical Growth: 75M to 1B requests".
Presentation choice: It states both the proof-of-concept length and the full cycle for one customer, then shows what happened after the sale, which connects a short cycle to expansion.
When it does not fit: One unnamed case is not an average cycle. The chart's revenue axis has no figures, and the slide does not say whether the proof of concept was paid.
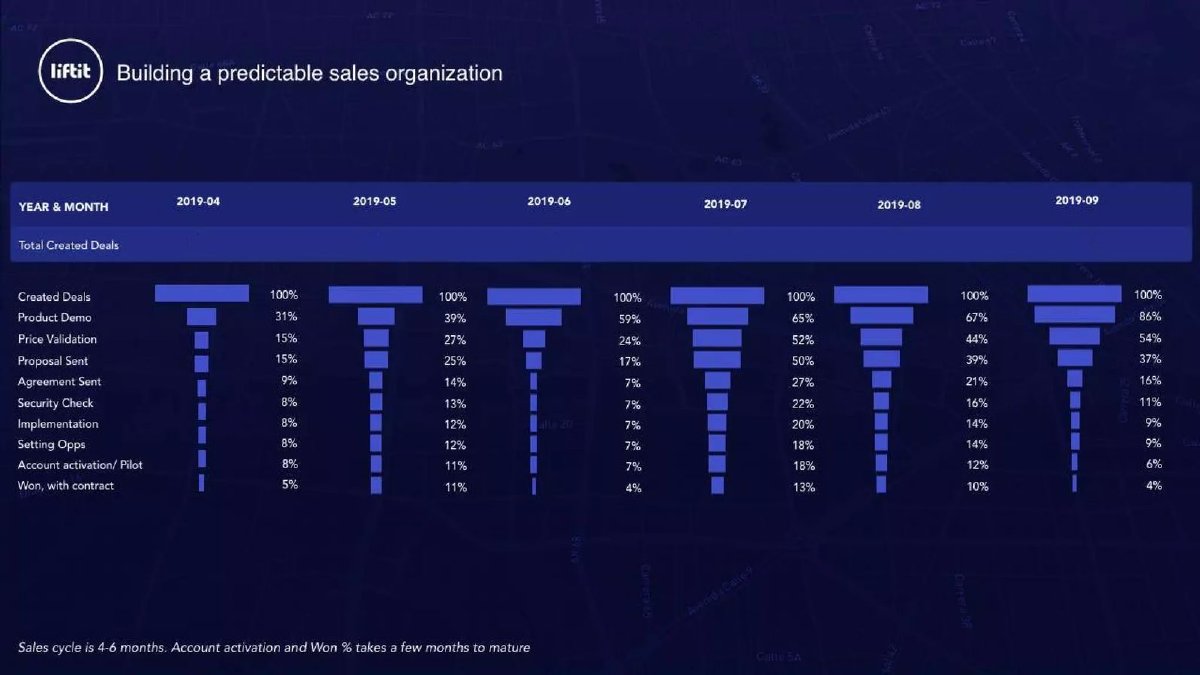
Trucking logistics platform in Latin America. "Building a predictable sales organization" slide.
Liftit deck, slide 10. Exact stored slide matched to this analysis.
Our analysis: The footnote explains why recent months look worse: with a 4-6 month cycle, deals created in August and September have not had time to close. It is a useful caution for anyone reading monthly win rates.
Evidence and limitation: The deal counts behind each 100% are not given, and the 4-6 months is stated without a basis. Early months also convert only 4-13%, so the funnel does not by itself show predictability.
What a founder can adapt: When you show conversion by month of deal creation, state the cycle length and mark which months are too recent to judge.
Supporting analysis
What the deck claims: Monthly deal funnels from April to September 2019, from "Created Deals" (100%) through "Product Demo", "Price Validation", "Proposal Sent", "Agreement Sent", "Security Check", "Implementation", "Setting Opps", "Account activation/ Pilot" to "Won, with contract" (5%, 11%, 4%, 13%, 10%, 4%). Footnote: "Sales cycle is 4-6 months. Account activation and Won % takes a few months to mature."
Presentation choice: The footnote explains why recent months look worse: with a 4-6 month cycle, deals created in August and September have not had time to close. It is a useful caution for anyone reading monthly win rates.
When it does not fit: The deal counts behind each 100% are not given, and the 4-6 months is stated without a basis. Early months also convert only 4-13%, so the funnel does not by itself show predictability.
Each cell reports only what the slide itself states. "Not stated" means the page gives no figure.
Example
Cycle stated
Split by
Pilot length
Basis given
SportID
3-4 months average
Customer size: SMEs 1-2, enterprises 6-24 months
Not stated
Not stated
Deep Render
~12 months total
Stage (each "up to"; maximums add to 15 months)
Paid proof of concept up to 6 months
Not stated; described as the process
Lattice Biologics
No total
Stage, including payment (1-3, 1-12, 1-4 months)
Not applicable
Not stated
Virti
4 months average
None; compared with "healthcare average 12 months"
Not stated
Benchmark unsourced
Lumigo
2 months
None; one customer
Proof of concept 4 weeks
One case study
Liftit
4-6 months
None; monthly funnels by deal creation month
Not stated (pilot is a funnel stage)
Not stated
Key Takeaways
Split the cycle by customer size. SportID: "SME-s 1-2 months; Enterprises – 6-24 months" tells a reader far more than its 3-4 month average.
Mark recent cohorts as immature. Liftit's footnote says win rates for the latest months will rise because its cycle is 4-6 months.
Break a long cycle into stages. Deep Render lists five stages, including "Paid Proof of concept (up to 6 months)", and a total of about 12 months.
Include the time to cash if payment lags. Lattice Biologics adds "Payment 1-4 months" after hospital approval.
Label benchmarks and single cases. Virti's "Healthcare Average 12-months" has no source; Lumigo's 4-week proof of concept and 2-month cycle describe one customer.
Write your sales-cycle line
One line per customer size or buyer. Leave a field blank rather than guess.
Segment. Which customer size or buyer does this line cover?
Stages. Each step and its length; which step is paid; when cash arrives after signature.
Length. Median or typical length, in weeks or months.
Immature cohorts. Which recent months are younger than your cycle and should not be judged yet?
Pilot. Does a pilot sit inside it? How long, and is it paid?
Copyable framework: [Segment]: [stage A x wks] → [paid pilot x wks] → [contract x wks] → [first payment x wks] = [total] (median of [n] deals); cohorts after [month] not yet mature.
Illustrative example 1 — written by us
Before: Short sales cycle
After: Small clinics: demo 1 wk → paid pilot 3 wks → contract 2 wks → first payment 4 wks = 10 wks (median of 14 deals); hospital groups: 7 months, 3 deals
What improved: Splits by size, shows the paid pilot inside the cycle and counts to cash.
What this slide has to prove
Sales-cycle length tells an investor how fast revenue can follow sales spending and how much runway a company needs before new deals pay back. A nine-month cycle on a twelve-month runway leaves little room.
The main go-to-market guide already covers choosing a buyer to shorten the cycle (BusRight: 12-18 months for schools versus 2.5 months for transportation directors), treating an unexplained reduction as a company claim (Paper: "300 days to 96 days"), and defining the cycle with its evidence. This page goes further: splitting the cycle by customer size, breaking it into stages with a paid pilot inside, counting to cash rather than signature, handling benchmarks and single cases, and reading monthly win rates against the cycle length.
What to add beyond a single number
Stages: the length of each step, which step is paid, and whether stages overlap, so the stage times reconcile with the total.
Split: by customer size or buyer type, since an average across small and large customers hides both.
Time to cash: if payment follows signature by months, add that step; a runway plan depends on cash, not contracts.
Pilot, benchmarks and cohorts: the pilot's length and whether it is paid; a source for any industry average; and which recent months are too new to judge.
Putting the cycle into a runway plan
Source facts: Deep Render gives a total of about 12 months; Lattice Biologics' steps run from physician recruitment to payment; Liftit states a 4-6 month cycle. Our calculation for Lattice Biologics: its three steps sum to 3-19 months from first contact to cash.
Practical point: a deal started on the day a round closes arrives, at best, one full cycle later. With a 12-month runway and a cycle of about 12 months, deals opened after funding may not produce cash before the money runs out, so revenue in the plan has to come mainly from deals already in progress. State how many deals are already in each stage and when each is expected to pay.
Stage totals that do not reconcile
Our calculation: Deep Render's stated stage maximums (2 + 2 + 6 + 2 + 3 months, before rollout) add up to 15 months against a stated total of about 12. The slide does not say whether stages overlap or whether the total is a typical case rather than the sum of maximums. That is missing information, not a proven error, but a reader will notice it.
Recommendation: if your stages can run in parallel, say so, or give the typical length of each stage alongside its maximum so that the typical lengths add up to the stated total.
Sales hiring and cycle length
Source facts: SportID plans to move from 0.5 sales reps in 2014 to 16 in the EU by December 2016, and gives enterprise cycles of 6-24 months. Virti states a 2-month rep ramp, a 4-month cycle and 1-2 contracts per SDR per month, but blanks its contract value as "$xx".
Practical point: a rep hired to sell to enterprises with a cycle of up to 24 months may not close a first deal for a long time after joining. When a plan adds reps quickly, show the ramp and cycle together, so a reader can see when each new rep is expected to produce revenue. Without a contract value, as on Virti's slide, revenue per rep cannot be estimated.
Reading recent months fairly
Source facts: Liftit's monthly win rates from April to September 2019 are 5%, 11%, 4%, 13%, 10% and 4%, with a note that wins take a few months to mature. With a 4-6 month cycle, the latest months shown have had the least time to close, so their lower rates may still rise. Recommendation: report win rates by the month a deal was created and mark which months are still open, as Liftit's footnote does in words.
Common mistakes
One average across all customers. Small and large deals average into a number that describes neither.
No start or end point. Time to signature and time to payment can differ by months.
Stages that don't add up. If stage maximums exceed the total, say whether the stages overlap.
Unsourced benchmarks. "Industry average" needs a source, or it reads as a claim.
A single case as the norm. One fast customer is a case study, not your cycle.
Diagnostic checklist
The cycle is split by customer size where they differ.
Stage times reconcile with the total, and time to first payment is included.
The number rests on a stated count of closed deals, or is labelled an estimate.
Any pilot inside the cycle has a length and says whether it is paid.
Benchmarks have a source; single cases are labelled as such.
Frequently asked questions
Should I show the sales cycle if it is long?
The slides here suggest stating it with its stages (Deep Render, Lattice Biologics) so a reader can see where the time goes. Leaving it out does not stop an investor from asking.
How long should a pilot be?
These slides cannot answer that. The two that state a length give 4 weeks (Lumigo, one customer) and up to 6 months (Deep Render, a paid proof of concept for licensing technology).
How we chose these examples
Search (2026-09-30): the durable corpus index (docs/seo/artifacts/corpus-search, 70,729 unique pages across every deck page, deduplicated by deck-file sha256 + page) was searched for "sales cycle" (81 pages) and for pilot or proof-of-concept lengths in days, weeks or months (56 pages).
Twelve pages were rendered from the original public deck files; these six were read against the text and used: SportID 20, Deep Render 35, Lattice Biologics 10, Virti 9, Lumigo 12, Liftit 10. All are founder pitch decks from public sources recorded in our deck inventory (SportID, Lattice Biologics, Virti, Lumigo, Liftit: SlideShare; Deep Render: Business Insider).
Left out: BusRight 2 and Paper 8 (already analysed in the main go-to-market guide), CEMATRIX 22 (a listed company's investor presentation), Humaans, Goodcarbon, Tive and Superlegal (cycle figures redacted as x), Mio Marketplace 4 (a market statistic, not the company's cycle), and one-line mentions such as "short sales cycle" with no figure.
How we built this: drafted and checked with AI assistance (editorial model review against the original slide images); no human editor has reviewed this guide.