Bubble raised $100M in 2021 using a 22-slide deck that emphasizes the shift from limited-use no-code tools to a general-purpose software development platform. The deck is notable for its heavy reliance on community metrics and user success stories, such as startups raising millions after building on the platform. While it redacts specific ARR figures, the visual data clearly shows a 3X year-over-year growth trajectory and negative net revenue churn. The narrative moves from the 'universal bottleneck' of engineering resources to Bubble’s unique positioning as a high-flexibility, high-capabilit…
Key takeaways
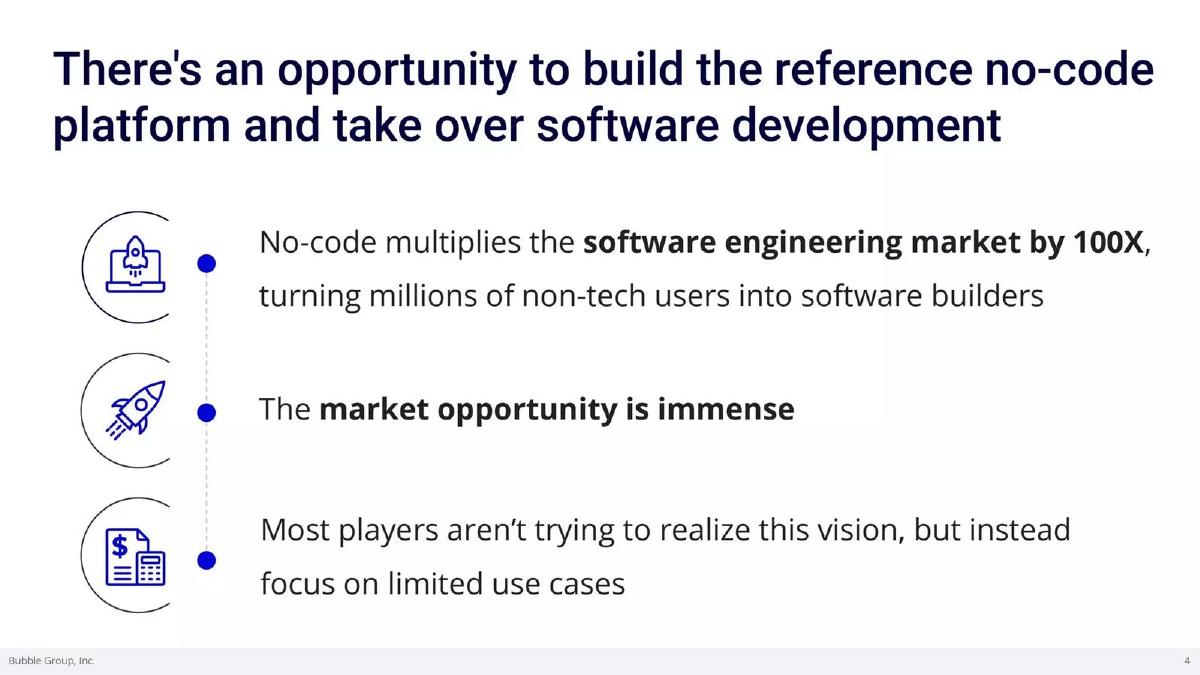
- Bubble positions no-code as a 100X multiplier for the software engineering market on slide 4.
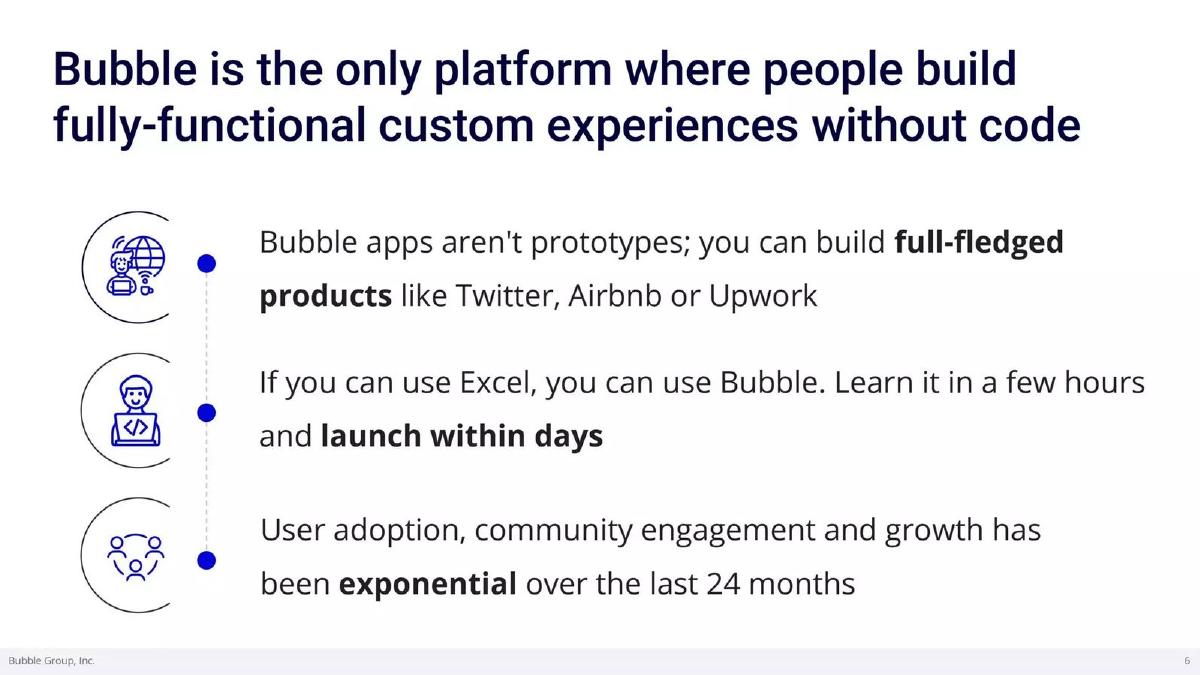
- The platform claims to allow users to build full-fledged products like Twitter or Airbnb, moving beyond simple prototypes (slide 6).
- Monthly net revenue churn has been negative since the beginning of 2021, a key indicator of product-market fit (slide 7).
- The user base is predominantly non-technical, with 34% having never built anything online before (slide 8).
- Community engagement is a core pillar, with over 500 posts per day and 130+ listed agencies (slide 10).
- The competitive landscape on slide 14 places Bubble in a 'unique sweet spot' of high flexibility and high no-code accessibility.
- Bubble identifies scalability as a primary reason for high-end churn and requests resources to solve it (slide 18).
- The deck highlights a 42% decrease in Google CAC between November 2020 and March 2021 (slide 19).
The Vision: Software Development Without Code
Slides 1-3: The Macro Thesis
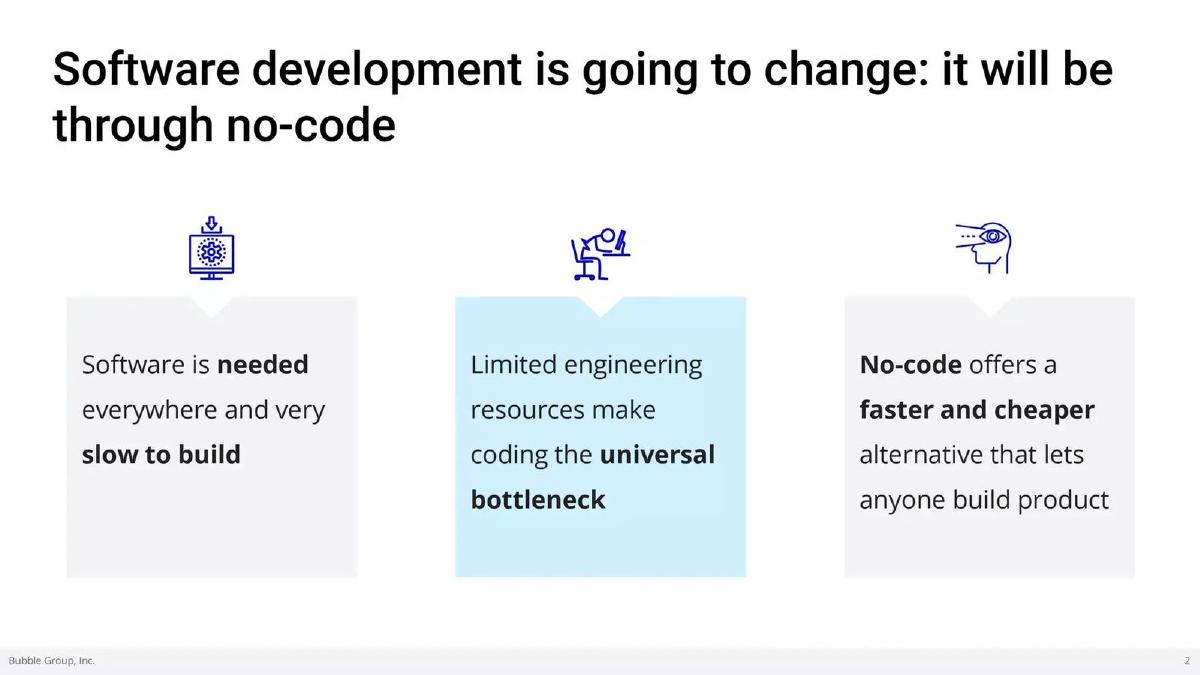
Bubble opens with a bold title: "Taking over Software Development Through No-Code" (Slide 1). This sets a high-stakes tone immediately. Slide 2 defines the problem: software is slow to build, and limited engineering resources create a "universal bottleneck." The solution presented is not just a tool, but a paradigm shift where "anyone" can build product. Slide 3 introduces the "true vision": using engineers for technical innovation rather than "reinventing the wheel." This is a strategic framing designed to appeal to VCs who understand the high cost and scarcity of developer talent.
Slides 4-6: The Opportunity and Product Positioning
Slide 4 claims that no-code multiplies the software engineering market by 100X . This is a classic TAM (Total Addressable Market) expansion argument. Slide 5 acts as a transition, stating Bubble is "best positioned to grab this opportunity." Slide 6 differentiates Bubble from competitors by asserting that Bubble apps are not just prototypes, but "full-fledged products like Twitter, Airbnb or Upwork." This is a critical distinction in the no-code space, where many tools are limited to simple landing pages or internal forms. The slide also includes a powerful ease-of-use claim: "If you can use Excel, you can use Bubble."
Slides 7-10: Traction and Community Proof
Slide 7 is the primary traction slide. While the specific ARR is redacted as "$XXm" , the chart shows consistent month-over-month growth from January 2020 to March 2021. Key metrics mentioned include 3X y/y growth , users paying between $25/mo to $8k/mo , and the highly desirable negative monthly net revenue churn . Slide 8 profiles the user: 34% have never built anything online, and 70% of applications are customer-facing. Slide 9 provides social proof through "User Stories," highlighting companies like Cuure (raised €1.8m) and Teal (raised $5m) that were built on Bubble. Slide 10 focuses on the "fanatic" community, citing a Paid NPS > 70 and an ecosystem of 130+ agencies and 100+ bootcamp students per month. This suggests a moat built on user loyalty and third-party services.
Slides 11-14: Strategy and Competition
Slide 11 and 12 pivot to the "Winning the no-code space through startups" strategy. Bubble argues that startups provide the best PR and that enterprises will eventually adopt the tools their employees already know (a bottom-up SaaS motion). Slide 14 is the competitive landscape. It uses a 2x2 matrix with "Low-code vs. No-code" on the X-axis and "Narrow vs. Wide breadth of capabilities" on the Y-axis. Bubble places itself in the top-right quadrant—the only tool that is both fully no-code and has a wide breadth of capabilities. Competitors like Retool, Mendix, Zapier, Airtable, and Webflow are all positioned as having either narrower capabilities or requiring more code.
Slides 15-19: The Roadmap for Acceleration
Slide 15 introduces the "additional funding" section. Slide 16 projects growth to "$XXm by EO2021" and identifies that they are currently growing 8-12% m/m without full optimization. Slide 17 uses a cohort analysis chart to show that recent improvements in documentation and training have already increased conversion to paid by 70% in February . Slide 18 is an honest assessment of weaknesses: they need to invest in technology to prevent high-end churn (scalability) and improve ease-of-learning. They estimate these two fixes alone could unlock an additional 4% of monthly ARR growth . Slide 19 focuses on brand and acquisition, noting that 45% of users are currently earned media and that Google CAC has decreased 42% recently.
Slides 20-22: Team and The Ask
Slide 20 introduces the team, led by founders Josh Haas and Emmanuel Straschnov. It highlights their longevity (working together since 2012) and their backgrounds (Harvard, Bridgewater, etc.). The slide also breaks down the company by department: Product & Engineering (15 people), Growth (7 people), Success (12 people), and Operations (3 people). Slide 21 delivers the final pitch: Bubble is seeking a lead investor to become a "household name" alongside Amazon, Google, and Microsoft. Slide 22 is a simple thank you.
What Works in the Bubble Deck
The "Not a Prototype" Narrative: By explicitly naming complex platforms like Twitter and Airbnb as buildable on Bubble, the deck overcomes the biggest objection to no-code: that it is only for MVPs. This positioning is essential for a Series A raise where investors are looking for long-term platform viability.
Negative Net Revenue Churn: Mentioning negative churn on Slide 7 is a massive signal for VCs. It proves that as customers grow, they spend more on Bubble than the revenue lost from customers who leave. This is the hallmark of a healthy SaaS business.
Honesty About Scalability: Slide 18 is particularly effective. Instead of pretending the product is perfect, Bubble identifies exactly why customers leave (scalability) and frames the fundraise as the solution to that specific problem. This builds trust and provides a clear "use of proceeds" narrative.
What is Missing from the Bubble Deck
Specific Financials: While this is a public version of the deck, the redaction of ARR and net burn makes it difficult to assess the actual efficiency of the business. However, the growth curves and percentage-based metrics (3X y/y) provide enough context to understand the trajectory.
Unit Economics: There is very little mention of LTV (Lifetime Value) or detailed payback periods. While Slide 19 mentions a 42% decrease in CAC, it doesn't provide the absolute numbers needed to calculate the LTV/CAC ratio, which is a standard requirement for Series A diligence.
Enterprise Strategy: While Slide 12 mentions that enterprises will adopt the tool through employee buy-in, the deck lacks a detailed plan for how Bubble will handle enterprise-grade security, compliance, or seat-based management, which are usually required to reach the "Amazon/Microsoft" levels of scale they claim to target.
Founder's Playbook: What to Copy
The Cohort Improvement Chart: Slide 17 is a masterclass in showing product-led growth. By showing that each successive cohort (Aug 20, Sep 20, etc.) converts to paid faster than the last, Bubble proves they are actively learning and improving the product experience. Founders should use this to show momentum even if their absolute numbers are still early.
Ecosystem as a Moat: Bubble doesn't just sell software; they sell an ecosystem. Highlighting the number of agencies and bootcamps (Slide 10) shows that there is a secondary market of people making a living off the platform. This makes the platform much harder to displace than a standalone tool.
The "Bottleneck" Problem Statement: Starting with a macro problem that everyone understands (developers are expensive and slow) and then positioning your product as the only way to break that bottleneck is a highly effective way to frame a pitch. It moves the conversation from "features" to "market necessity."
Frequently asked questions
- How much did Bubble raise with this deck?
- According to the catalogue facts, Bubble raised $100M in a Series A round in 2021. The deck itself focuses on the vision and growth levers required to reach this milestone, though it redacts the specific dollar amounts for ARR and net burn.
- What is Bubble's core value proposition to investors?
- Bubble argues that traditional coding is a 'universal bottleneck' (slide 2). Their value proposition is that they offer the only no-code platform flexible enough to build 'fully-functional custom experiences' rather than just prototypes, effectively expanding the pool of software builders by 100X.
- Who are Bubble's primary users according to the deck?
- The deck specifies that users are non-technical business professionals. Specifically, 33% are business owners or executives, and 27% work in Marketing, Sales, or Ops. Only 15% of their users come from traditional Software, Design, or Product backgrounds (slide 8).
- How does Bubble handle the 'scalability' criticism of no-code?
- Bubble addresses this head-on in slide 18. They admit that some 'bigger apps leave because of scalability' but claim these users 'really don’t want to leave.' They frame this as a primary reason for the fundraise: to invest in technology that supports startups through to an IPO.
- What are the key growth levers identified for the Series A?
- Slide 16 and 19 outline four levers: reducing high-end churn via technical investment, improving ease-of-learning to boost conversion, scaling brand awareness through partnerships/education, and continuing profitable paid acquisition (where CAC dropped 42%).