Organic Growth and Referrals on a Pitch Deck: Organic Share
How startups claim organic, word-of-mouth and referral growth on a pitch deck: what counts as organic, the share of which users or revenue, the period.
How to Show Organic and Referral Growth on Your Pitch Deck So Investors Can Check It
Fourteen slides from real pitch decks that claim organic, word-of-mouth or referral growth. For each, we record what the slide says, what "organic" is a share of, whether a period and base are given, whether spend was really absent, and whether the figures agree with each other.
TL;DR
"Organic" growth means customers who arrived without paid acquisition: search, word of mouth, referrals, press or a product that spreads by use. Investors care because organic demand suggests the product pulls people in and that paid spend can be added on top rather than carrying the whole business. But the word is loose. A useful claim answers four questions: organic share of what (installs, sign-ups, paying users, revenue), over what period, how organic is defined (does it include SEO content, influencer gifts, a partner's recommendation?), and what was spent on marketing at the same time.
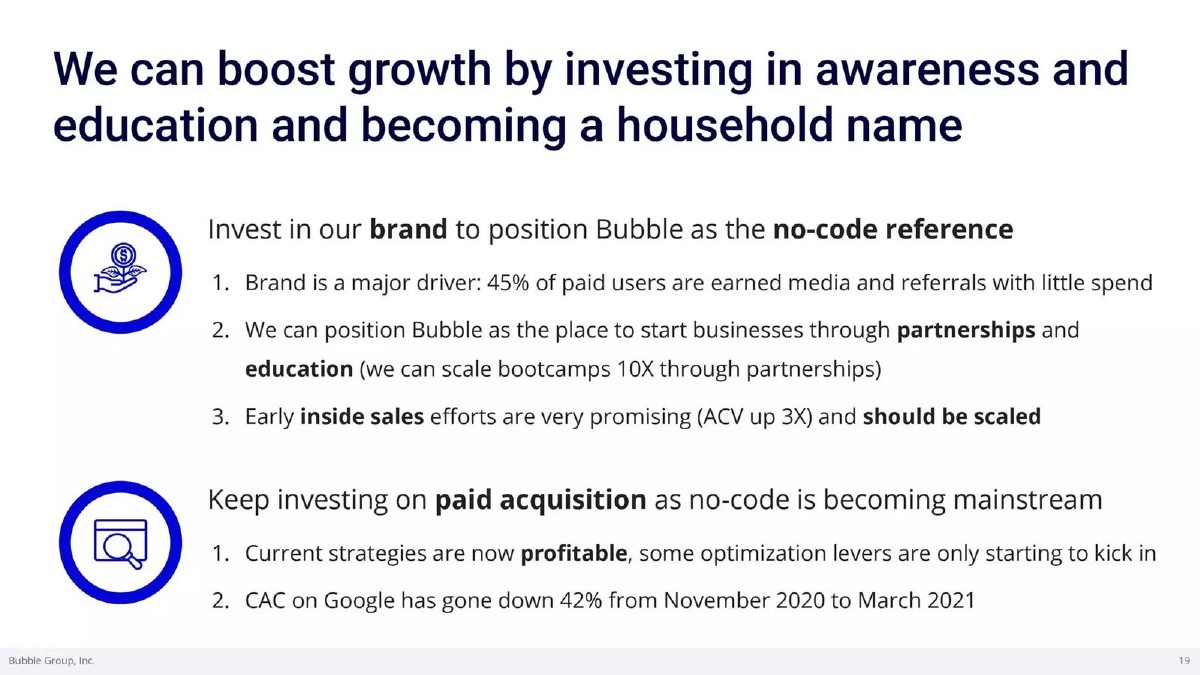
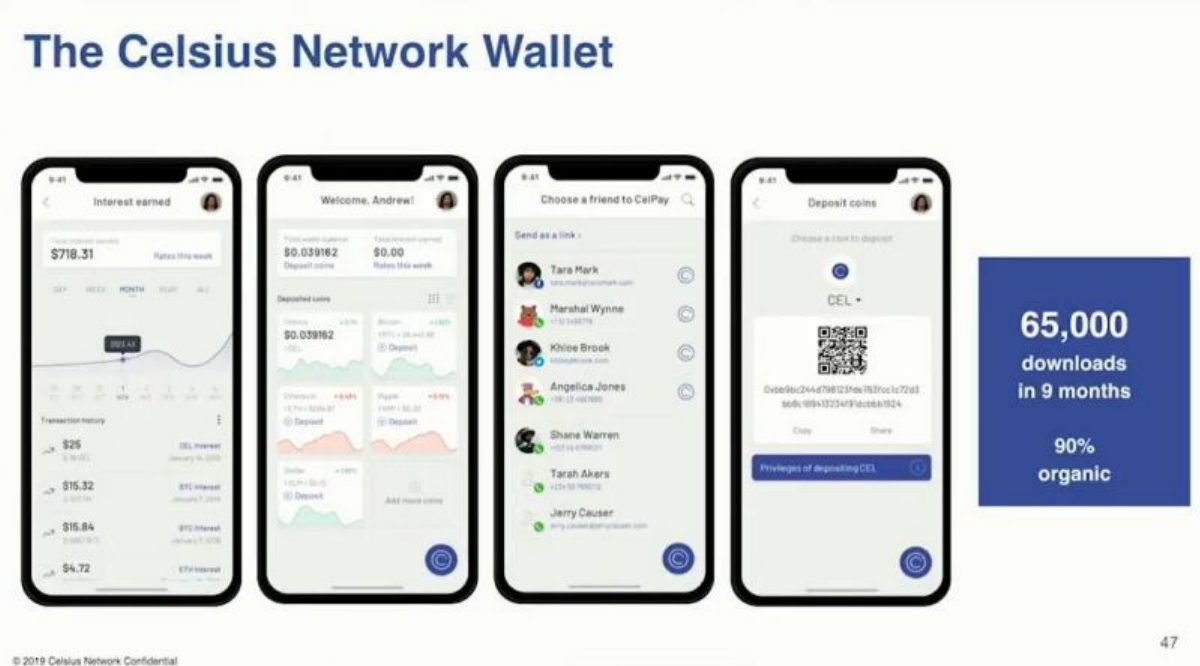
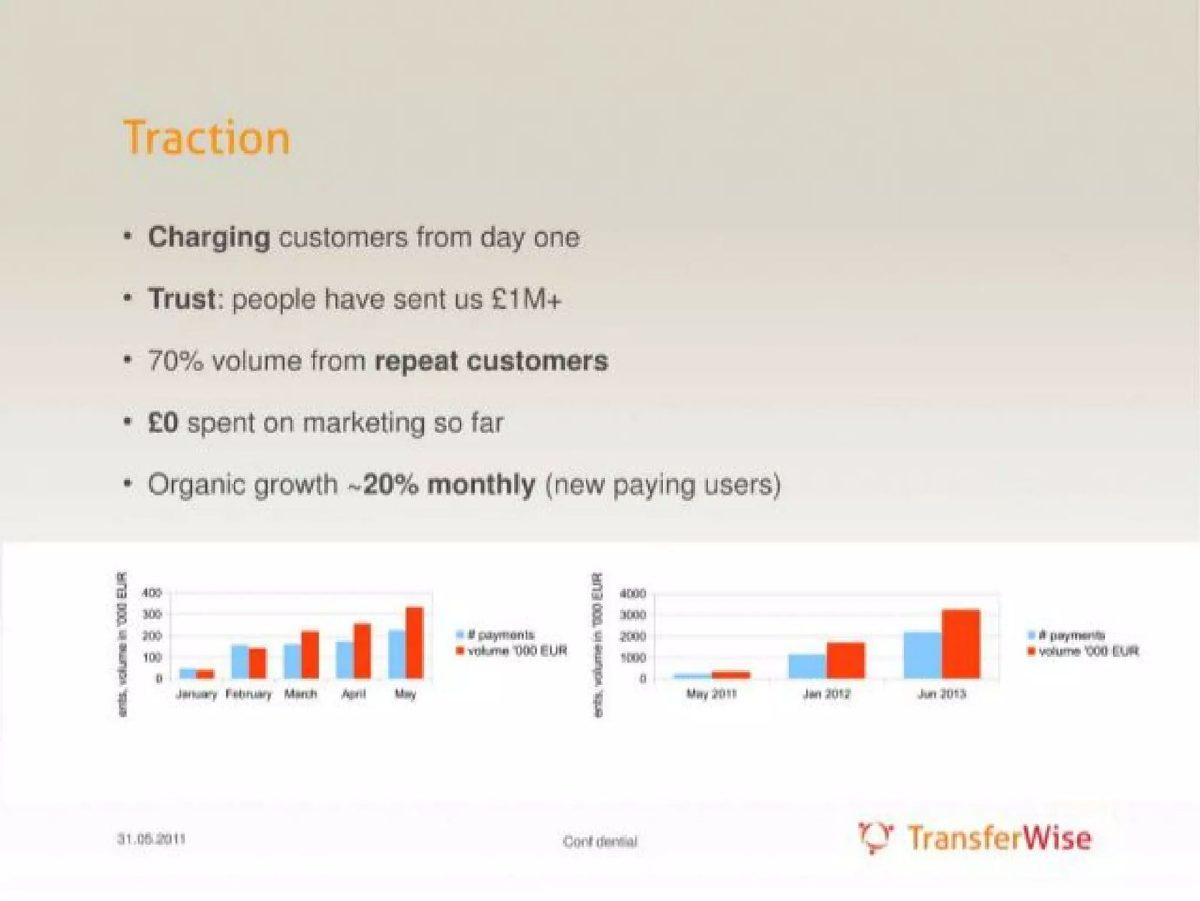
In this set, Bubble ties its figure to paying users: 45% came from earned media and referrals. Celsius Network gives a count and a period: 65,000 downloads in 9 months, 90% organic, which is about 58,500 organic downloads (our calculation). TransferWise pairs "£0 spent on marketing so far" with about 20% monthly organic growth in new paying users, which would compound to about 8.9x in a year if sustained (our calculation). Flo's own slide splits traffic three ways. At the other end, api.video's "100% organic" chart has no values and its conversion boxes read "-,-%"; Cleary names referrals as the main driver without a share; and Tappa's "organic growth" happened while it still spent $116k on user acquisition.
Organic and referral growth slides from real pitch decks
Each example records the exact slide, what it states, what the organic figure is a share of, and what an investor would still ask. Checks and conversions are our calculations.
Bubble go to market slide — slide 18
No-code app builder. Growth plan slide; date not stated on the page.
Bubble deck, slide 18. Exact stored slide matched to this analysis.
Our analysis: The strongest base in this set: customers, not visits, beside a paid channel whose cost is falling.
Evidence and limitation: Organic share measured on paying users. Our calculation: the other 55% of paid users came from sources the slide does not break down.
What a founder can adapt: Add the period and the number of paid users.
Supporting analysis
What the deck claims: "45% of paid users are earned media and referrals with little spend"; paid acquisition "now profitable"; Google CAC down 42% from November 2020 to March 2021.
Presentation choice: It shows organic demand where it matters, among people who pay.
When it does not fit: Don't give an organic share of traffic when you can give it for paying users.
International money transfer. Traction slide dated 31 May 2011.
TransferWise deck, slide 4. Exact stored slide matched to this analysis.
Our analysis: Zero spend makes the organic claim hard to dispute; the missing user count leaves the base unknown.
Evidence and limitation: Unit, rate and spend all stated. Our calculation: 20% a month compounds to about 8.9x in a year if sustained. The June 2013 chart is a projection.
What a founder can adapt: Add the number of paying users so the 20% has a base.
Supporting analysis
What the deck claims: "£0 spent on marketing so far"; "Organic growth ~20% monthly (new paying users)"; "70% volume from repeat customers"; "people have sent us £1M+".
Presentation choice: Spend beside growth is the clearest proof that growth is organic.
When it does not fit: Don't mix projected bars with actual ones without a label on the chart itself.
Period-tracking app. Past-quarter iOS traffic in the US.
Flo deck, slide 22. Exact stored slide matched to this analysis.
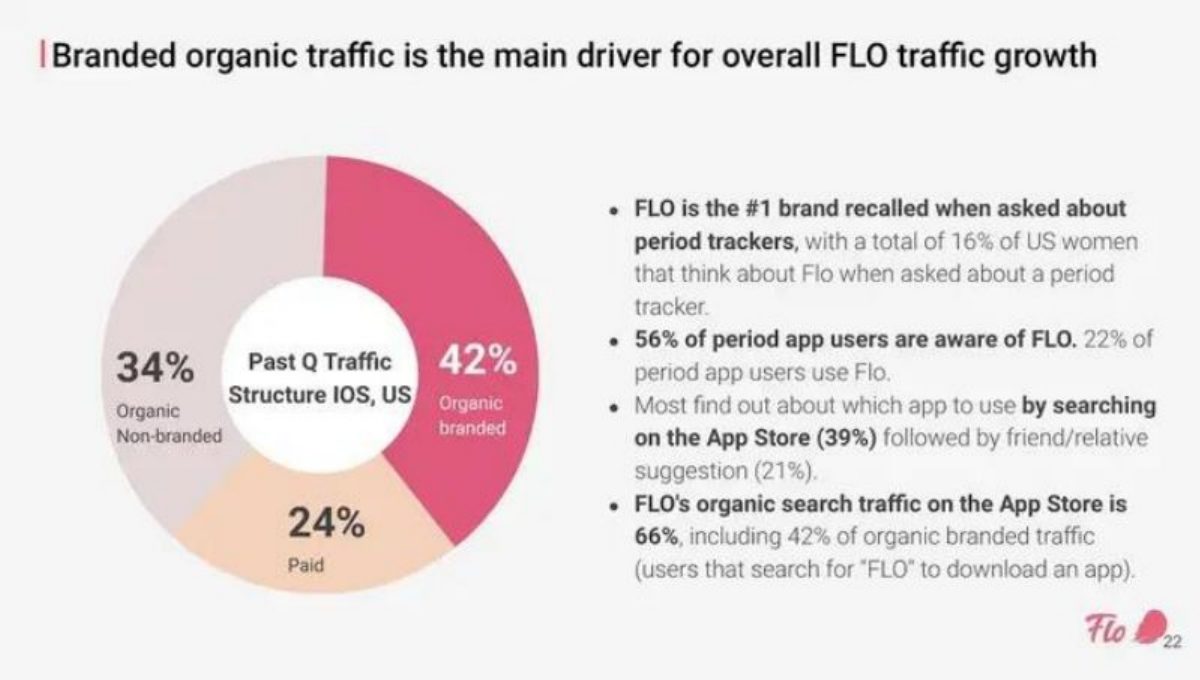
Our analysis: Splitting branded from non-branded organic isolates word of mouth, but the two organic totals need reconciling.
Evidence and limitation: Our calculation: the pie's organic slices add to 76%, not the 66% in the bullet; the slide does not explain the different bases.
What a founder can adapt: Label the base of each percentage so the totals agree.
Supporting analysis
What the deck claims: Traffic split: 42% organic branded, 34% organic non-branded, 24% paid; "FLO's organic search traffic on the App Store is 66%, including 42% of organic branded traffic".
Presentation choice: Branded search is people who already know the name, the clearest word-of-mouth signal.
When it does not fit: Don't show two organic shares on one slide without saying what each covers.
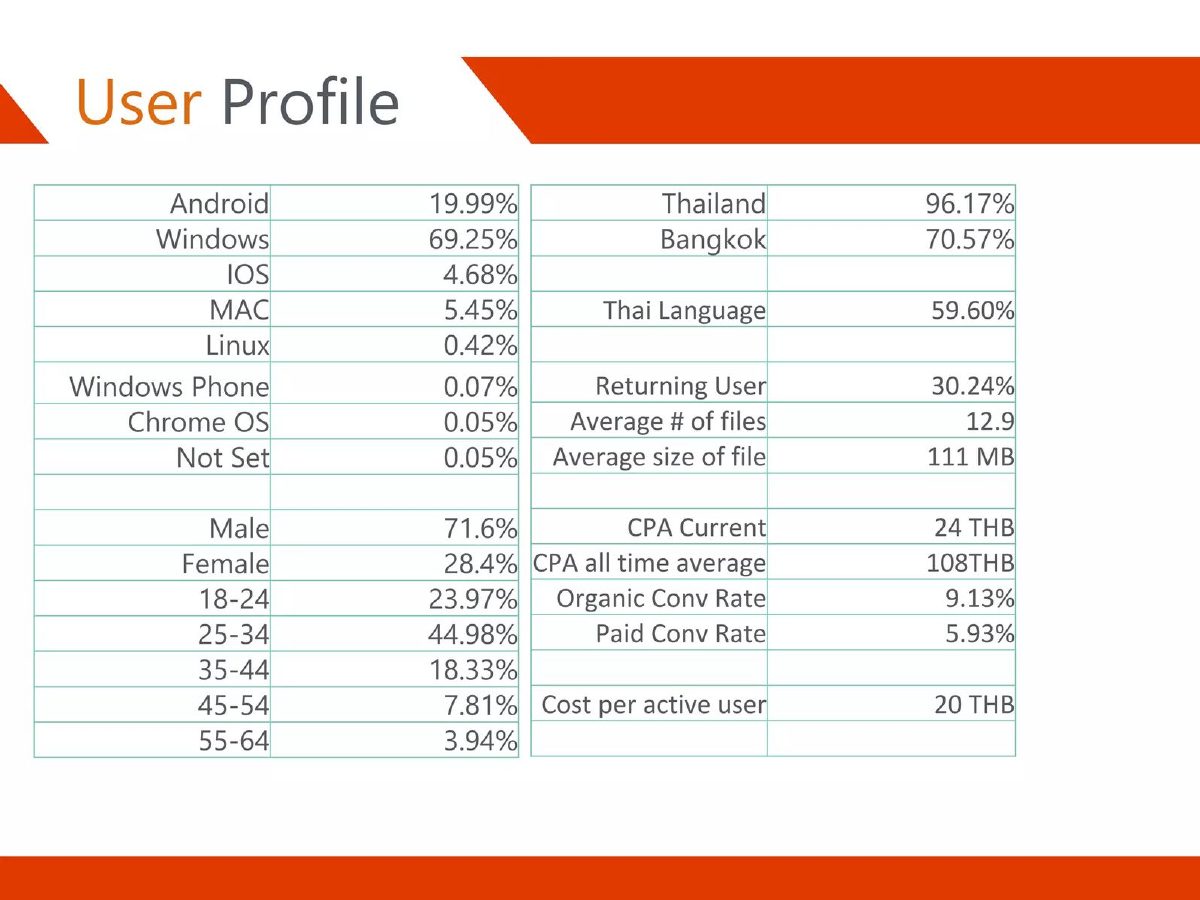
Chotmai deck, slide 15. Exact stored slide matched to this analysis.
Our analysis: Organic and paid are compared on the same measure, but the organic share of users is missing.
Evidence and limitation: Our calculations: organic converts about 1.5 times as often as paid; current CPA is about 78% below the all-time average.
What a founder can adapt: Add the share of new users from each source.
Supporting analysis
What the deck claims: "Organic Conv Rate 9.13%", "Paid Conv Rate 5.93%", "CPA Current 24 THB", "CPA all time average 108THB", "Cost per active user 20 THB".
Presentation choice: Side-by-side rates are more honest than a lone organic headline.
When it does not fit: Don't show a better organic rate without saying how much traffic it applies to.
Video API for developers. Growth slide, chart July 2020 to December 2021.
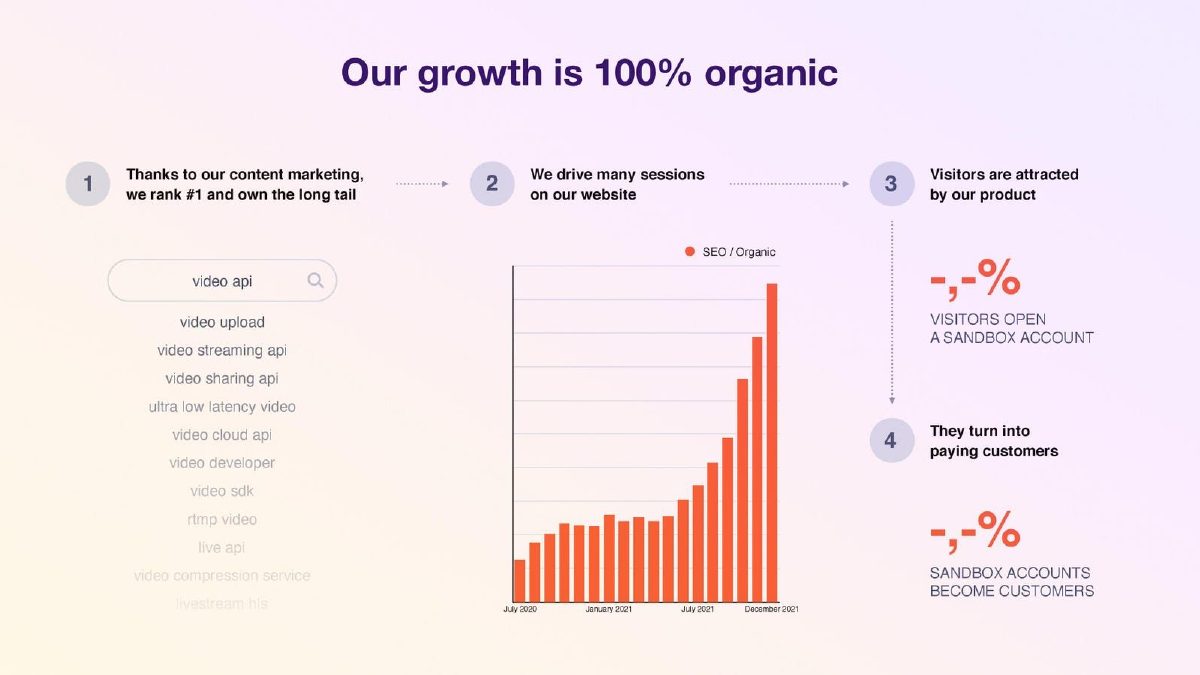
api.video deck, slide 10. Exact stored slide matched to this analysis.
Our analysis: The path is well explained, but nothing on the slide can be measured.
Evidence and limitation: The chart has no axis values and both conversion rates are blank placeholders.
What a founder can adapt: Fill in the sessions axis and both conversion rates, and state content spend.
Supporting analysis
What the deck claims: "Our growth is 100% organic"; content marketing ranks #1 for search terms; an "SEO / Organic" sessions chart; sandbox and customer conversion boxes reading "-,-%".
Presentation choice: It defines organic (search earned by content) but gives no numbers.
When it does not fit: Don't leave placeholders on a slide you send to investors.
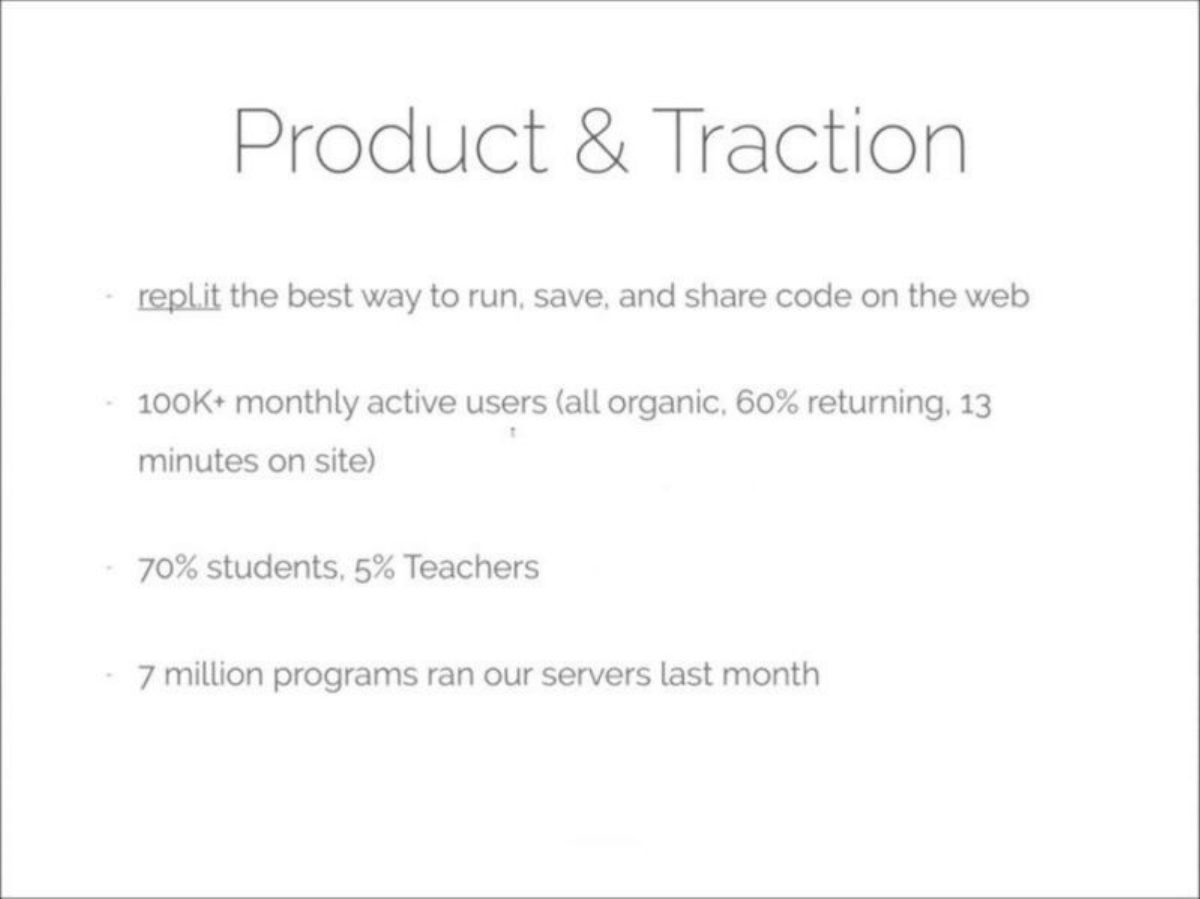
Replit deck, slide 10. Exact stored slide matched to this analysis.
Our analysis: Engagement beside the organic claim shows people came back, not just arrived.
Evidence and limitation: Count and monthly period given; returning share and time on site support the organic claim.
What a founder can adapt: Add a growth rate and what organic covers.
Supporting analysis
What the deck claims: "100K+ monthly active users (all organic, 60% returning, 13 minutes on site)"; "70% students, 5% Teachers"; "7 million programs ran our servers last month".
Presentation choice: An organic claim is more believable next to evidence of repeat use.
When it does not fit: Don't rely on "all organic" without the engagement that backs it.
Employee experience software. ARR chart Q1 2021 to Q3 2022.
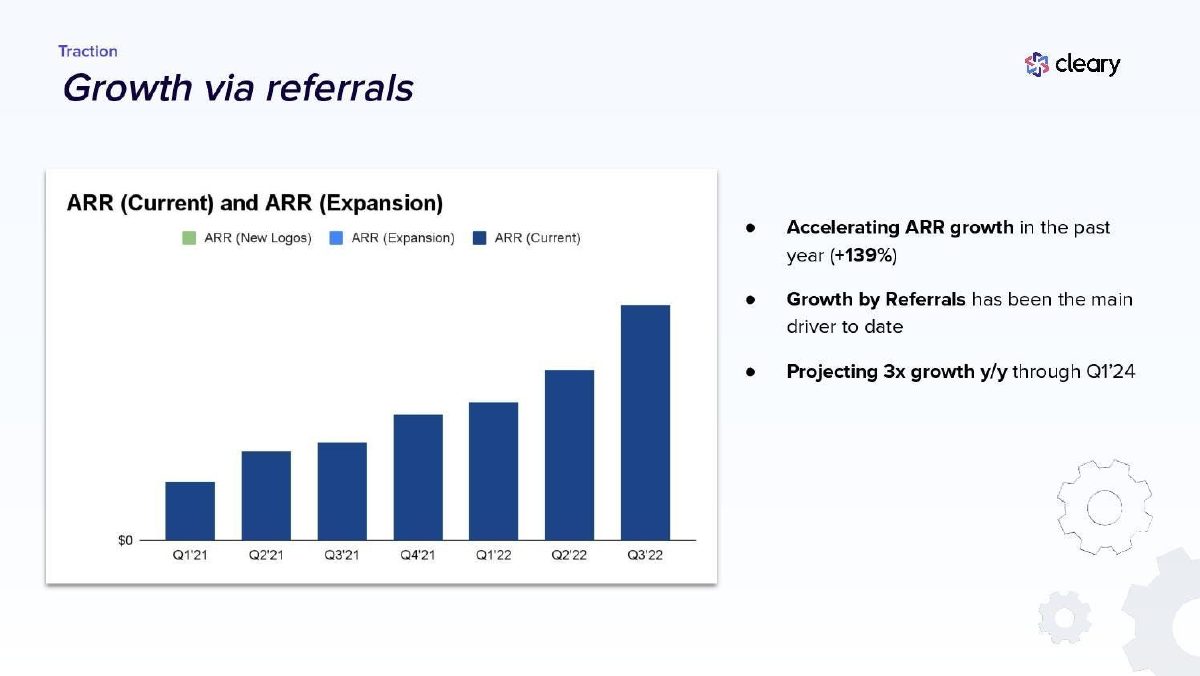
Cleary deck, slide 12. Exact stored slide matched to this analysis.
Our analysis: Referrals are named as the driver without a number.
Evidence and limitation: Our calculation: +139% is about 2.4x in a year. No referral share, no ARR values, legend colours not distinguishable.
What a founder can adapt: Give referrals' share of new ARR and split the bars as the legend promises.
Supporting analysis
What the deck claims: "Growth via referrals"; "Accelerating ARR growth in the past year (+139%)"; "Growth by Referrals has been the main driver to date"; "Projecting 3x growth y/y through Q1'24".
Presentation choice: The headline claims a channel the chart cannot show.
When it does not fit: Don't title a slide with a channel you do not quantify.
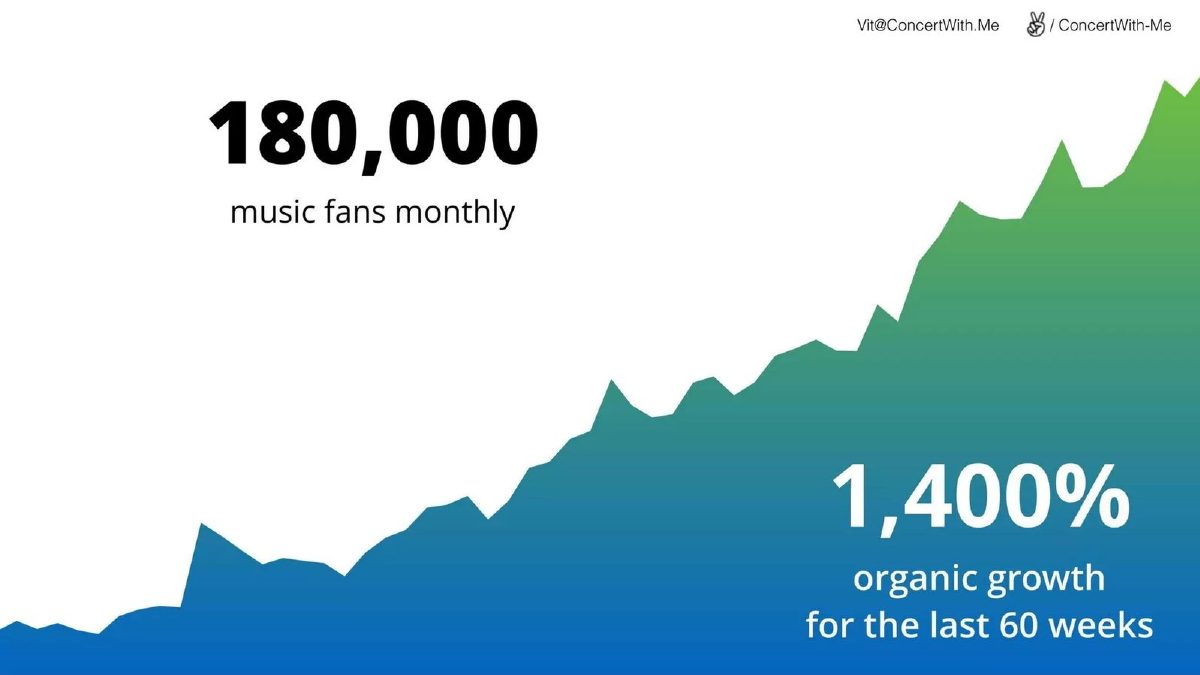
Concert With Me deck, slide 10. Exact stored slide matched to this analysis.
Our analysis: Large growth with no starting count, measure or definition.
Evidence and limitation: Our calculations: 15x in 60 weeks, about 4.6% a week compounded; a start of about 12,000 if the same monthly measure grew (not stated).
What a founder can adapt: Show start and end counts and the measure that grew.
Supporting analysis
What the deck claims: "180,000 music fans monthly"; "1,400% organic growth for the last 60 weeks"; a rising chart with no axis.
Presentation choice: A growth percentage cannot be checked without its base.
When it does not fit: Don't give a growth percentage without the starting number.
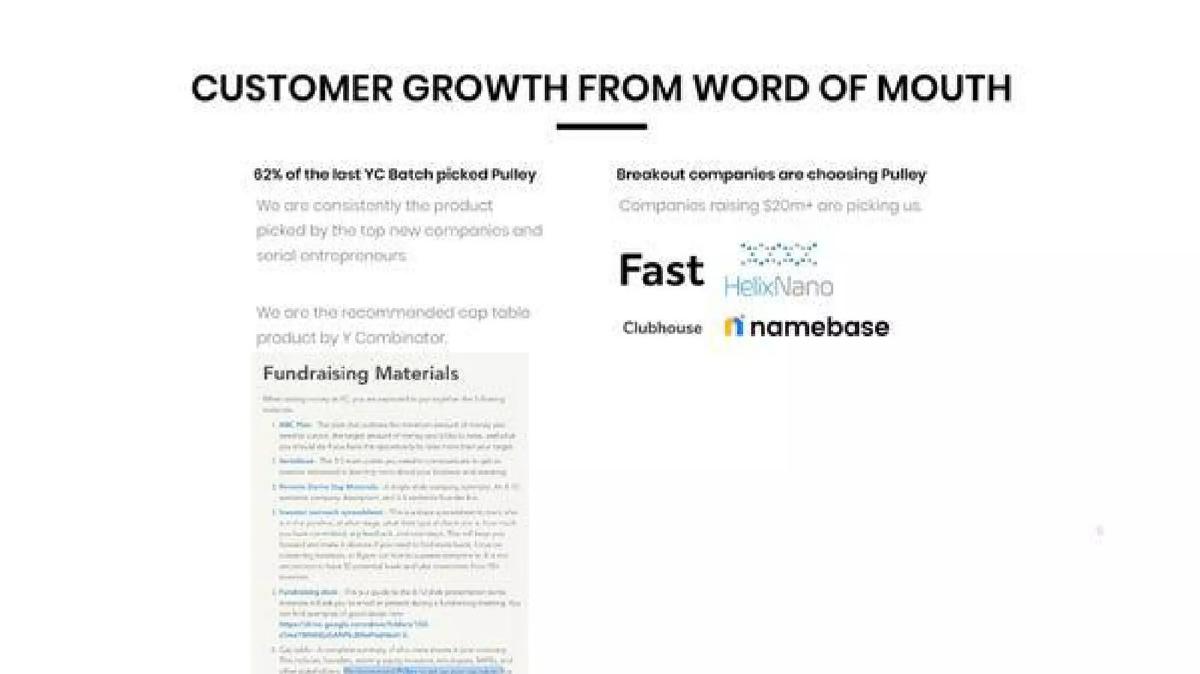
Pulley deck, slide 6. Exact stored slide matched to this analysis.
Our analysis: An accelerator recommendation is a channel, not customer-to-customer word of mouth.
Evidence and limitation: Adoption within one batch is stated; batch size and Pulley's total customers are not.
What a founder can adapt: Separate customers from the recommendation from those referred by customers.
Supporting analysis
What the deck claims: "Customer growth from word of mouth"; "62% of the last YC Batch picked Pulley"; "Companies raising $20m+ are picking us"; "the recommended cap table product by Y Combinator".
Presentation choice: The evidence supports adoption; it does not isolate word of mouth.
When it does not fit: Don't label a partner channel as word of mouth.
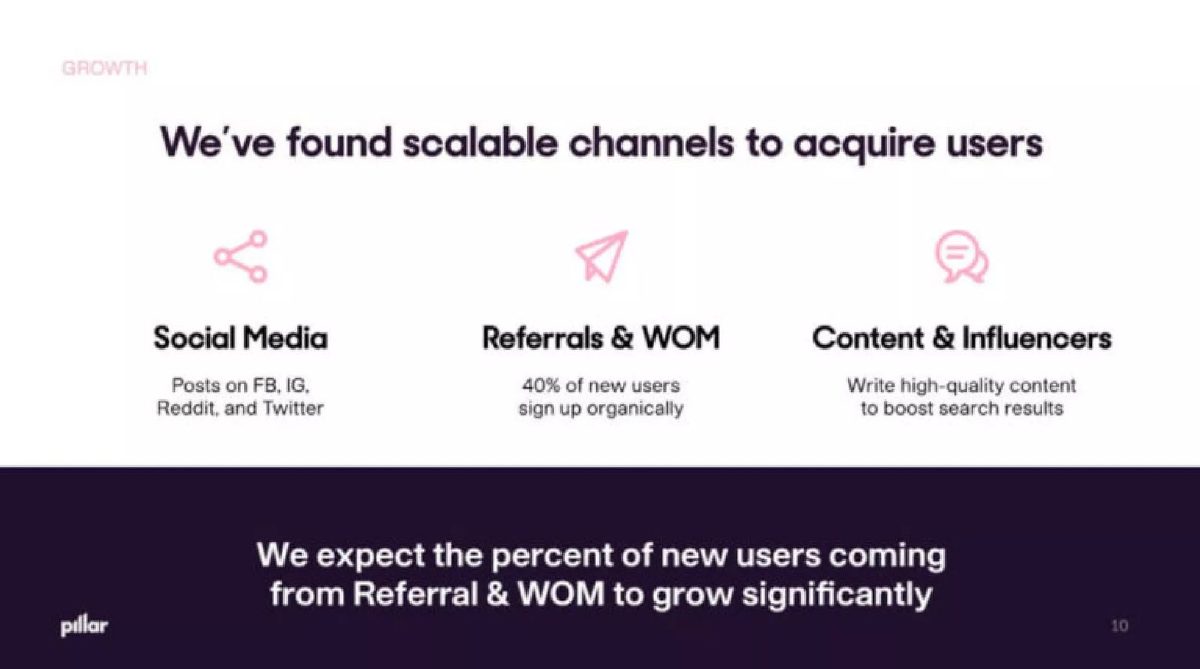
Pillar deck, slide 10. Exact stored slide matched to this analysis.
Our analysis: A clear base with no period, and a forecast with no reason.
Evidence and limitation: Base is new users; no period, count or definition of which channels count as organic.
What a founder can adapt: Add the month and count, and say what drives the expected rise.
Supporting analysis
What the deck claims: Social Media, Referrals and WOM ("40% of new users sign up organically"), Content and Influencers; "We expect the percent of new users coming from Referral & WOM to grow significantly".
Presentation choice: New users is a sound base, but the figure needs a time frame.
When it does not fit: Don't forecast a channel's growth without naming the lever.
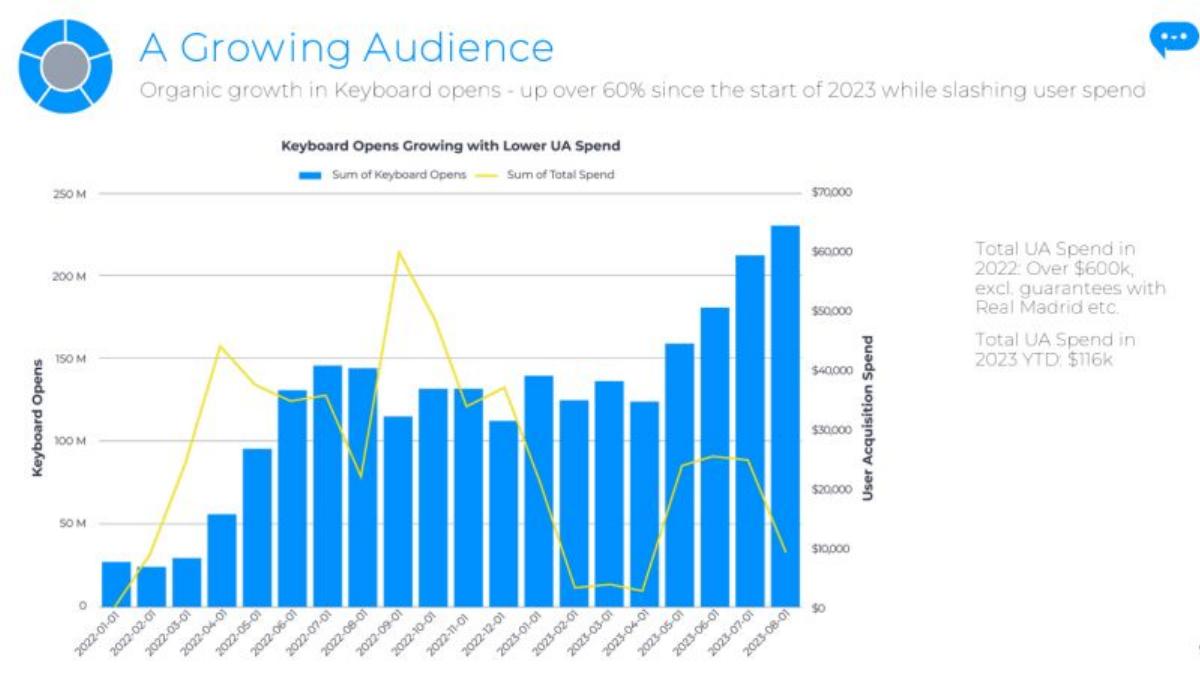
Branded keyboard app. Monthly keyboard opens and user acquisition spend, 2022 to 2023.
Tappa deck, slide 4. Exact stored slide matched to this analysis.
Our analysis: Growth during lower spend, not growth without spend.
Evidence and limitation: Spend is printed beside the growth, but it fell rather than stopped.
What a founder can adapt: Say "growth while spend fell 80%" or separate paid from unpaid opens.
Supporting analysis
What the deck claims: "Organic growth in Keyboard opens - up over 60% since the start of 2023 while slashing user spend"; "Total UA Spend in 2022: Over $600k, excl. guarantees with Real Madrid etc."; "Total UA Spend in 2023 YTD: $116k".
Presentation choice: Showing spend is honest; calling the result organic overstates it.
When it does not fit: Don't call growth organic while still paying for acquisition.
Columns report what each slide states or leaves out; checks are our calculations.
Example
Organic claim
Share of
Count and period
Spend shown
Bubble
45% earned and referral
Paid users
No
Little spend; CAC trend
Celsius Network
90% organic
Downloads
65,000 in 9 months
No
TransferWise
~20% monthly growth
New paying users
Rate only
£0
Flo
76% or 66% organic
Traffic
Past quarter
No
Chotmai
9.13% vs 5.93% conversion
Visitors
No
CPA shown
api.video
100% organic
Sessions
Chart, no values
No
Replit
All organic
Monthly users
100K+ monthly
No
Cleary
Referrals main driver
Not stated
No
No
Climatiq
3x organic ARR
ARR
No
No
Concert With Me
1,400% growth
Not stated
60 weeks
No
Pulley
Word of mouth
One YC batch
No
No
Pillar
40% organic
New users
No
No
Tappa
60% growth
Keyboard opens
Since start of 2023
$600k+ then $116k
TouchSpin
50% organic (target)
Downloads
No
Target CPI
Key Takeaways
Say what the organic share is a share of. Bubble's 45% is of paid users, the most useful base.
Give a count and a period. Celsius Network's 90% of 65,000 downloads in 9 months can be rebuilt.
State marketing spend beside the claim. TransferWise shows £0; Tappa shows spend falling but not stopping.
Split organic into its parts. Flo separates branded and non-branded organic from paid traffic.
Name the driver with a number. Cleary says referrals drove growth but gives no share.
Label targets. TouchSpin's 50% organic downloads is a target KPI, not a result.
Build your organic growth line
Fill in each field. If a value is a target, say so on the slide.
Unit. Organic share of installs, sign-ups, paying users or revenue?
Count and period. How many, over which months?
Definition. Which sources count as organic, and which do not?
Spend. What did you spend on marketing in the same period?
Driver. Which organic source matters most, with its share?
Trend. How has the organic share moved?
Copyable framework: [Period]: [count] new [unit], [share]% organic ([sources]); marketing spend [amount]. Largest organic source: [source], [share]% of new [unit].
Illustrative example 1 — written by us
Before: Growth by Referrals has been the main driver to date
After: Last four quarters: referrals brought [share]% of new ARR ([count] of [total] new customers); no paid referral incentives.
What improved: Turns Cleary's headline into a number an investor can check (placeholders where the slide gives nothing).
What investors read into an organic growth claim
An organic growth line answers a go-to-market question: how much of the company's growth would continue if paid acquisition stopped tomorrow? A high organic share at low spend suggests the product itself creates demand, through search, word of mouth or sharing. It also suggests that each dollar of paid marketing added later will sit on top of a base that already grows. That is why founders like the claim and why investors test it.
The first test is the base. Organic share of website visits, app installs, free sign-ups, paying users and revenue are five different numbers, and they usually fall in that order: many visitors arrive organically, fewer of them pay. A slide that gives the organic share of the unit that matters to the business, paying users or revenue, says the most. A slide that gives it for installs or traffic is still useful, but an investor will ask how those convert.
The second test is the definition. Some teams count search engine traffic as organic even when they pay writers for content marketing. Some count influencer posts as organic when the influencer received free product. Some count partner recommendations, accelerator programmes or app store featuring. None of these is wrong, but they differ, and an investor comparing two slides needs to know which is meant.
The third test is spend. An organic claim is strongest beside the marketing budget for the same period. "£0 spent on marketing so far" leaves little room for doubt. "Organic growth while slashing user acquisition spend" is weaker, because spend that falls but continues still buys some growth, and past spend can keep bringing users in through reviews, rankings and word of mouth from paid users.
The fourth test is period and absolute size. A percentage growth figure with no starting point, or an organic share with no count, cannot be checked. A very high growth percentage from a small base is common and not suspicious in itself; the slide should simply show the base so an investor can judge.
Slides that tie the organic share to a count, a period or paying users
Bubble's page 18, "We can boost growth by investing in awareness and education and becoming a household name", says: "Brand is a major driver: 45% of paid users are earned media and referrals with little spend." It also says paid acquisition strategies "are now profitable" and that "CAC on Google has gone down 42% from November 2020 to March 2021." The base, paid users, is the strongest one in this set: it measures customers, not visits. The slide also sits the organic share beside a paid channel whose cost is falling, which tells an investor both channels are working. What it leaves out is the period for the 45% and the size of the paid user base. The remaining 55% of paid users came from other sources the slide does not break down (our calculation).
Celsius Network's page 31, "The Celsius Network Wallet", shows four app screens and a box: "65,000 downloads in 9 months" and "90% organic". Our calculations: 90% of 65,000 is 58,500 organic downloads and about 6,500 from other sources; 65,000 over 9 months averages about 7,200 downloads a month. The slide gives a count, a period and a share, so every figure can be rebuilt. It does not define organic, and downloads are the earliest step in the funnel: the slide does not say how many downloaders funded a wallet.
TransferWise's page 4, "Traction", dated 31.05.2011, lists "Charging customers from day one", "Trust: people have sent us £1M+", "70% volume from repeat customers", "£0 spent on marketing so far" and "Organic growth ~20% monthly (new paying users)". Two charts show payments and volume by month from January to May and a projection to June 2013. The organic claim is precise: the unit is new paying users, the rate is monthly, and the spend is stated as zero. Our calculation: 20% a month, if sustained, compounds to about 8.9 times in twelve months. The slide does not give the number of paying users, so the base of the 20% is not shown, and the June 2013 bars are a projection, not a result.
Flo's page 22, "Branded organic traffic is the main driver for overall FLO traffic growth", shows a pie chart titled "Past Q Traffic Structure iOS, US": 42% organic branded, 34% organic non-branded, 24% paid. The bullets add that "FLO's organic search traffic on the App Store is 66%, including 42% of organic branded traffic", and that most users find a period app by searching the App Store (39%) followed by a friend or relative suggestion (21%). Our calculation: the pie's two organic slices add to 76%, while the bullet says 66%. They may measure different things (all traffic versus App Store search traffic), but the slide does not say so, and an investor will notice the gap. Splitting organic into branded and non-branded is the most useful part: branded searches come from people who already know the name, which is the word-of-mouth signal. Flo's page 3 separately shows "66% Organic installs" out of "160M+ Total installs", roughly 106 million organic installs (our calculation).
Chotmai's page 15, "User Profile", is a table rather than a claim. It lists "Organic Conv Rate 9.13%" and "Paid Conv Rate 5.93%", "CPA Current 24 THB" against "CPA all time average 108THB", and "Cost per active user 20 THB", beside device, age and location splits. Our calculations: organic visitors convert about 1.5 times as often as paid ones, and current cost per acquisition is about 78% below the all-time average. Showing organic and paid side by side is honest and useful. The slide does not give the share of users who arrive organically, so an investor cannot tell how much of the business the better organic rate applies to.
Organic claims with no base, no values or no share
api.video's page 10, "Our growth is 100% organic", describes a four-step path: content marketing ranks the company first for search terms such as "video api" and "video upload"; that drives sessions on the website; visitors open a sandbox account; they become paying customers. A bar chart labelled "SEO / Organic" rises from July 2020 to December 2021 but has no values on its axis. The two conversion boxes, "visitors open a sandbox account" and "sandbox accounts become customers", both read "-,-%". The path is clear and the definition is stated (organic here means search traffic earned by content). But the slide gives no numbers an investor can use, and content marketing costs money even when no ads are bought.
Replit's page 10, "Product & Traction", says "100K+ monthly active users (all organic, 60% returning, 13 minutes on site)", "70% students, 5% Teachers" and "7 million programs ran our servers last month". The slide gives a count, a monthly period and two engagement measures alongside the organic claim, which makes "all organic" more believable: returning users and time on site show people came back, not just arrived. It does not say what organic covers or give a growth rate.
Cleary's page 12, "Growth via referrals", shows a bar chart of ARR from Q1 2021 to Q3 2022 with a legend for new logos, expansion and current ARR, but only one colour visible and no values beyond "$0". The bullets say "Accelerating ARR growth in the past year (+139%)", "Growth by Referrals has been the main driver to date" and "Projecting 3x growth y/y through Q1'24". Our calculation: +139% means ARR is about 2.4 times its level a year earlier. The headline names referrals, but the slide gives no share of new ARR from referrals and no count of referred customers. The 3x figure is a projection, not a result.
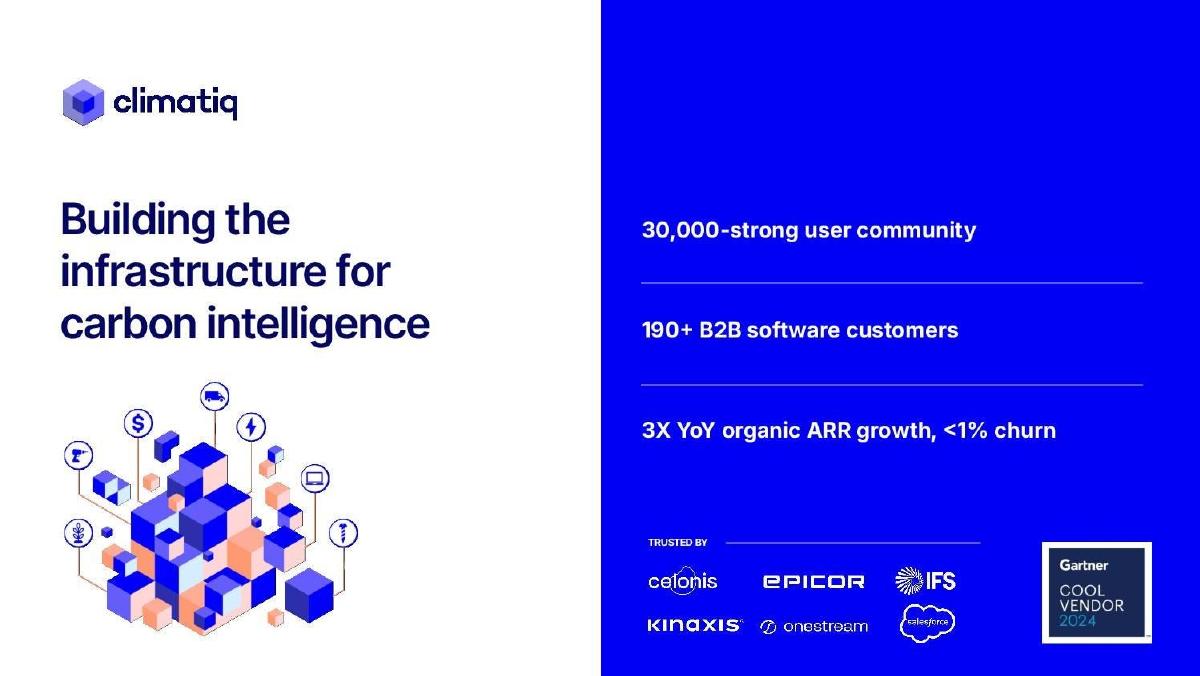
Climatiq's page 1, its cover, lists "30,000-strong user community", "190+ B2B software customers" and "3X YoY organic ARR growth" with churn printed as below 1%, with customer logos and a Gartner Cool Vendor 2024 badge. The slide uses organic to describe ARR growth, which is unusual: in finance "organic" often means growth without acquisitions of other companies, while in marketing it means growth without paid acquisition. The slide does not say which it means, gives no ARR figure and no period for the churn figure. As a cover it is a summary, but each number needs its detail later in the deck.
Concert With Me's page 10 shows "180,000 music fans monthly" and "1,400% organic growth for the last 60 weeks" over a rising area chart with no axis. Our calculations: 1,400% growth means the measure is 15 times its level 60 weeks earlier, which averages about 4.6% a week compounded. If the 1,400% refers to the same monthly fan count, the starting point would have been about 12,000 fans; the slide does not say which measure grew. The claim is impressive and may well be true, but without the starting count, the measure and a definition of organic an investor cannot check it.
Word of mouth claimed through other evidence, spend that did not stop, and targets
Pulley's page 6, "Customer growth from word of mouth", gives two pieces of evidence: "62% of the last YC Batch picked Pulley" ("We are consistently the product picked by the top new companies and serial entrepreneurs") and "Breakout companies are choosing Pulley" ("Companies raising $20m+ are picking us"), with logos including Fast, HelixNano, Clubhouse and namebase. The slide also shows a Y Combinator fundraising materials page and says Pulley is "the recommended cap table product by Y Combinator". The 62% share is a strong adoption figure within one well-defined group. But a recommendation from the accelerator is a distribution channel, not word of mouth between customers, and the slide does not separate the two. It also gives no size for the batch or the share of Pulley's total customers that came through it.
Pillar's page 10, "We've found scalable channels to acquire users", lists three channels: Social Media ("Posts on FB, IG, Reddit, and Twitter"), Referrals and WOM ("40% of new users sign up organically") and Content and Influencers ("Write high-quality content to boost search results"). A banner says "We expect the percent of new users coming from Referral & WOM to grow significantly." The 40% has a clear base, new users, but no period or count, and "organically" sits under the referrals heading, so it is unclear whether social posts and content are counted inside it. The expectation is a forecast with no reason given.
Tappa's page 4, "A Growing Audience", says "Organic growth in Keyboard opens - up over 60% since the start of 2023 while slashing user spend". The chart, "Keyboard Opens Growing with Lower UA Spend", shows monthly keyboard opens as bars and user acquisition spend as a line. A side note reads "Total UA Spend in 2022: Over $600k, excl. guarantees with Real Madrid etc." and "Total UA Spend in 2023 YTD: $116k". The slide deserves credit for printing the spend beside the claim. But spend was reduced, not stopped, so some of the 2023 growth may still be paid or the delayed effect of 2022's larger budget. "Organic" here means growth while spend fell, which is a weaker claim than growth with no spend.
TouchSpin's page 6, "Target KPIs", lists "Avg. targeted Facebook mobile installation - $2.00", "50% of downloads - Organic", "More than 33% of players - Invite Friends", retention targets and a 2-3% player-to-payer conversion. The heading makes the status clear: these are targets. That is the honest way to show a planned organic share. The slide does not say what it is based on; the company's previous page reports 40% organic downloads so far, which would give the 50% target a starting point if the two were shown together.
How to show organic growth on your slide
Name the unit and give the share with a count: "Q1: 1,240 new paying customers, 58% organic (search, referrals, direct); 42% paid." If you only have install or traffic data, say so, and show how those convert to paying users. Bubble's choice of paid users is the model; Celsius Network's download count with a period is the next best.
Define organic in a footnote. List what is included (search, direct, referrals, word of mouth, press) and what is not (paid ads, paid influencers, affiliate commissions). If you spend on content or SEO, say so: search traffic earned by paid writers is organic in the usual sense, but an investor will want to know its cost.
Put spend beside the claim. "£0 marketing spend" is the clearest; a spend figure for the same period is next. If spend fell, show both periods and avoid calling the growth organic unless you can separate the paid part, as Tappa's slide only partly does.
Give the period and the starting point for growth rates. "1,400% over 60 weeks, from 12,000 to 180,000 monthly listeners" can be checked; "1,400% organic growth" cannot. If referrals drive growth, give their share: "referrals: 46% of new ARR in the last four quarters" turns Cleary's headline into evidence.
Label targets and forecasts. TouchSpin's heading does this. A plan to raise the organic share should say what will change: a referral programme, a product feature that spreads by use, or a partnership.
Common mistakes
Organic share with no base. Say whether it is installs, users, paying users or revenue.
Growth percentage without a start. Give the starting and ending counts.
Spend left out. Show marketing spend for the same period.
Falling spend called organic. Say spend fell; separate paid from unpaid growth.
Partner channel called word of mouth. Keep recommendations and customer referrals apart.
Placeholders left in. Fill in or remove blank rates before sending.
Diagnostic checklist
The unit of the organic share is named.
A count and period appear with the share.
Organic is defined.
Marketing spend for the period is shown.
The main organic source has its own share.
Targets and projections are labelled.
Figures on the slide agree with each other.
Frequently asked questions
What counts as organic growth on a pitch deck?
Customers who arrived without paid acquisition: search, direct, referrals, word of mouth, press. Define it on the slide; api.video defines it as search traffic earned by content marketing.
Which base should the organic share use?
Paying users or revenue if you have them. Bubble gives 45% of paid users; Celsius Network gives 90% of downloads, which is useful but earlier in the funnel.
Is growth while cutting ad spend organic?
Only partly. Tappa's spend fell from over $600k in 2022 to $116k in 2023 year to date, so some growth may still be paid. Say spend fell rather than calling it organic.
How do I show word of mouth?
Give referrals' share of new customers, or branded search as a share of traffic, as Flo does. Keep partner recommendations separate, unlike Pulley's slide.
Can I show a target organic share?
Yes, if labelled. TouchSpin's slide is headed Target KPIs; show the current figure beside the target.
How we chose these examples
Search (2026-09-30): the durable corpus index (docs/seo/artifacts/corpus-search, 70,729 unique pages, deduplicated by deck-file sha256 + page) was searched for organic, word of mouth, referral, viral and k-factor within about 50 characters of a percentage; 126 pages matched after excluding public companies, SPACs, food and farming pages where organic describes ingredients.
Fifteen candidate pages were rendered from the original public deck files and read from the images; fourteen are used: Bubble 18, Celsius Network 31, TransferWise 4, Flo 22, Chotmai 15, api.video 10, Replit 10, Cleary 12, Climatiq 1, Concert With Me 10, Pulley 6, Pillar 10, Tappa 4 and TouchSpin 6.
Left out: Flo 3 (same deck and lesson as Flo 22; its 66% organic installs figure is cited in the text instead); TouchSpin 5 and BusRight 8 (already used in other guides); Trupanion (a public company); from their indexed text, Contactually 2, Blockit 3 and Parkbench 4 (percentages about their customers' industries, not the company's own growth); Andi Games 15 and BW Brief 14 (market survey figures, not company results); Borzo 6 (already used in another guide).
Figures are as printed on each slide; we did not have the companies' underlying data. How we built this: drafted and checked with AI assistance (editorial model review against the original slide images); no human editor has reviewed this guide.