How founders show conversion rates on a pitch deck: which stage each rate is measured from, whether it is measured or assumed.
How to Show a Conversion Funnel on Your Pitch Deck So Investors Can Check It
Thirteen slides from real pitch decks that show conversion rates between stages of a customer funnel. For each, we record what the slide states, which stage each rate is measured from, whether the rate is measured, taken from a survey, or assumed, and whether the numbers multiply through to the result the slide claims.
TL;DR
A conversion rate on a pitch deck is useful only when an investor can tell three things: what it is a share of (visitors, sign-ups, leads, people who have heard of the brand), over what period and sample it was measured, and whether it was actually measured or is a planning assumption. A funnel with those three answers can be multiplied through, stage by stage, to the customers and revenue the deck claims. A funnel without them is a set of percentages that cannot be checked.
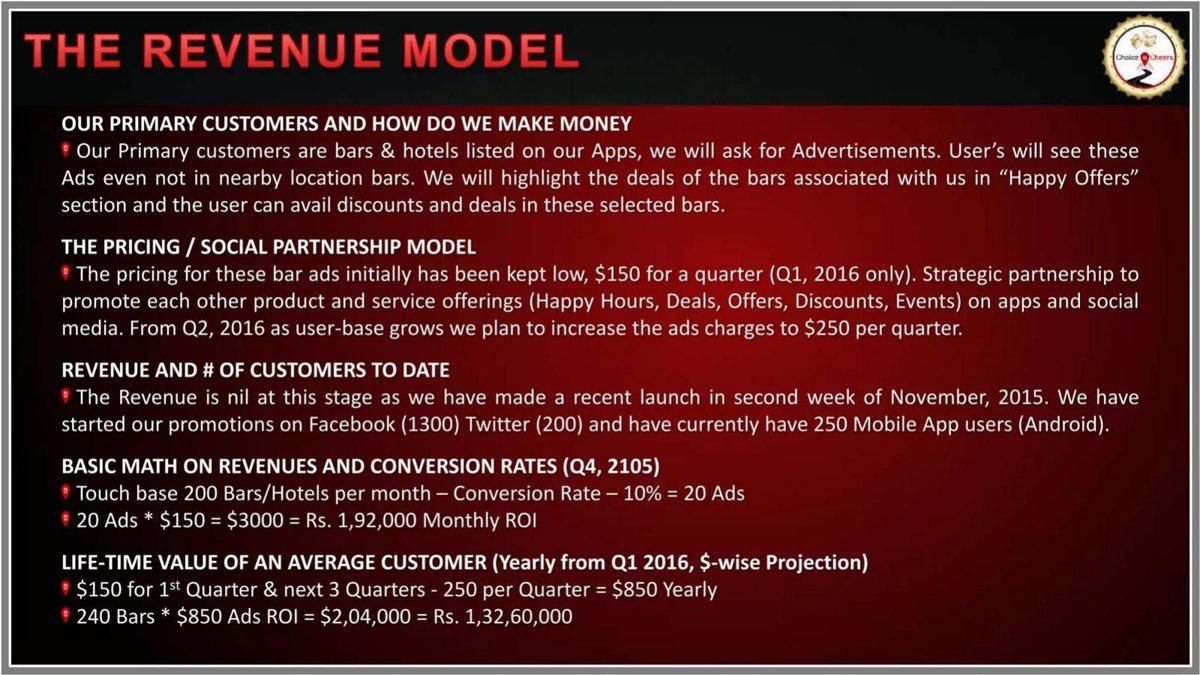
In this set, Mattermark's chart is the clearest measured funnel: monthly trial and newsletter conversion from June to December 2013, with the date it removed a credit-card requirement marked on the chart. LawnStarter shows the break-even conversion rate for each marketing channel next to the rate it expects, so an investor can see how much room each channel has. WaitForSales labels its whole funnel as assumptions it still has to validate. At the other end, Choice n Cheers multiplies a quarterly ad price as if it were monthly revenue and calls it "Monthly ROI", and Beveragewala projects conversion doubling from 7% to 15% with no reason given.
Conversion funnel slides from real pitch decks
Each example records what the slide states, what its rates are a share of, whether they are measured or assumed, and what to copy or avoid. "Our calculation" marks arithmetic we did; the slides do not show it.
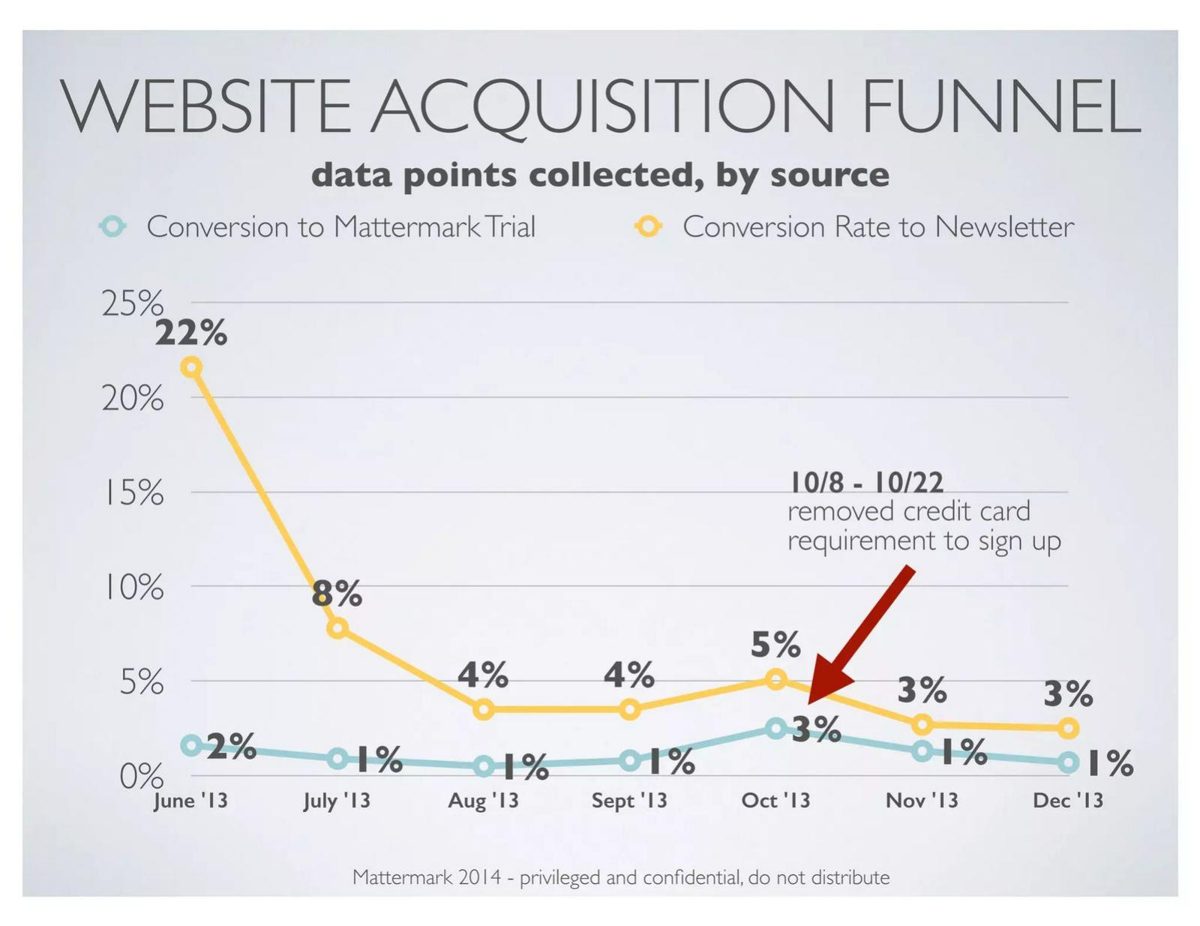
Mattermark go to market slide — slide 22
Startup data platform. "Website Acquisition Funnel" page (2014 deck).
Mattermark deck, slide 22. Exact stored slide matched to this analysis.
Our analysis: A measured funnel that shows its decline.
Evidence and limitation: Measured over seven months; the only trial spike coincides with the marked change. Traffic volume not shown.
What a founder can adapt: Add visitor counts so rates can be turned into trials.
Supporting analysis
What the deck claims: Monthly, June to December 2013: newsletter conversion 22%, 8%, 4%, 4%, 5%, 3%, 3%; trial conversion 2%, 1%, 1%, 1%, 3%, 1%, 1%. "10/8 - 10/22 removed credit card requirement to sign up".
Presentation choice: Seven months of data, bad months included, with a product change tied to the one improvement.
When it does not fit: Don't show only the best month.
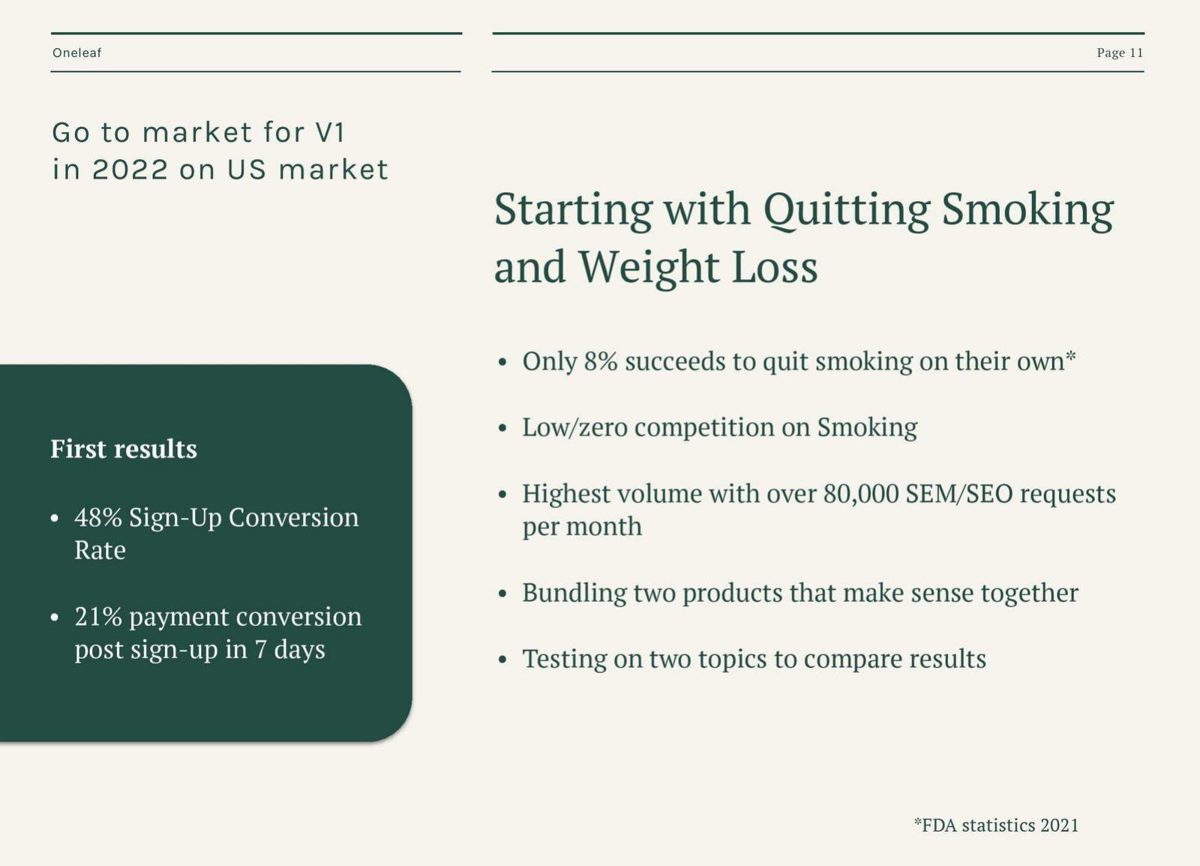
Oneleaf deck, slide 11. Exact stored slide matched to this analysis.
Our analysis: One well-defined rate, one undefined.
Evidence and limitation: The payment rate names its base and window; the sign-up rate names neither. Our calculation: about 10% of the top stage paid, if the 48% is of visitors.
What a founder can adapt: Define the sign-up rate the same way and give sample sizes.
Supporting analysis
What the deck claims: "48% Sign-Up Conversion Rate"; "21% payment conversion post sign-up in 7 days"; "over 80,000 SEM/SEO requests per month".
Presentation choice: "Post sign-up in 7 days" is a model definition.
When it does not fit: Don't set market search volume beside your own funnel as if it were traffic.
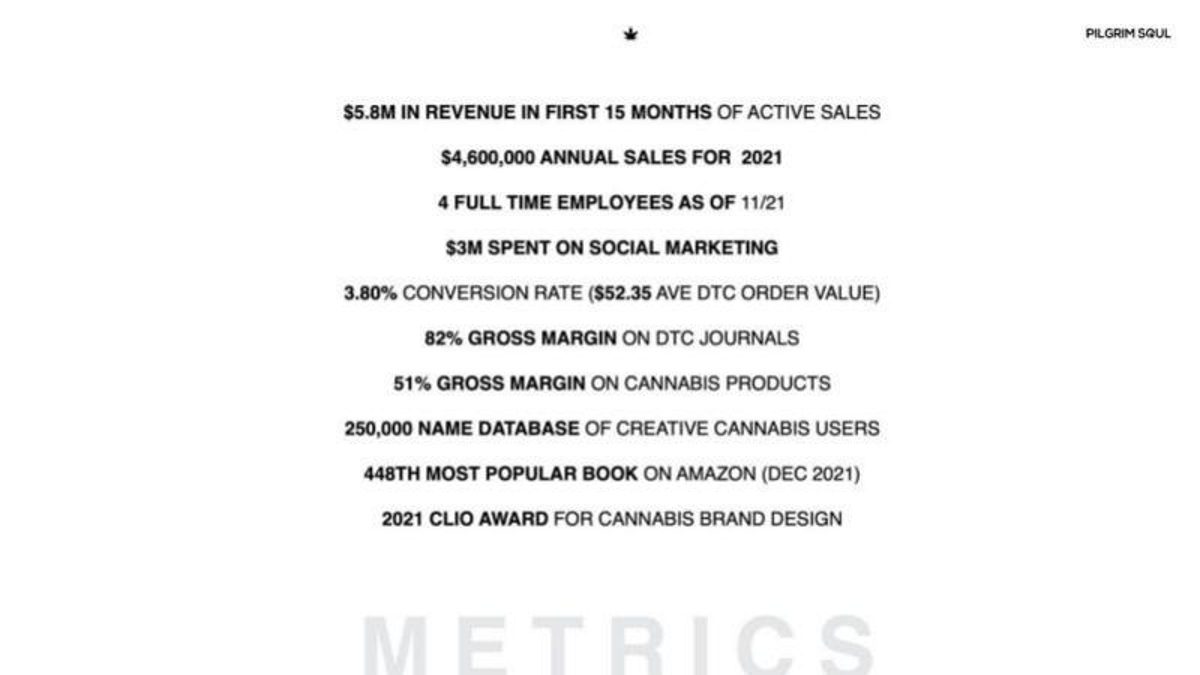
Pilgrim Soul deck, slide 20. Exact stored slide matched to this analysis.
Our analysis: A rate and order value without the traffic to connect them.
Evidence and limitation: Our calculations: about $1.2M outside 2021; marketing about 52% of revenue if over the same 15 months. Traffic and period of the $3M not stated.
What a founder can adapt: Add traffic and the period of the marketing spend.
Supporting analysis
What the deck claims: "3.80% conversion rate ($52.35 ave DTC order value)"; "$5.8M in revenue in first 15 months"; "$4,600,000 annual sales for 2021"; "$3M spent on social marketing".
Presentation choice: Gives order value beside conversion, half of what is needed to check revenue.
When it does not fit: Don't list conversion without saying what it is a share of.
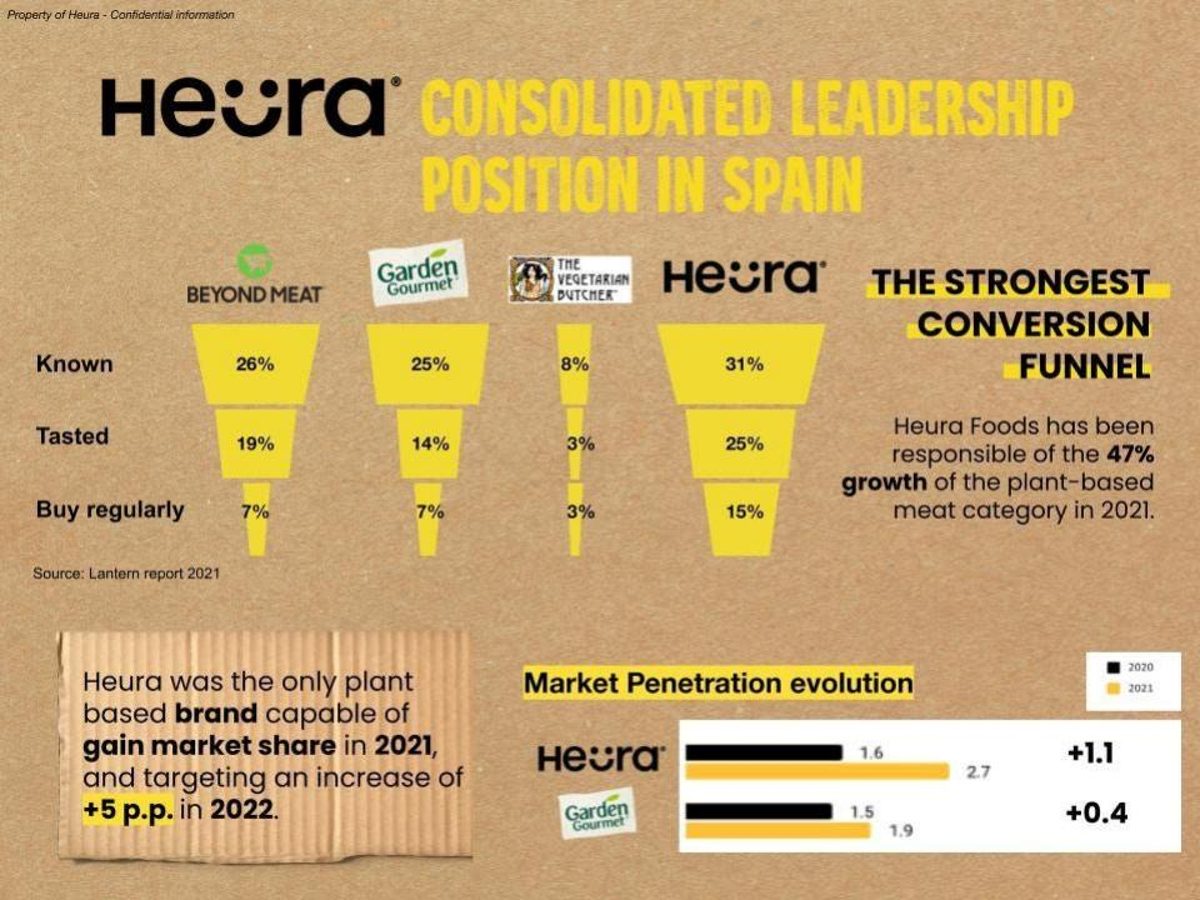
Heura deck, slide 25. Exact stored slide matched to this analysis.
Our analysis: A sourced survey funnel that supports its headline.
Evidence and limitation: Our calculation: known to regular buyer about 48% for Heura, 27% to 38% for the others. Survey population and size not stated.
What a founder can adapt: Say who was surveyed and how many.
Supporting analysis
What the deck claims: "The Strongest Conversion Funnel": known, tasted, buy regularly. Heura 31%, 25%, 15%; Beyond Meat 26%, 19%, 7%; Garden Gourmet 25%, 14%, 7%; The Vegetarian Butcher 8%, 3%, 3%. "Source: Lantern report 2021".
Presentation choice: Same three stages for every competitor, with a named source.
When it does not fit: Don't present what people say they buy as sales data.
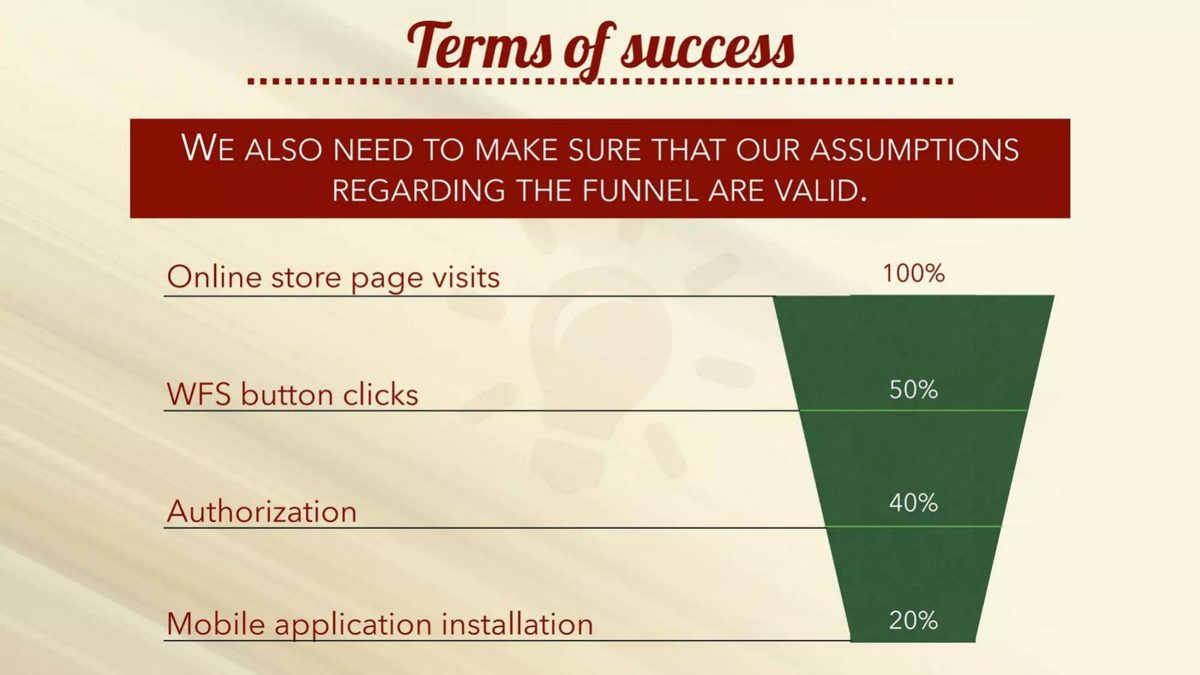
WaitForSales deck, slide 25. Exact stored slide matched to this analysis.
Our analysis: An honest assumption funnel.
Evidence and limitation: All rates labelled as assumptions. Our step rates: 50%, 80%, 50%.
What a founder can adapt: Add how and when each rate will be measured.
Supporting analysis
What the deck claims: "We also need to make sure that our assumptions regarding the funnel are valid." Page visits 100%, button clicks 50%, authorization 40%, app installation 20%.
Presentation choice: Says plainly that the rates are untested.
When it does not fit: Don't present assumed rates as results.
Lawn-care marketplace. "We can acquire customers profitably" page (first deck).
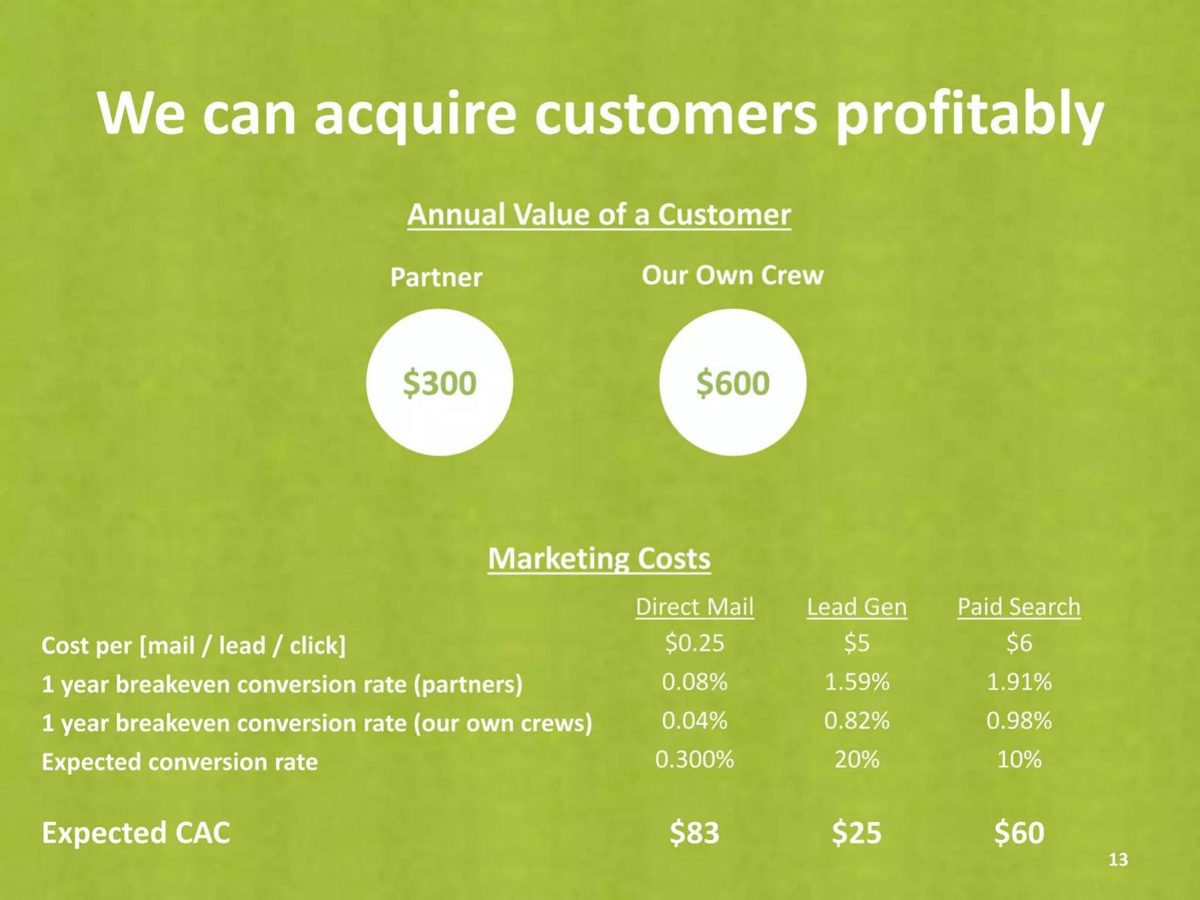
LawnStarter deck, slide 13. Exact stored slide matched to this analysis.
Our analysis: Break-even beside expected, per channel.
Evidence and limitation: Our checks: CAC figures match cost divided by expected rate; break-even rates imply a value near $314, not $300. Expected rates unsourced.
What a founder can adapt: Say whether expected rates are measured or benchmarks.
Supporting analysis
What the deck claims: Annual customer value $300 (partner) and $600 (own crew). Direct mail $0.25, lead gen $5, paid search $6. Break-even rates (partners) 0.08%, 1.59%, 1.91%; expected rates 0.300%, 20%, 10%; expected CAC $83, $25, $60.
Presentation choice: Shows how far each channel can miss and still pay back.
When it does not fit: Don't leave the customer value in the calculation different from the one shown.
Interactive video ads. "Supercharging Media" page.
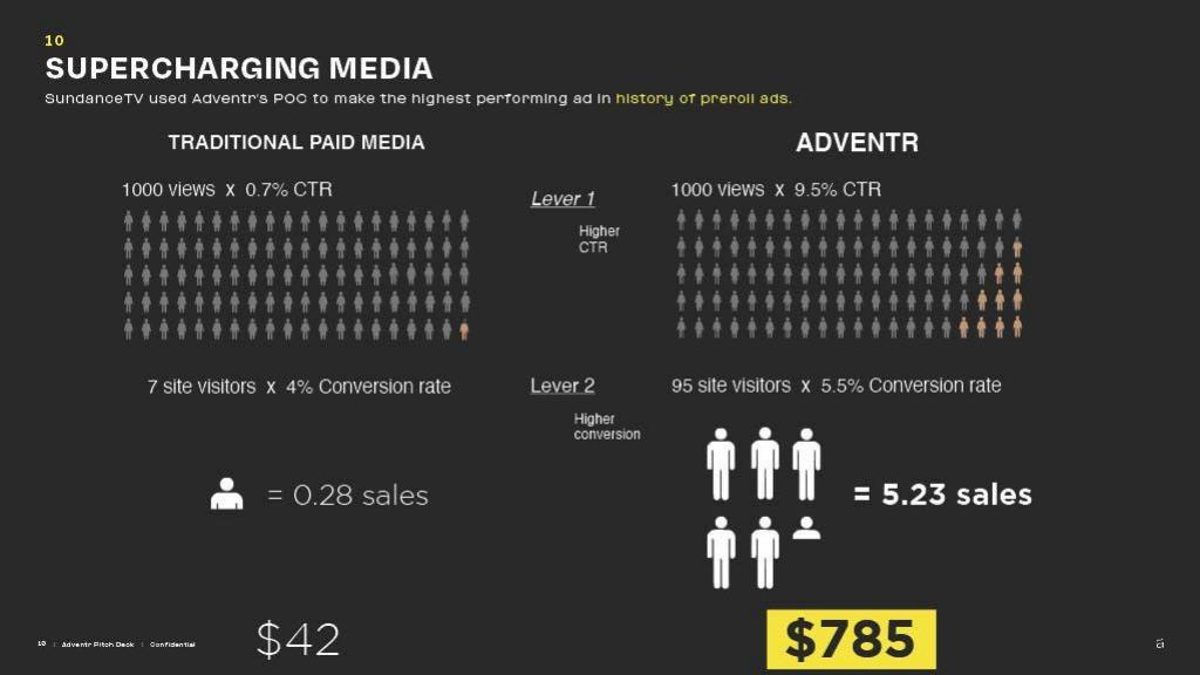
Adventr deck, slide 8. Exact stored slide matched to this analysis.
Our analysis: Internally consistent funnel arithmetic; measurement status unclear.
Evidence and limitation: Our checks: both sales figures multiply through; dollars imply about $150 per sale, not stated. Source of the rates not stated.
What a founder can adapt: Say which rates were measured in the SundanceTV campaign.
B2B software for experience businesses. "Building GTM flywheels" page.
Holdbar deck, slide 12. Exact stored slide matched to this analysis.
Our analysis: Two rates for one stage.
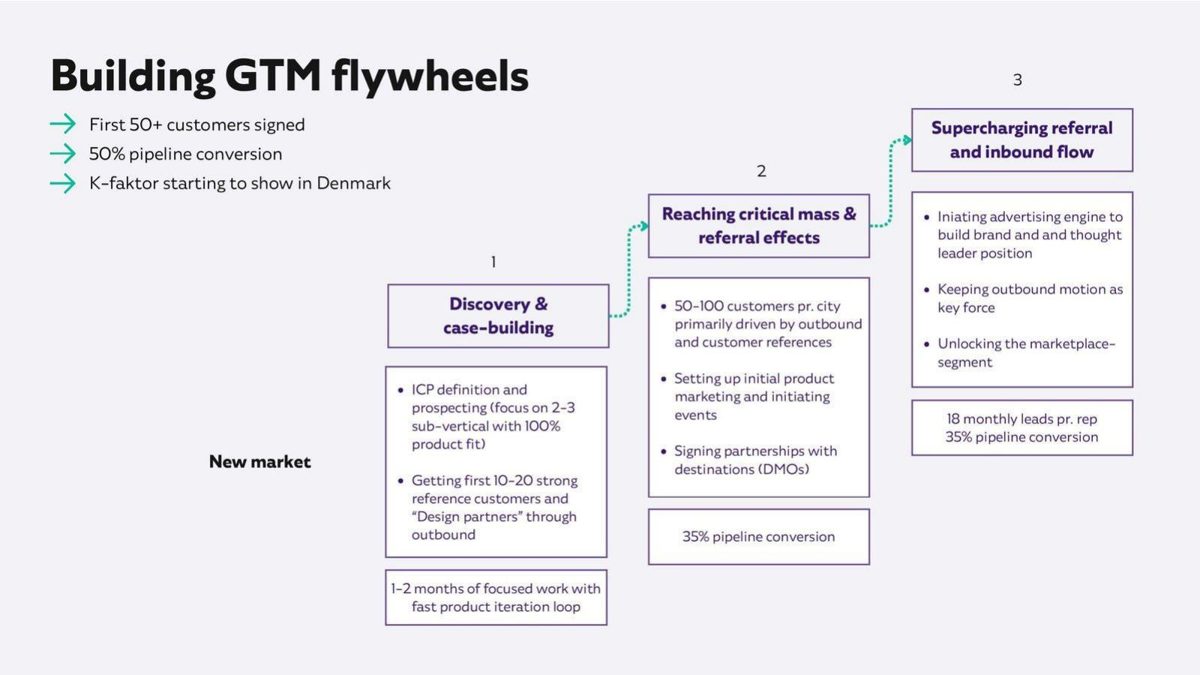
Evidence and limitation: Our calculation: about 6.3 customers per rep per month at 35%. Which rate is current, and what the pipeline stage is, not stated.
What a founder can adapt: Say the plan uses a lower rate on purpose, and define the stage.
Supporting analysis
What the deck claims: "First 50+ customers signed"; "50% pipeline conversion"; stage plans with "35% pipeline conversion" and "18 monthly leads pr. rep".
Presentation choice: Plans below the headline rate, which is conservative.
When it does not fit: Don't show two different rates for the same step without explanation.
Beveragewala deck, slide 11. Exact stored slide matched to this analysis.
Our analysis: A projected doubling of conversion without a cause.
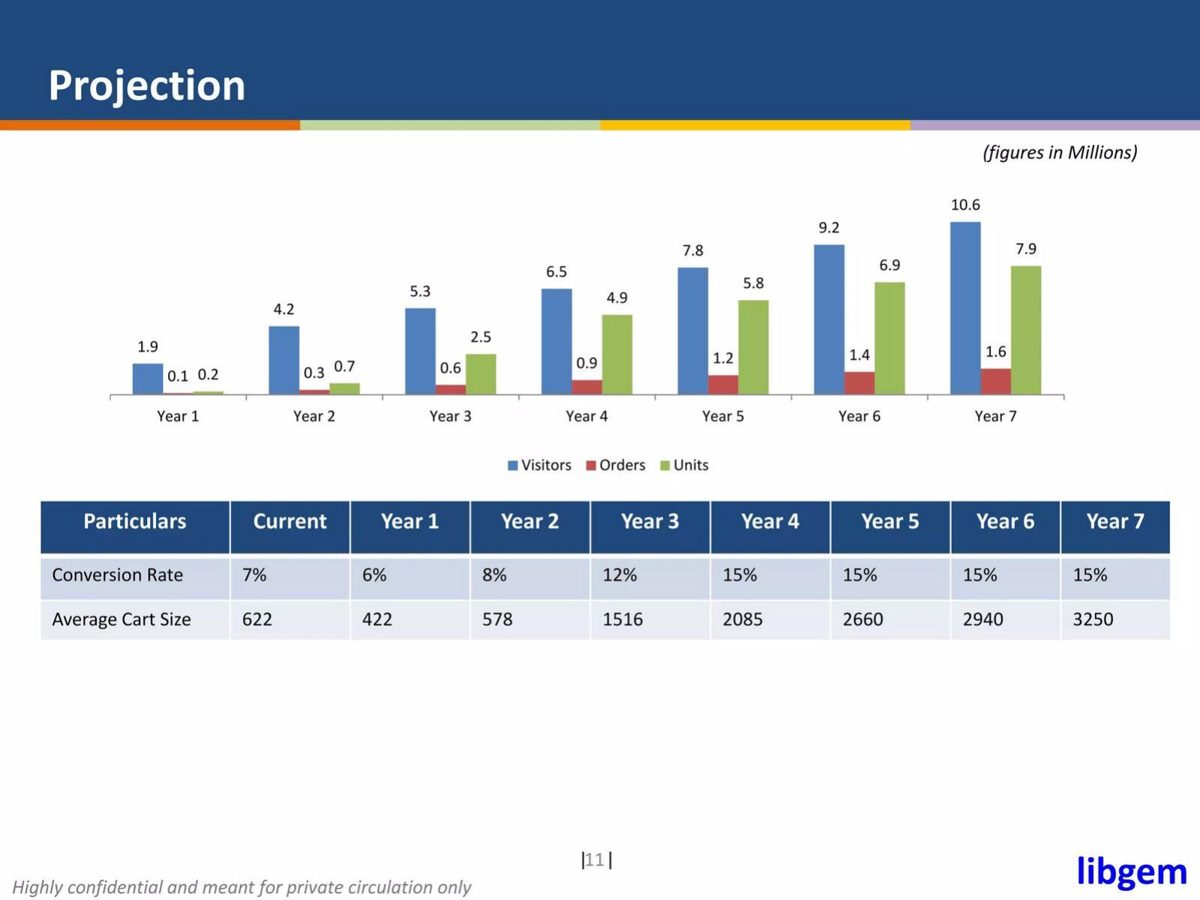
Evidence and limitation: Our checks: chart ratios match the table within rounding except Year 4 (about 13.8% against 15%). No reason given for the rise; cart size has no unit.
What a founder can adapt: Say what will lift conversion from 7% to 15%.
Supporting analysis
What the deck claims: Visitors 1.9M to 10.6M and orders 0.1M to 1.6M over seven years; conversion 7% now, then 6%, 8%, 12%, 15%, 15%, 15%, 15%; average cart size 622 to 3,250.
Presentation choice: Shows visitors, orders and rate together, so they can be checked.
When it does not fit: Don't leave currency off an order-value row.
Music fan platform. "Financial Projections" page (2013).
Bandwaggon deck, slide 17. Exact stored slide matched to this analysis.
Our analysis: Scenario rates without the price that links them to revenue.
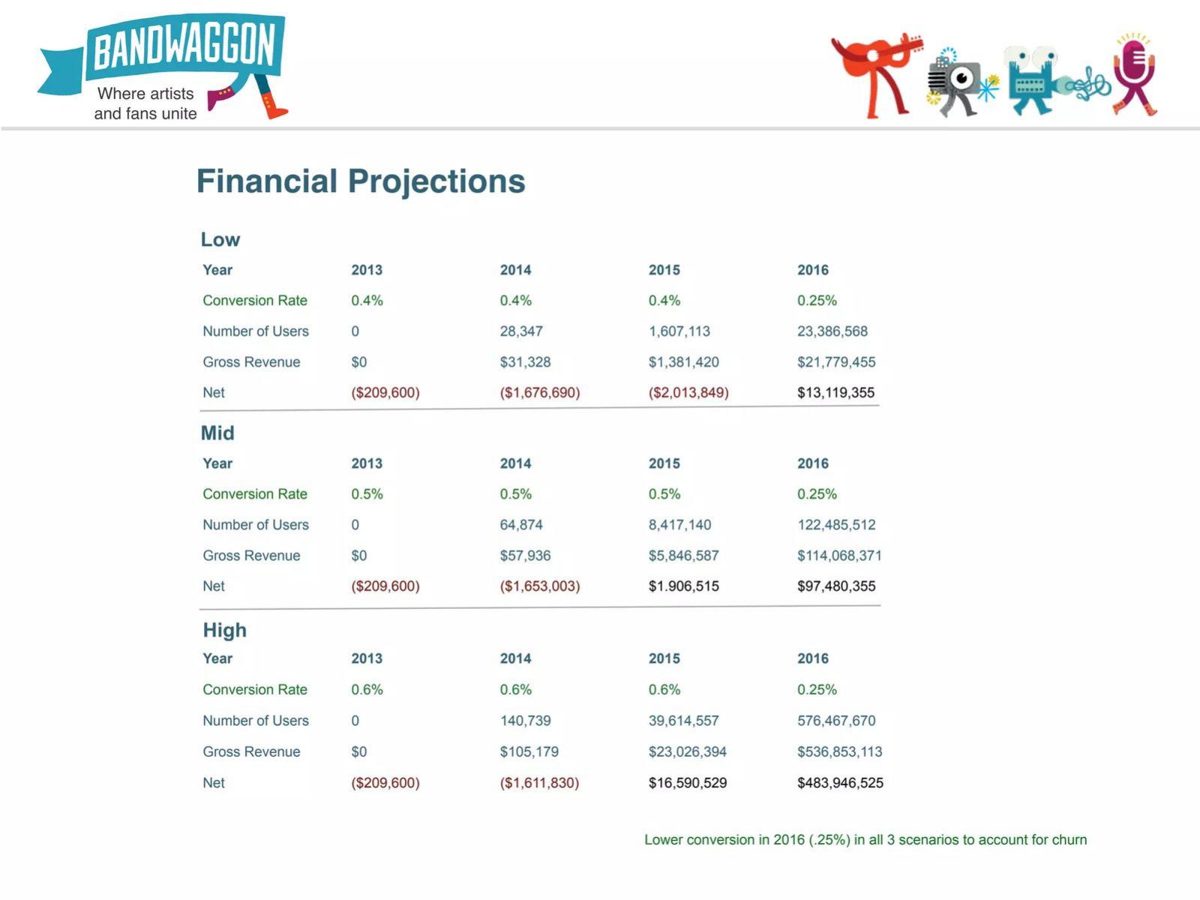
Evidence and limitation: Our calculation: 2014 revenue per user about $1.11, $0.89, $0.75; no price shown, so conversion can't be tied to revenue.
What a founder can adapt: Add price per paying user so each row can be multiplied out.
Supporting analysis
What the deck claims: Low, mid and high scenarios: conversion 0.4%, 0.5%, 0.6% to 2015, then 0.25% in 2016; users to 23.4M, 122.5M and 576.5M; "Lower conversion in 2016 (.25%) in all 3 scenarios to account for churn".
Presentation choice: Shows three scenarios side by side.
When it does not fit: Don't use a conversion cut to stand in for churn.
Bar deals app. "The Revenue Model" page (late 2015).
Choice n Cheers deck, slide 11. Exact stored slide matched to this analysis.
Our analysis: Assumed conversion with mixed periods.
Evidence and limitation: Our checks: $150 is a quarterly price, not monthly revenue; the figure is revenue, not ROI; $150 plus 3 times $250 is $900. The 10% is untested.
What a founder can adapt: Keep price and revenue in the same period and label the 10% as an assumption.
Supporting analysis
What the deck claims: "Touch base 200 Bars/Hotels per month - Conversion Rate - 10% = 20 Ads"; "20 Ads * $150 = $3000 = Rs. 1,92,000 Monthly ROI"; "$150 for 1st Quarter and next 3 Quarters - 250 per Quarter = $850 Yearly".
Presentation choice: Shows the whole calculation, so the errors can be found.
Columns report what each slide states or leaves out; checks are our calculations.
Example
Rate type
Base stated?
Period or sample?
Multiplies through?
Mattermark
Measured
Yes (site visitors)
Monthly, 7 months
No traffic shown
Oneleaf
Measured
Payment yes; sign-up no
7-day window only
Partly
Kollecto
Measured
Yes, each stage
Monthly
Yes (our 15 to 24 buyers)
Pilgrim Soul
Measured
No
No
No
Heura
Survey
Yes (known, tasted)
2021; sample not stated
Yes
WaitForSales
Assumed (labelled)
Yes
n/a
Yes
LawnStarter
Expected
Yes, per channel
No
Yes (CAC matches)
Adventr
Unclear
Yes
No
Yes
Dario Health
Unclear
No
No
No
Holdbar
Mixed
No
No
Yes (our 6.3 per rep)
Beveragewala
Projected
Yes (visitors)
Annual
Mostly; Year 4 off
Bandwaggon
Projected
Users
Annual
No price
Choice n Cheers
Assumed
Yes (bars contacted)
Monthly
No; mixed periods
Key Takeaways
Name the denominator. Oneleaf's 48% sign-up rate and Dario's 45% conversion to paying users don't say what they are a share of.
Say whether a rate is measured or assumed. WaitForSales heads its funnel "assumptions"; LawnStarter labels its rates "expected".
Show the rates over time, not one good month. Mattermark's newsletter conversion fell from 22% to 3% over seven months, and the chart shows it.
Multiply it through. Adventr's funnel lands exactly on its 0.28 and 5.23 sales; Choice n Cheers' ad maths mixes a quarterly price with monthly revenue (our checks).
Show the break-even rate beside the expected one. LawnStarter's channels need 0.08% to 1.91% to pay back in a year, against expected rates of 0.3% to 20%.
Keep one number per stage. Holdbar shows "50% pipeline conversion" in its headline and "35% pipeline conversion" in its plan without saying which is current.
Write your funnel
One row per stage. If a field is unknown, mark the rate as an assumption and say how you will measure it.
Stage. What action defines this stage (visit, sign-up, first payment)?
Base. What is the rate a share of: the previous stage or the top?
Type. Measured, survey, benchmark or assumption?
Period. Over what dates and how many people?
Result. How many customers and how much revenue does the funnel produce?
Break-even. What rate would you need to recover acquisition cost?
Copyable framework: [Visitors] a month ([period]). [X]% sign up (measured, [dates], n=[N]). [Y]% of sign-ups pay within [days] days. That gives [customers] a month at $[order value], $[revenue]. Break-even conversion: [Z]%.
Illustrative example 1 — written by us
Before: 48% Sign-Up Conversion Rate
After: 48% of landing-page visitors signed up and 21% of those paid within 7 days (measured, [dates], n=[N]).
What improved: Uses Oneleaf's own well-defined payment rate as the model for the undefined sign-up rate.
What a conversion funnel tells an investor
A funnel slide answers a practical question: for every hundred people the company reaches, how many become paying customers, and at what cost? Investors use it to check whether the revenue plan is plausible and whether the founders understand where their customers come from. A good funnel also shows where the company is working to improve, which is often the most useful thing on the slide.
Every conversion rate is a fraction, and the first job is to say what sits underneath it. "48% sign-up conversion" might be a share of landing-page visitors, of people who clicked an ad, or of people who started the sign-up form. Those are very different numbers. A rate measured from the previous stage (step rate) and a rate measured from the top of the funnel (cumulative rate) also differ: WaitForSales' 20% installation rate is 20% of page visits, but only 50% of the people who got as far as authorisation (our calculation).
The second job is to say how the rate was obtained. A measured rate comes from the company's own data over a stated period. A survey rate comes from a third party asking people what they did. A benchmark rate is borrowed from another company or industry. An assumed rate is a planning input. All four can appear honestly on a pitch deck, but they carry different weight, and investors will ask which one they are looking at.
The third job is to connect the rates to the result. If a slide shows visitors, conversion and order value, the product of the three should be close to the revenue on the same slide or in the financial plan. Where it is not, the gap is the first question an investor will ask. We did this multiplication for every slide in this set where the figures allowed it.
Measured funnels: what they show and what they leave out
Mattermark's page 22, "Website Acquisition Funnel", plots two lines by month from June to December 2013: "Conversion to Mattermark Trial" and "Conversion Rate to Newsletter". Newsletter conversion reads 22%, 8%, 4%, 4%, 5%, 3% and 3%; trial conversion reads 2%, 1%, 1%, 1%, 3%, 1% and 1%. An arrow marks "10/8 - 10/22 removed credit card requirement to sign up", and October is the only month trial conversion reaches 3%. This is the most honest slide in the set: it shows seven months, including a steep decline in newsletter conversion, and ties the one spike to a specific product change. What it does not show is traffic volume, so an investor cannot tell whether 1% of a growing audience is more trials than 22% of a small early one. The slide also does not say whether the credit-card change was kept after 10/22, although trial conversion returned to 1% in November and December.
Oneleaf's page 11, "Go to market for V1 in 2022 on US market", lists "First results": "48% Sign-Up Conversion Rate" and "21% payment conversion post sign-up in 7 days". The second rate is well specified: it names its denominator (people who signed up) and its window (seven days). The first names neither. Our calculation: if the 48% is a share of landing-page visitors, about 10% of visitors paid within a week (48% times 21%). The slide also cites "over 80,000 SEM/SEO requests per month", which is search volume for the topic, not Oneleaf's own traffic, and gives no sample size for either rate.
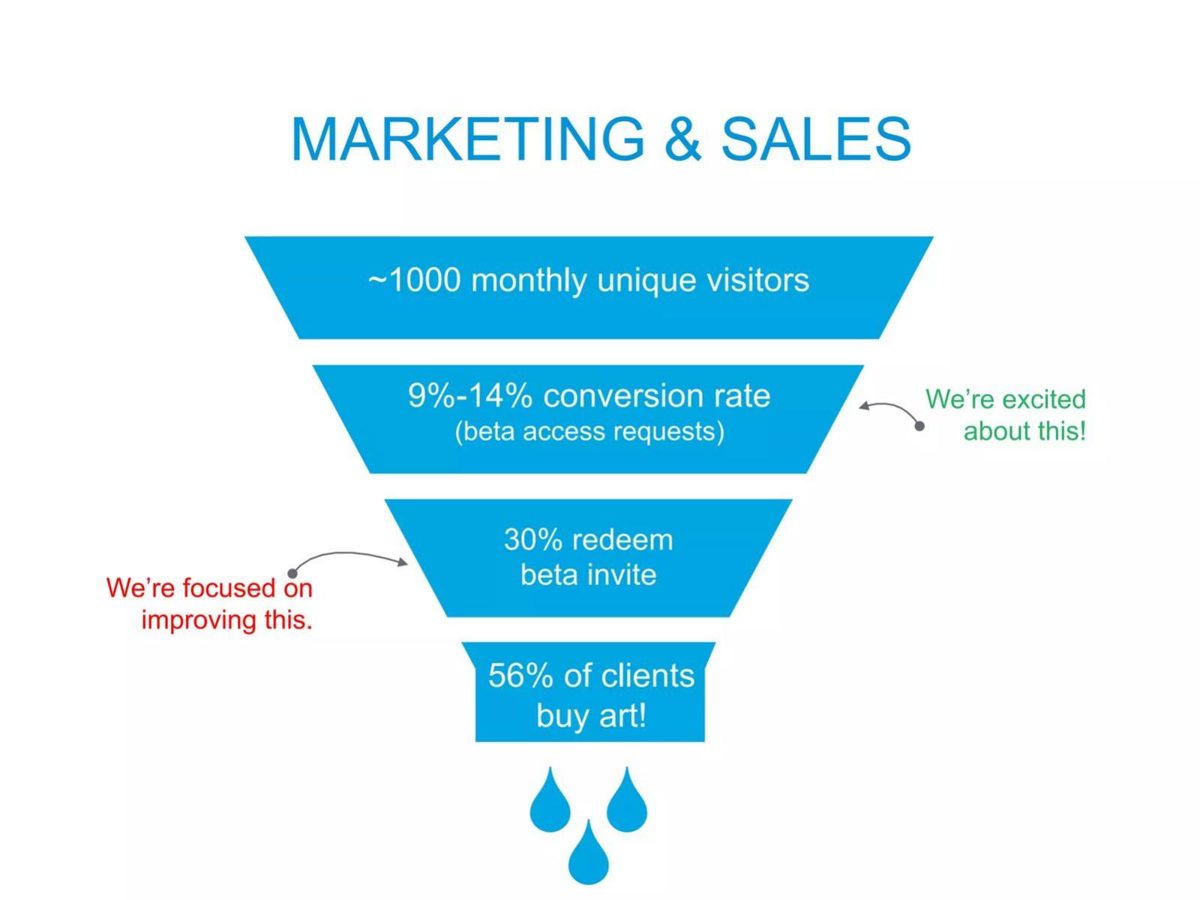
Kollecto's page 7, "Marketing & Sales", is a four-stage funnel: "~1000 monthly unique visitors", "9%-14% conversion rate (beta access requests)", "30% redeem beta invite" and "56% of clients buy art!". It names each stage and marks the weak one ("We're focused on improving this" beside the 30%). Our calculation: 1,000 visitors times 9% to 14% times 30% times 56% gives roughly 15 to 24 buyers a month. The slide does not state that result, the order value, or whether "clients" means everyone who redeemed an invite.
Pilgrim Soul's page 20, "Metrics", lists "3.80% conversion rate ($52.35 ave DTC order value)" among "$5.8M in revenue in first 15 months of active sales", "$4,600,000 annual sales for 2021" and "$3M spent on social marketing". The rate does not say what it is a share of, most likely store visits, and the slide gives no traffic. Our calculations: the two revenue figures imply about $1.2M outside 2021 within the 15 months; if the $3M of marketing covered the same 15 months, it was about 52% of revenue. The slide does not say what period the $3M covers or how much revenue came from direct orders at $52.35 rather than other channels, so the funnel cannot be multiplied through.
A third-party survey funnel
Heura's page 25, "Consolidated Leadership Position in Spain", shows "The Strongest Conversion Funnel" for four plant-based meat brands, with the source "Lantern report 2021". Each brand has three stages: known, tasted and buy regularly. Heura reads 31%, 25% and 15%; Beyond Meat 26%, 19% and 7%; Garden Gourmet 25%, 14% and 7%; The Vegetarian Butcher 8%, 3% and 3%.
Our calculations support the headline on these figures. Of people who know each brand, the share who buy it regularly is about 48% for Heura, 27% for Beyond Meat, 28% for Garden Gourmet and 38% for The Vegetarian Butcher. Heura's step rates are about 81% from known to tasted and 60% from tasted to regular buyer. The strengths are that the source is named and the same measure is applied to every competitor. The slide does not say who was surveyed (all Spanish adults, meat eaters, or buyers of plant-based products) or how many people, and a survey measures what people say they do, not what they buy.
Funnels built from assumptions
WaitForSales' page 25, "Terms of success", is headed "We also need to make sure that our assumptions regarding the funnel are valid" and shows "Online store page visits" 100%, "WFS button clicks" 50%, "Authorization" 40% and "Mobile application installation" 20%. It is the only slide in the set that labels every rate as an assumption to be tested. Our step rates: 50% of visitors click, 80% of clickers authorise, and 50% of those install. An investor can see exactly which step the company expects to lose most people at, and ask how it plans to measure it.
LawnStarter's page 13, "We can acquire customers profitably", sets an annual customer value of $300 through partners and $600 with its own crews against three channels: direct mail at $0.25 per piece, lead generation at $5 per lead and paid search at $6 per click. For each it shows the conversion rate needed to break even in one year and an "expected conversion rate" (0.300%, 20% and 10%), and gives expected acquisition costs of $83, $25 and $60. Our checks: $0.25 divided by 0.3% is $83, $5 divided by 20% is $25 and $6 divided by 10% is $60, all matching. The break-even rates are slightly below cost divided by customer value (for example $5 divided by $300 is 1.67%, against 1.59% shown), which implies a customer value of about $314 rather than $300 in the calculation; the slide does not explain the difference. The useful lesson is the structure: an investor can see that expected rates sit between about four and thirteen times the break-even rate (our calculation), so the plan survives a large miss. The expected rates are not labelled as measured, and the slide does not say where they come from.
Adventr's page 8, "Supercharging Media", compares "Traditional paid media" (1,000 views times 0.7% click-through gives 7 site visitors, times 4% conversion gives 0.28 sales, $42) with Adventr (1,000 views times 9.5% gives 95 visitors, times 5.5% gives 5.23 sales, $785). Our checks: 95 times 5.5% is 5.225, and both sales figures match. The dollar figures are consistent with about $150 per sale, which the slide does not state. The slide says SundanceTV used Adventr's proof of concept, but does not say whether the 9.5% and 5.5% were measured in that campaign or are illustrative, and the traditional-media rates have no source.
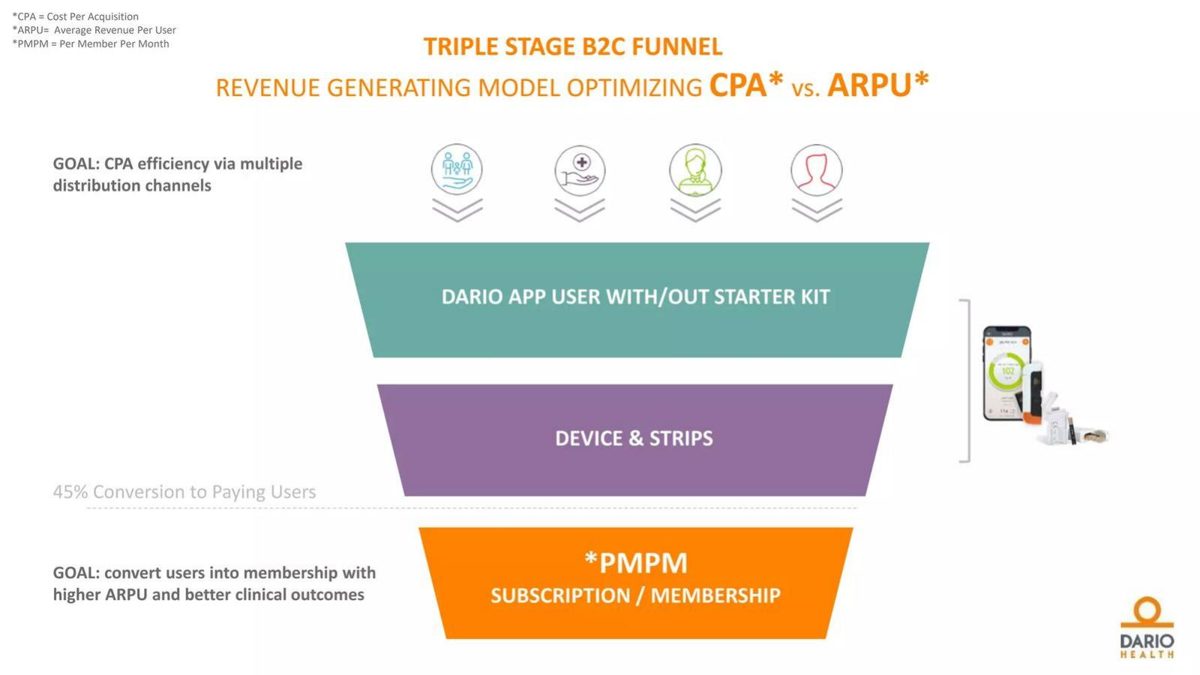
Dario Health's page 23, "Triple Stage B2C Funnel", shows app users, device and strips, and subscription, with "45% Conversion to Paying Users" drawn between the second and third stages. It is the only rate on the slide, and the slide does not say whether it is 45% of app users, of device buyers, or of some other group, or over what period. Placing a single rate on a multi-stage funnel invites the reader to apply it to the wrong stage.
Holdbar's page 12, "Building GTM flywheels", lists "First 50+ customers signed" and "50% pipeline conversion" at the top, then shows "35% pipeline conversion" under its second stage and "18 monthly leads pr. rep, 35% pipeline conversion" under its third. Our calculation: 18 leads times 35% is about 6.3 new customers per rep per month. Planning below the current rate is a conservative choice, but the slide does not say that is what it is doing, or what "pipeline conversion" measures (qualified leads to signed customers, or demos to signed customers).
Projections that need a reason
Beveragewala's page 11, "Projection", charts visitors, orders and units in millions for seven years and tabulates a conversion rate of 7% now, then 6%, 8%, 12%, 15%, 15%, 15% and 15%. Our checks: orders divided by visitors give about 5.3%, 7.1%, 11.3%, 13.8%, 15.4%, 15.2% and 15.1%. The first three years match within the rounding of the chart labels; Year 4 is below the table's 15% even allowing for rounding. The larger question is the doubling from 7% to 15%, which the slide does not explain. The "Average Cart Size" row, rising from 622 to 3,250, has no currency or unit.
Bandwaggon's page 17, "Financial Projections", gives low, mid and high scenarios with conversion rates of 0.4%, 0.5% and 0.6% from 2013 to 2015, cut to 0.25% in 2016 "to account for churn", while users rise to 23.4 million, 122.5 million and 576.5 million. Our calculation: revenue per user in 2014 is about $1.11, $0.89 and $0.75 across the three scenarios, so the conversion rate cannot be tied to revenue without a price the slide does not give. Lowering a conversion rate to reflect churn mixes two different measures: conversion is how many users start paying, churn is how many stop.
Choice n Cheers' page 11, "The Revenue Model", says the company launched in November 2015 with nil revenue and 250 app users, prices bar adverts at "$150 for a quarter (Q1, 2016 only)" and "$250 per quarter" from Q2, and sets out "Basic math on revenues and conversion rates": "Touch base 200 Bars/Hotels per month - Conversion Rate - 10% = 20 Ads" and "20 Ads * $150 = $3000 = Rs. 1,92,000 Monthly ROI". Our checks: $150 is a quarterly price, so 20 ads bring $3,000 a quarter each month's cohort, not $3,000 of monthly revenue, and the figure is revenue, not return on investment. The lifetime value line, "$150 for 1st Quarter and next 3 Quarters - 250 per Quarter = $850 Yearly", adds to $900 by our calculation. The 10% rate is an assumption with no test behind it.
How to build your funnel slide
Name every stage and say what each rate is a share of. "Visitors to sign-up 12%; sign-up to paid within 30 days 21%" is checkable. "48% conversion" is not.
Label each rate as measured, survey, benchmark or assumption. If measured, give the period and the sample (for example "March to May, 4,200 visitors").
Show a trend, not a single month. Mattermark's seven months, including the decline, are more credible than a single high number.
Multiply the funnel through to customers and revenue, and make sure the result matches the traction or financial slide. If it does not, explain the gap before an investor finds it.
Put the break-even rate beside the expected rate, as LawnStarter does. It turns a hopeful number into a margin of safety.
If you project conversion to improve, say what will cause it: a product change, a new channel, a price test. Beveragewala and Bandwaggon give no reason for their changes.
Keep one current figure per stage. If your plan uses a lower rate than today's, say so, as a deliberate choice.
Common mistakes
No denominator. Say what each rate is a share of.
Assumptions shown as results. Label planned rates as assumptions, as WaitForSales does.
One good month. Show a trend, including the months that went down.
Mixed periods. Keep prices, customers and revenue in the same period.
Unexplained improvement. Say what will cause projected conversion to rise.
Two numbers for one step. Give one current rate per stage and explain any planning discount.
Diagnostic checklist
Every stage is named.
Every rate says what it is a share of.
Each rate is labelled measured, survey, benchmark or assumption.
Measured rates give a period and sample size.
The funnel multiplies through to customers and revenue.
The result matches the traction and financial slides.
Any projected improvement has a stated cause.
Frequently asked questions
Should I include a conversion funnel on my pitch deck?
Yes, if you have measured data or clearly labelled assumptions. Mattermark shows seven months of measured rates; WaitForSales labels its whole funnel as assumptions to test. Both are honest.
Should I show step rates or cumulative rates?
Either, but say which. WaitForSales' 20% installation rate is 20% of visits and 50% of those who authorised (our calculation); both are true, and the slide should make clear which it means.
What if I only have a few weeks of data?
Show it with the sample size and window. Oneleaf's "21% payment conversion post sign-up in 7 days" is a good model for an early rate.
Can I use industry conversion benchmarks?
Yes, labelled as benchmarks with a source. Heura names the survey behind its funnel; Adventr's "traditional paid media" rates have no source.
How do I show that my funnel is profitable?
Put the break-even conversion rate beside the expected one, as LawnStarter does for each channel. Investors can see the margin of safety at a glance.
How we chose these examples
Search (2026-09-30): the durable corpus index (docs/seo/artifacts/corpus-search, 70,729 unique pages, deduplicated by deck-file sha256 + page) was searched for "funnel" with percentages and for "conversion rate" near visitors, leads, sign-ups, installs and downloads; about 70 pages matched after excluding public companies.
Fifteen candidate pages were rendered from the original public deck files and read from the images; thirteen are used: Mattermark 22, Oneleaf 11, Kollecto 7, Pilgrim Soul 20, Heura 25, WaitForSales 25, LawnStarter 13, Adventr 8, Dario Health 23, Holdbar 12, Beveragewala 11, Bandwaggon (bw-brief) 17 and Choice n Cheers 11.
Left out after image review: RecruitBot 16 (the conversion funnel is inside a customer quote and redacted in the deck) and Boomeon 9 (original deck file unavailable). Not rendered: product-feature slides about customers' conversion (Amplitude 4, Algolia 12, Chili Piper 3 and 4, Bigblue 6), mining resource-to-reserve conversion (Golden Star, GSR), currency and share conversion rates, market-sizing "funnels" (Origin 10), and Female Invest ("invest") 7, a duplicate of the Kollecto page. The freemium-to-paid conversion topic is covered in its own guide and not repeated here.
Figures are as printed on each slide; chart values were read from their data labels. We did not have the companies' underlying data. How we built this: drafted and checked with AI assistance (editorial model review against the original slide images); no human editor has reviewed this guide.