Free-to-Paid Conversion on a Pitch Deck: Measured, Target
How founders present freemium conversion: what counts as a free user, over what period, measured or targeted.
How to Show Free-to-Paid Conversion on Your Pitch Deck, and Make the Revenue Math Add Up
Ten slides from real pitch decks that state a free-to-paid conversion rate. For each, we record what the slide states, whether the rate is measured or a target, and whether the numbers built on it can be reproduced from the slide.
TL;DR
A free-to-paid conversion rate is the share of free users who start paying. On a pitch deck it usually carries the whole revenue model: "at 1M users, our projected revenue is $3.6M" is simply users × conversion × price. The rate earns trust when the slide says whether it is measured or a target, what counts as a free user (every sign-up, or only active users), over what period people convert, and on how many users it was measured. It also needs the price, so a reader can reproduce the projection.
In this set, only HealthyAlways gives a measured rate, a price and a period of billing together ("current conversation ratio of converting free to paid subscriptions is 11%", "INR 3,500 per annum"). Buffer and TelemetryDeck give enough figures to check the arithmetic, and in both our checks do not reproduce the headline revenue from the slide's own figures. Huntly's 5% is labelled as a target, which is honest; Nanonets redacts the figure to "XX%".
Free-to-paid conversion slides from real pitch decks
Each example shows the exact page from the original public deck above its analysis and links to the full teardown. Figures are the companies' own and have not been verified. Calculations are ours and are labelled. Page numbers are PDF pages.
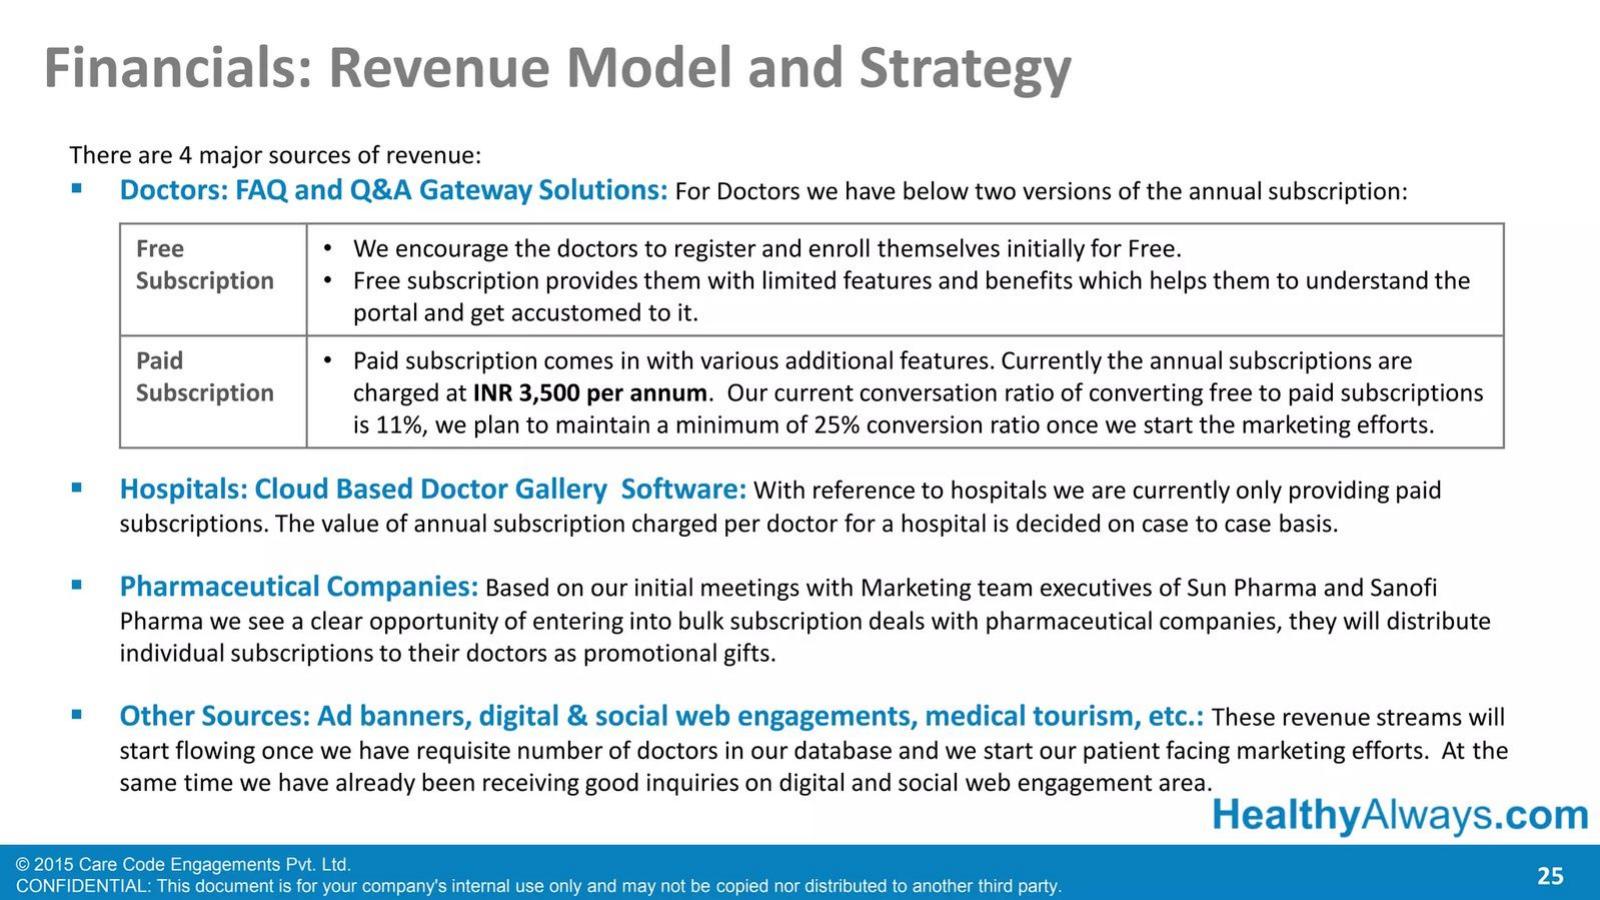
HealthyAlways business model slide — slide 25
Online question-and-answer portal for doctors, from Care Code Engagements (2015). "Financials: Revenue Model and Strategy" slide in a 28-page deck.
HealthyAlways deck, slide 25. Exact stored slide matched to this analysis.
Our analysis: It states a current rate, the price and the billing period together, and separates the current figure from the plan.
Evidence and limitation: "Maintain a minimum of 25%" when the current rate is 11% describes a target, not something already achieved; say how the rate would rise.
What a founder can adapt: Give the number of registered doctors behind the 11% and the period over which they converted.
Supporting analysis
What the deck claims: Free subscription "provides them with limited features"; paid subscription "charged at INR 3,500 per annum. Our current conversation ratio of converting free to paid subscriptions is 11%, we plan to maintain a minimum of 25% conversion ratio once we start the marketing efforts." Hospital, pharmaceutical and advertising revenue are described without figures.
Presentation choice: It states a current rate, the price and the billing period together, and separates the current figure from the plan.
When it does not fit: "Maintain a minimum of 25%" when the current rate is 11% describes a target, not something already achieved; say how the rate would rise.
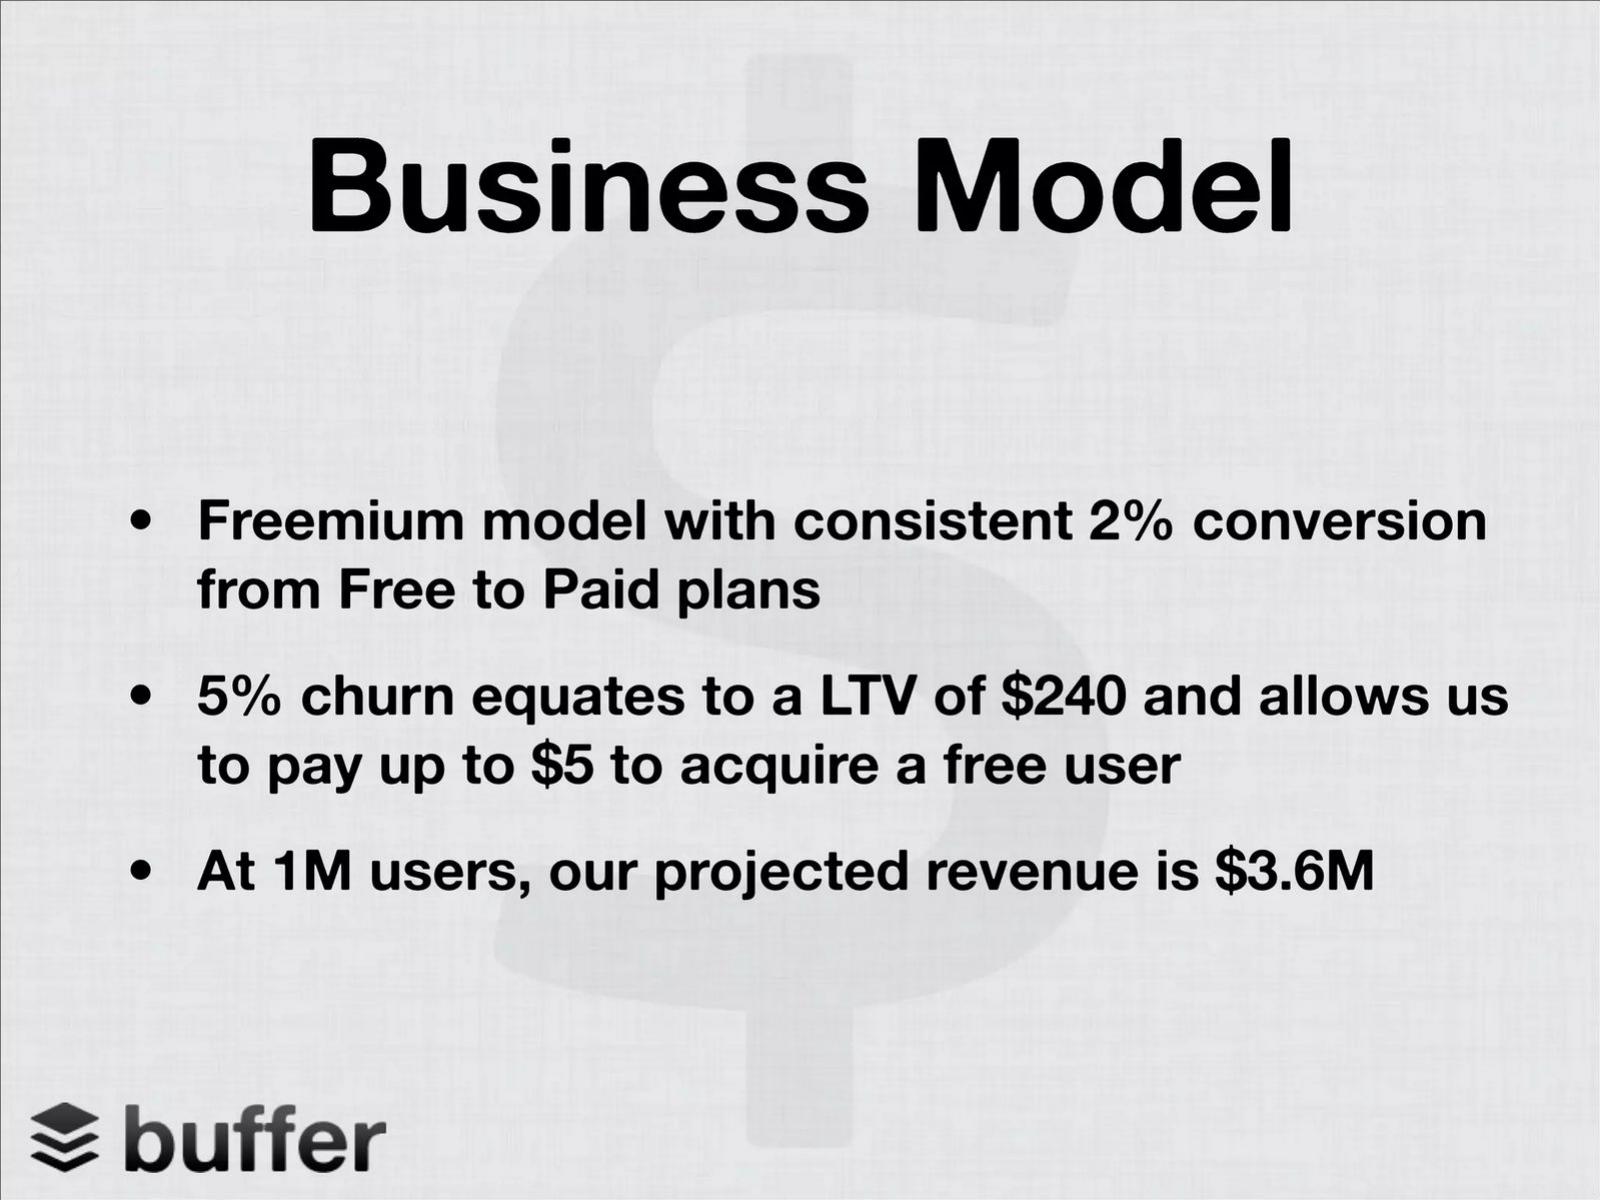
Social media scheduling tool. "Business Model" slide in a 13-page deck.
Buffer deck, slide 7. Exact stored slide matched to this analysis.
Our analysis: Conversion, churn, lifetime value and the acquisition budget per free user sit together, so a reader can test them against each other; the $5 budget agrees with 2% × $240 ($4.80, our calculation).
Evidence and limitation: By our calculation (monthly churn assumed) the stated figures give $2.88M at 1M users, not $3.6M; the slide does not show which input differs.
What a founder can adapt: Add the price per paying user and show the projection as a formula.
Supporting analysis
What the deck claims: "Freemium model with consistent 2% conversion from Free to Paid plans"; "5% churn equates to a LTV of $240 and allows us to pay up to $5 to acquire a free user"; "At 1M users, our projected revenue is $3.6M".
Presentation choice: Conversion, churn, lifetime value and the acquisition budget per free user sit together, so a reader can test them against each other; the $5 budget agrees with 2% × $240 ($4.80, our calculation).
When it does not fit: By our calculation (monthly churn assumed) the stated figures give $2.88M at 1M users, not $3.6M; the slide does not show which input differs.
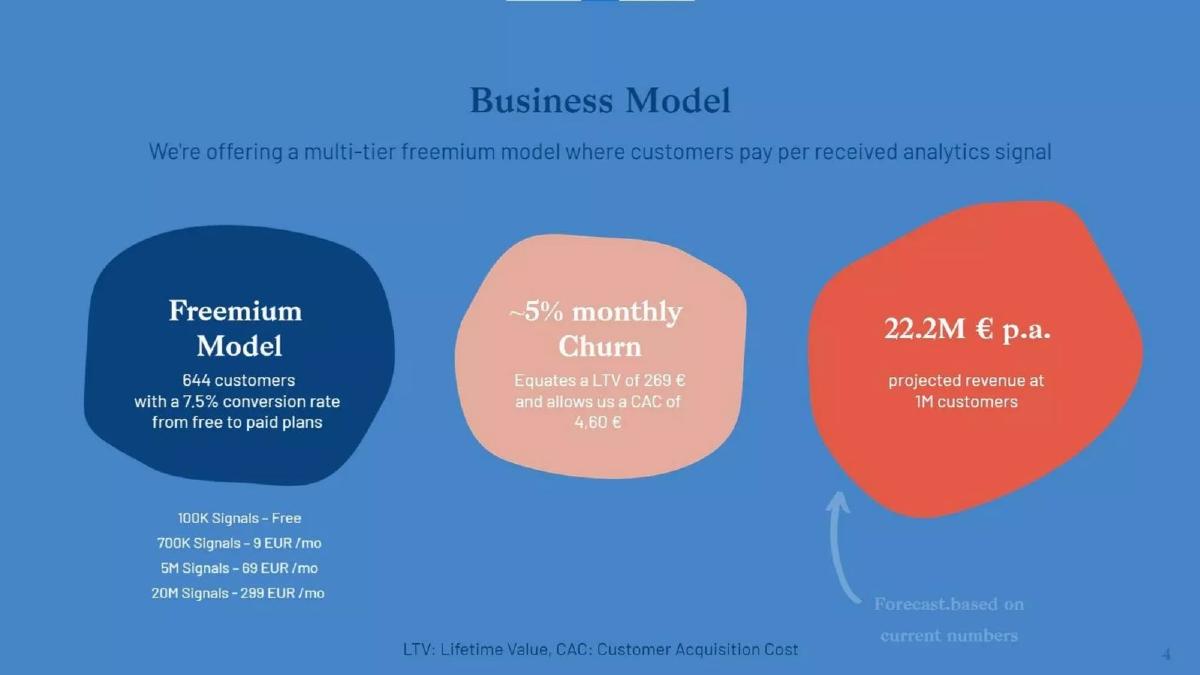
App analytics priced per received signal. "Business Model" slide in a 14-page deck.
TelemetryDeck deck, slide 4. Exact stored slide matched to this analysis.
Our analysis: It lists every tier price and labels the projection as a forecast, which most slides in this set do not.
Evidence and limitation: "Customers" is used for both current and projected accounts. By our calculation the stated LTV and churn give about 13.45 € a month per payer, and neither reading of "1M customers" reproduces 22.2M €.
What a founder can adapt: Use one unit for free and paying accounts and state the tier mix behind the projection.
Supporting analysis
What the deck claims: "Freemium Model: 644 customers with a 7.5% conversion rate from free to paid plans"; tiers "100K Signals – Free", "700K Signals – 9 EUR /mo", "5M Signals – 69 EUR /mo", "20M Signals – 299 EUR /mo"; "~5% monthly Churn: Equates a LTV of 269 € and allows us a CAC of 4,60 €"; "22.2M € p.a. projected revenue at 1M customers", labelled "Forecast based on current numbers".
Presentation choice: It lists every tier price and labels the projection as a forecast, which most slides in this set do not.
When it does not fit: "Customers" is used for both current and projected accounts. By our calculation the stated LTV and churn give about 13.45 € a month per payer, and neither reading of "1M customers" reproduces 22.2M €.
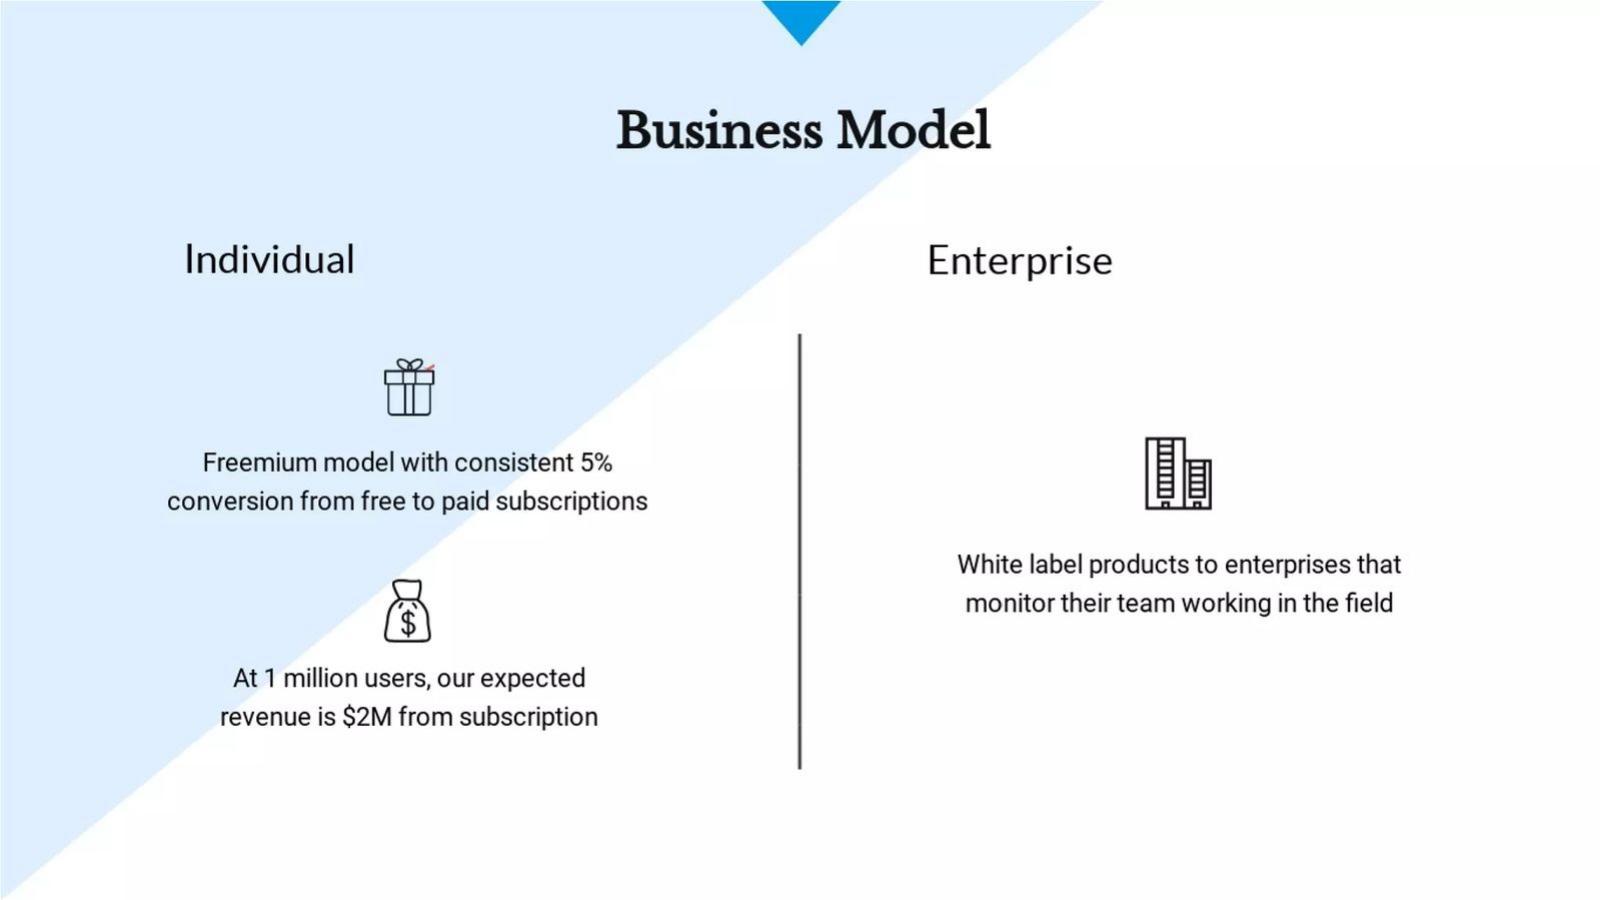
Field-team software with individual and enterprise plans. "Business Model" slide in a 7-page deck.
Vind deck, slide 5. Exact stored slide matched to this analysis.
Our analysis: It separates the freemium individual plan from enterprise sales, which convert in very different ways.
Evidence and limitation: "Consistent" has no period or base, and the enterprise line has no revenue figure.
What a founder can adapt: State the individual price; the projection implies $40 a year per payer (our calculation).
Supporting analysis
What the deck claims: Individual: "Freemium model with consistent 5% conversion from free to paid subscriptions"; "At 1 million users, our expected revenue is $2M from subscription". Enterprise: "White label products to enterprises that monitor their team working in the field."
Presentation choice: It separates the freemium individual plan from enterprise sales, which convert in very different ways.
When it does not fit: "Consistent" has no period or base, and the enterprise line has no revenue figure.
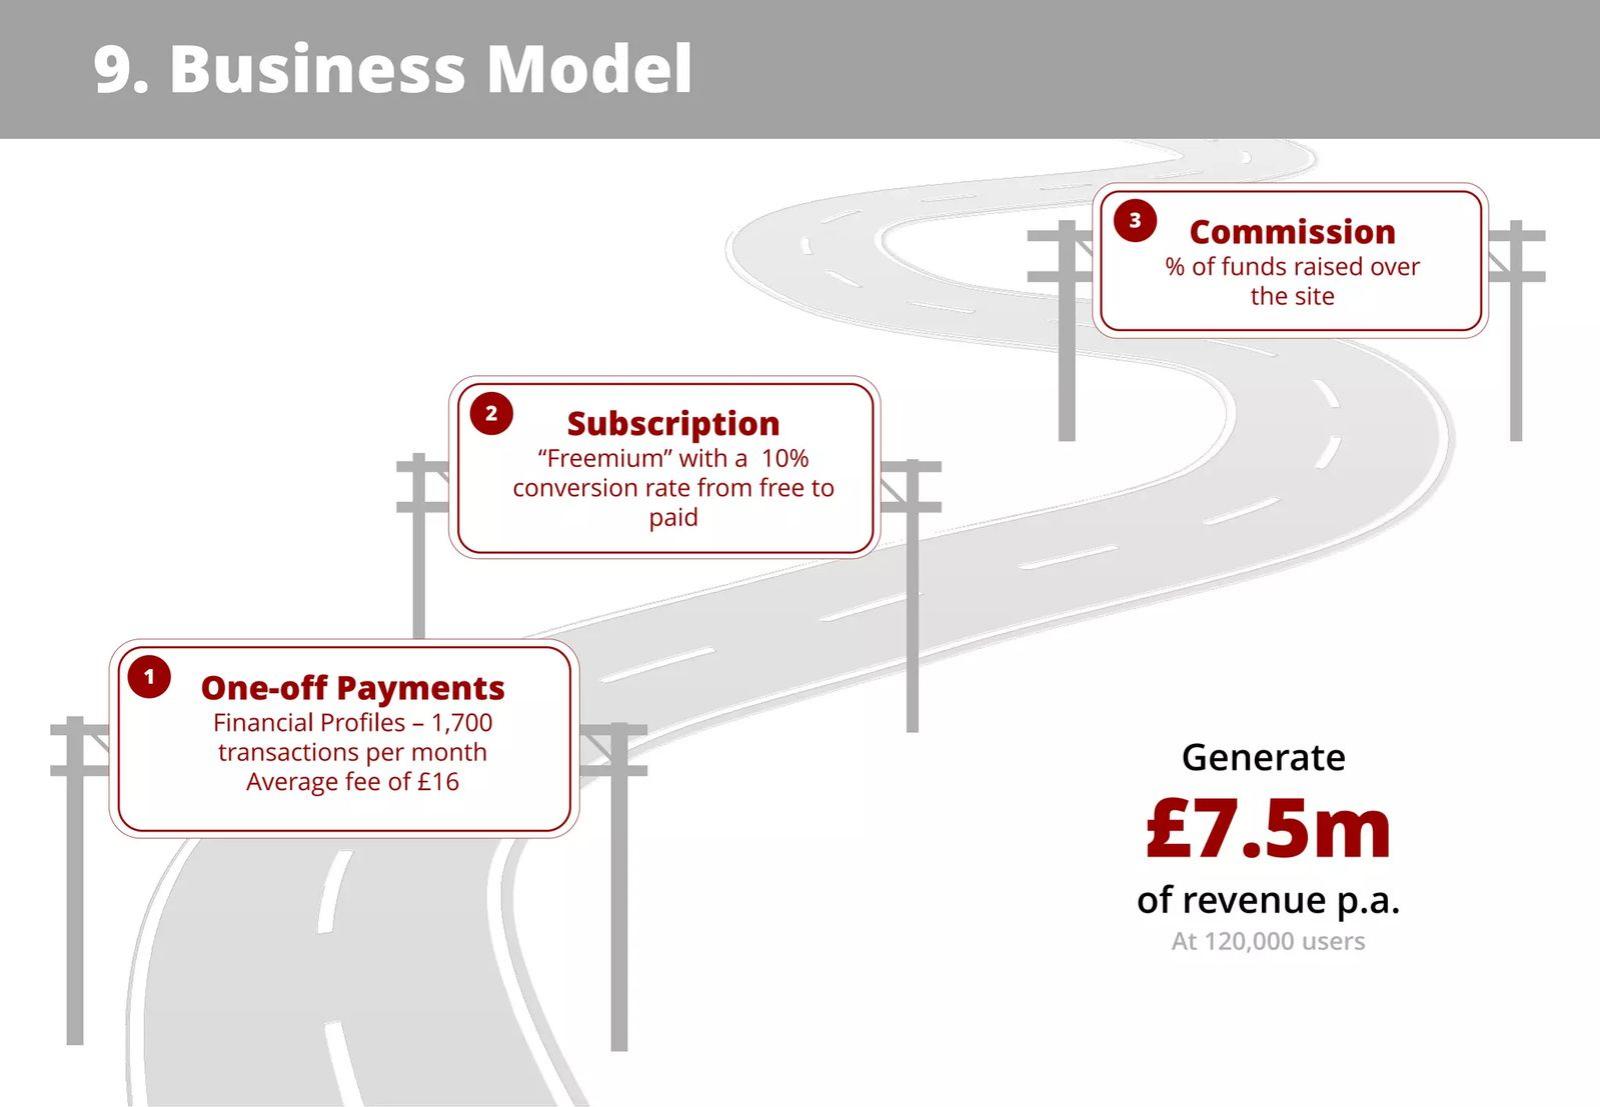
Online platform connecting companies and investors. "9. Business Model" slide in a 22-page deck.
InvestorConnected deck, slide 15. Exact stored slide matched to this analysis.
Our analysis: It separates three revenue streams, so a reader can see that freemium is only one of them.
Evidence and limitation: The slide does not say whether 10% and 1,700 transactions a month are measured or projected; 1,700 × £16 is £27,200 a month (our calculation), and the rest of the £7.5m is not broken down.
What a founder can adapt: Give the subscription price and the revenue each stream contributes to the £7.5m.
Supporting analysis
What the deck claims: Three streams: "One-off Payments: Financial Profiles – 1,700 transactions per month, Average fee of £16"; "Subscription: 'Freemium' with a 10% conversion rate from free to paid"; "Commission: % of funds raised over the site". "Generate £7.5m of revenue p.a. at 120,000 users."
Presentation choice: It separates three revenue streams, so a reader can see that freemium is only one of them.
When it does not fit: The slide does not say whether 10% and 1,700 transactions a month are measured or projected; 1,700 × £16 is £27,200 a month (our calculation), and the rest of the £7.5m is not broken down.
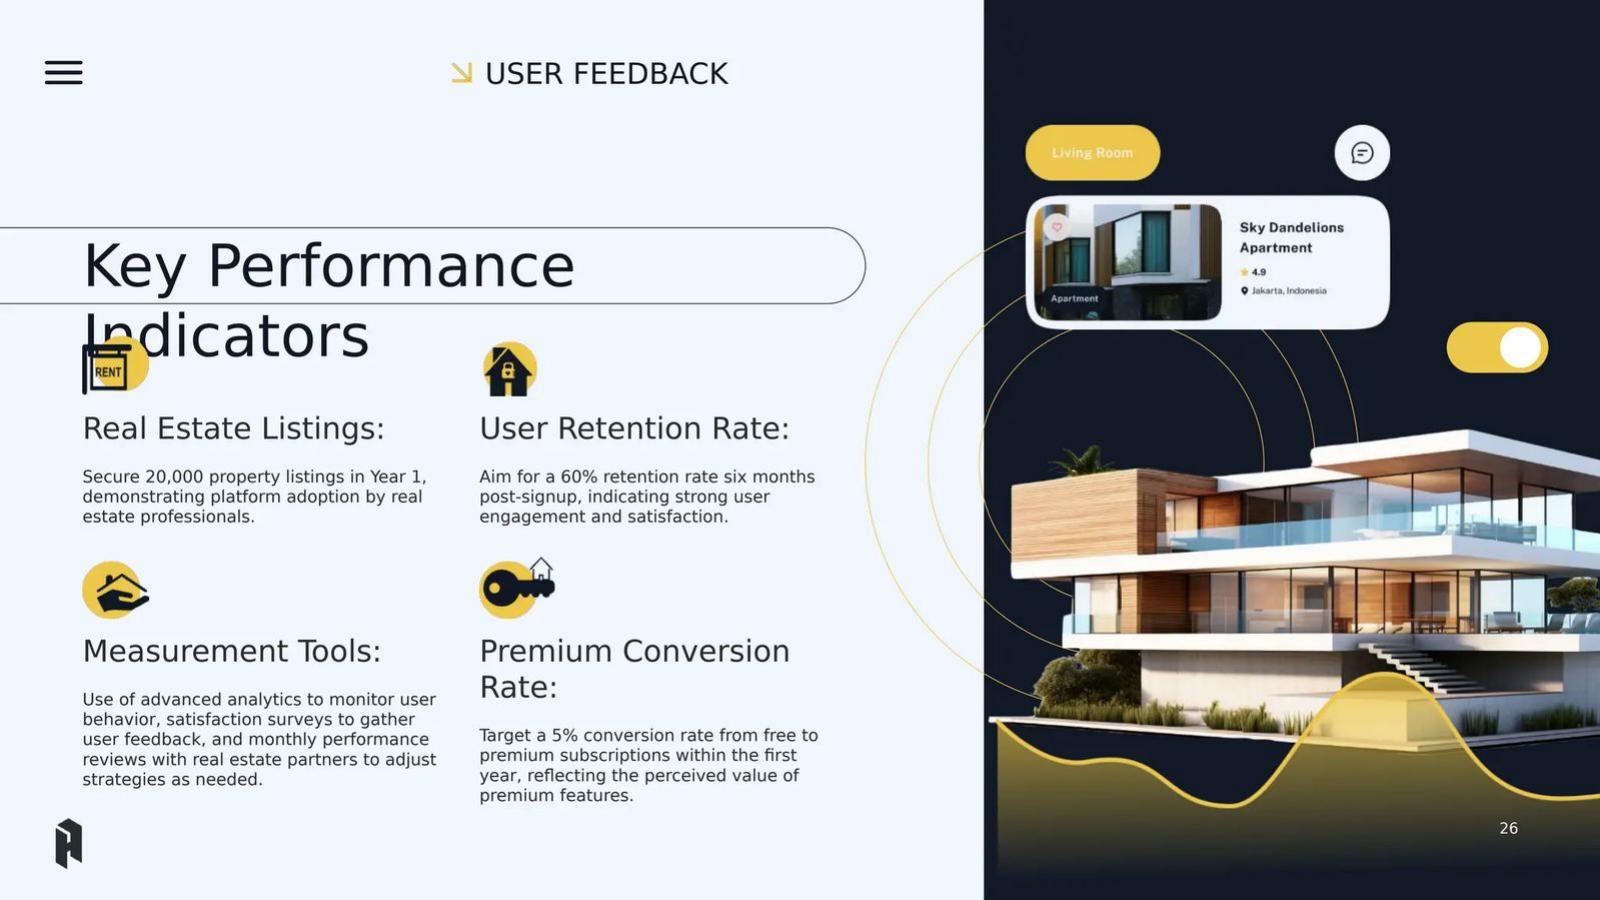
Real-estate app using AI and 3D mapping. "Key Performance Indicators" slide in a 38-page deck.
Huntly deck, slide 27. Exact stored slide matched to this analysis.
Our analysis: Every figure is labelled as a target, and the conversion target states its window (within the first year).
Evidence and limitation: The slide gives no reason for 5% beyond "perceived value", and no current figure to compare it with.
What a founder can adapt: Say what the 5% target rests on: a pricing test, an early group of users or a comparable product.
Supporting analysis
What the deck claims: "Real Estate Listings: Secure 20,000 property listings in Year 1"; "User Retention Rate: Aim for a 60% retention rate six months post-signup"; "Premium Conversion Rate: Target a 5% conversion rate from free to premium subscriptions within the first year, reflecting the perceived value of premium features."
Presentation choice: Every figure is labelled as a target, and the conversion target states its window (within the first year).
When it does not fit: The slide gives no reason for 5% beyond "perceived value", and no current figure to compare it with.
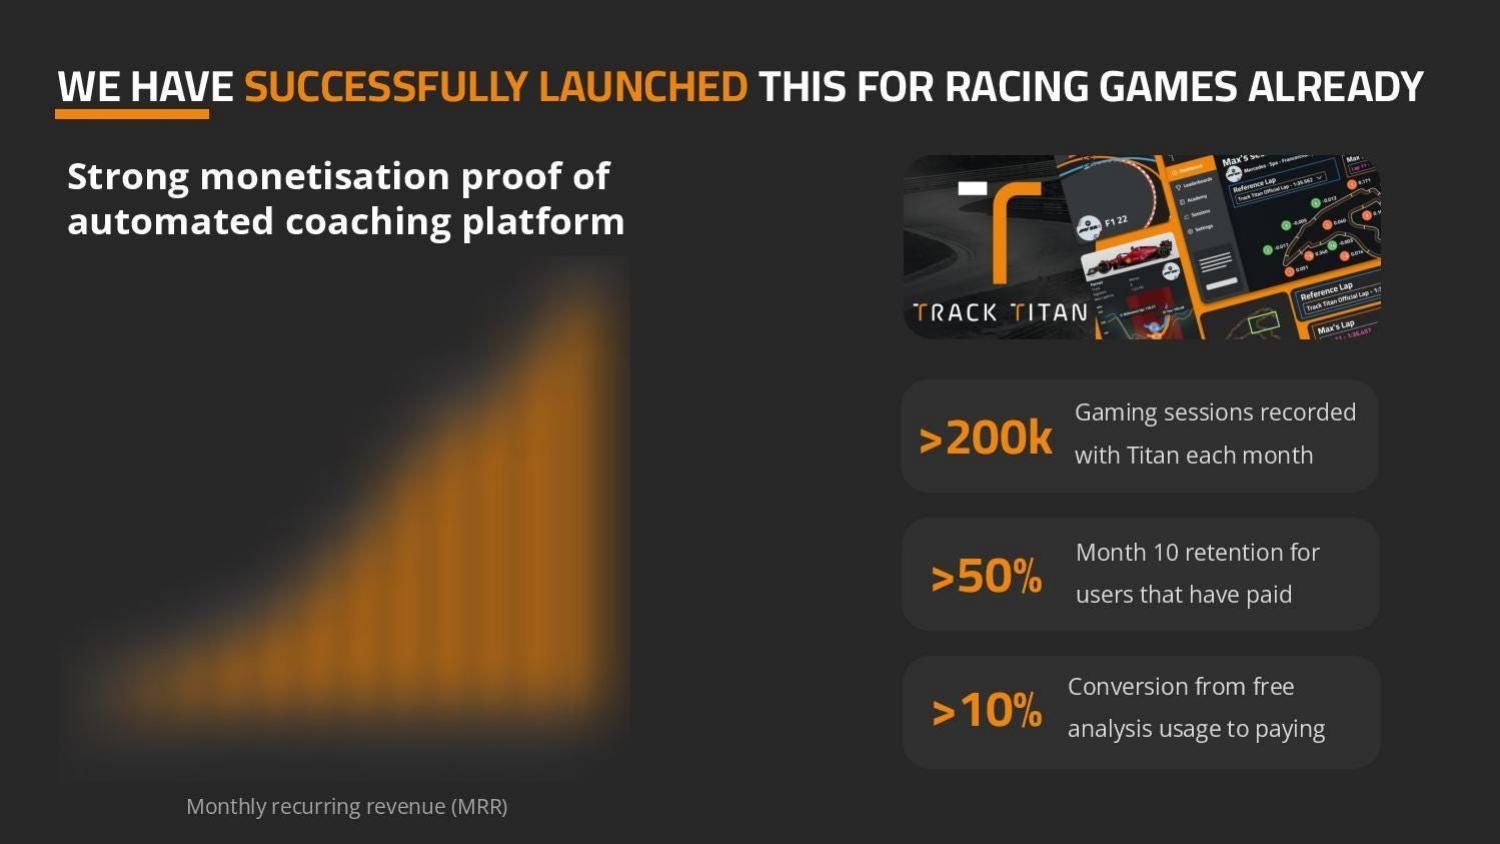
Automated coaching for sports video games. Proof slide about its earlier racing product, Track Titan, in a 13-page deck.
Titan Academy deck, slide 4. Exact stored slide matched to this analysis.
Our analysis: It defines the base (users of the free analysis) and pairs conversion with paid retention, so a reader sees both how many pay and how long they stay.
Evidence and limitation: An unlabelled chart shows a shape, not a figure; the conversion period is not stated.
What a founder can adapt: Add the number of free users behind the 10% and label the revenue chart.
Supporting analysis
What the deck claims: "We have successfully launched this for racing games already. Strong monetisation proof of automated coaching platform." ">200k Gaming sessions recorded with Titan each month"; ">50% Month 10 retention for users that have paid"; ">10% Conversion from free analysis usage to paying". A monthly recurring revenue chart has no axis values.
Presentation choice: It defines the base (users of the free analysis) and pairs conversion with paid retention, so a reader sees both how many pay and how long they stay.
When it does not fit: An unlabelled chart shows a shape, not a figure; the conversion period is not stated.
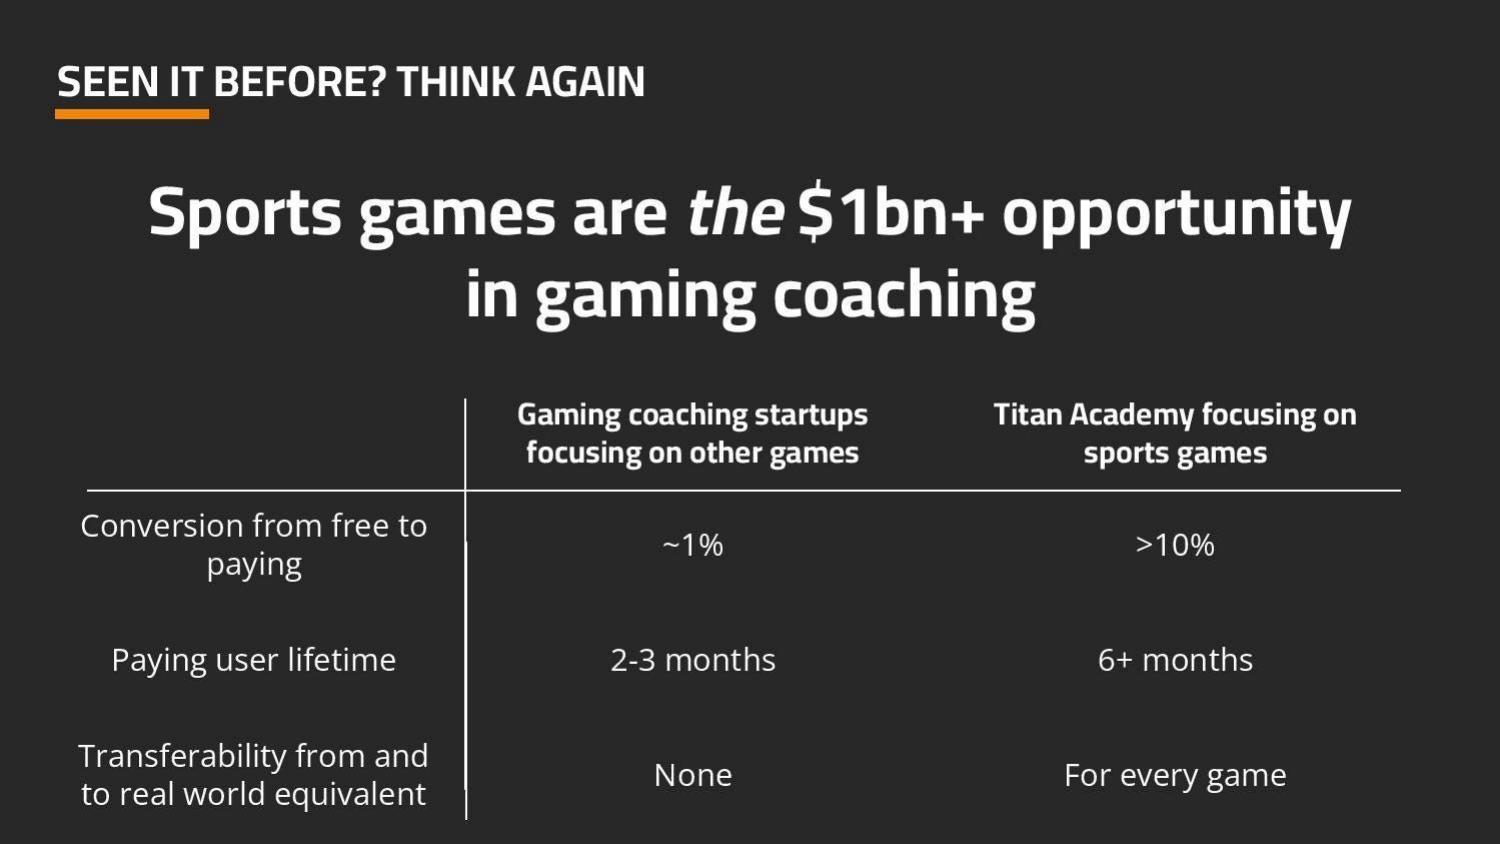
Same deck, a comparison with other gaming coaching startups.
Titan Academy deck, slide 6. Exact stored slide matched to this analysis.
Our analysis: It tells the reader what to compare the conversion rate with, which few slides do.
Evidence and limitation: The competitor figures are unsourced, and "$1bn+" has no source on the slide.
What a founder can adapt: Name the companies or the source behind ~1%, and confirm the definitions match.
Supporting analysis
What the deck claims: "Sports games are the $1bn+ opportunity in gaming coaching." Other gaming coaching startups vs Titan Academy: conversion from free to paying "~1%" vs ">10%"; paying user lifetime "2-3 months" vs "6+ months"; transferability to the real world "None" vs "For every game".
Presentation choice: It tells the reader what to compare the conversion rate with, which few slides do.
When it does not fit: The competitor figures are unsourced, and "$1bn+" has no source on the slide.
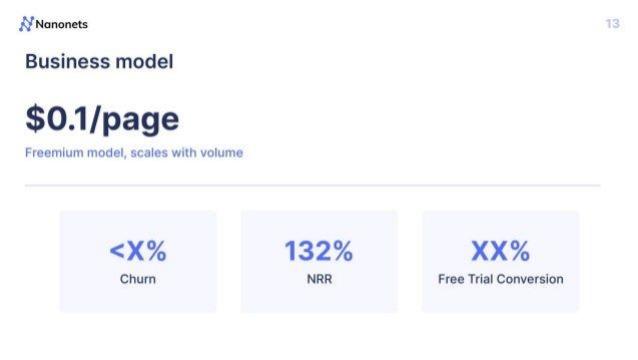
Document-processing software priced per page. "Business model" slide in a 17-page deck.
Nanonets deck, slide 13. Exact stored slide matched to this analysis.
Our analysis: Price per unit, churn, net revenue retention and trial conversion in one row are the four figures an investor needs for a usage-priced model, even with two redacted in the public copy.
Evidence and limitation: Free-trial conversion is not free-to-paid conversion; a trial ends, so do not compare it with freemium rates.
What a founder can adapt: Use the same row in your deck with every figure filled in and dated.
Supporting analysis
What the deck claims: "$0.1/page"; "Freemium model, scales with volume"; "<X% Churn"; "132% NRR"; "XX% Free Trial Conversion".
Presentation choice: Price per unit, churn, net revenue retention and trial conversion in one row are the four figures an investor needs for a usage-priced model, even with two redacted in the public copy.
When it does not fit: Free-trial conversion is not free-to-paid conversion; a trial ends, so do not compare it with freemium rates.
Each cell reports only what the slide itself states. "Not stated" means the page gives no figure.
Example
Rate
Measured or target
Base / period
Price
Projection reproducible?
HealthyAlways
11% now; 25% planned
Current and planned
Not stated
INR 3,500 a year
No projection
Buffer
2%
"Consistent"
Not stated
Implied $12/mo (our calc.)
No: $2.88M vs $3.6M (our calc.)
TelemetryDeck
7.5%
Current ("644 customers")
Not stated
Tiers 0–299 € a month
No: mix not stated
Vind
5%
"Consistent"
Not stated
Not stated (implied $40/yr)
Only with implied price
InvestorConnected
10%
Not stated
Not stated
Not stated
No breakdown of £7.5m
Huntly
5%
Target
Within first year
Not stated
No projection
Titan Academy (4)
>10%
Measured (racing product)
Users of free analysis
Not stated
No projection
Titan Academy (6)
>10% vs ~1%
Comparison
Not stated
Not stated
Competitor source not stated
TopHatch
>12%
Current
Not stated
Not stated
$200k over 12 months
Nanonets
XX% (redacted)
Free-trial conversion
Not stated
$0.1 per page
Redacted
Key Takeaways
Say whether the rate is measured or a target. Huntly: "Target a 5% conversion rate from free to premium subscriptions within the first year."
Define the free user. Titan Academy's "conversion from free analysis usage to paying" counts people who used the product, not everyone who signed up.
State the price next to the rate. Without it, a reader cannot turn "5% conversion" and "1 million users" into Vind's "$2M".
Make the projection reproducible. By our calculation Buffer's 2% of 1M users at the price implied by its own LTV and churn gives about $2.9M a year, not the $3.6M on the slide.
Keep one unit. TelemetryDeck uses "customers" for both its 644 current customers and the "1M customers" behind its projection, so a reader cannot tell whether these are free or paying.
Source a competitor comparison. Titan Academy puts "~1%" for other gaming coaching startups against its own ">10%" without saying where the 1% comes from.
Write your conversion line
Fill in what you know. Leave a field blank rather than guess, and label any target as a target.
Rate and status. What is the rate, and is it measured, a target or a model assumption?
Base. All sign-ups, sign-ups in a period, or active users? How many?
Window. Converted within how many days or months of signing up?
Price. What does a paying user pay per month or year?
Projection. Users × rate × price × 12: does it match your headline revenue?
Comparison. An earlier cohort, or a sourced figure measured the same way.
Copyable framework: [Rate]% of [n] accounts created [period] were paying within [window] (measured); at $[price]/month, [users] free users × [rate]% × $[price] × 12 = $[revenue] a year.
Illustrative example 1 — written by us
Before: Freemium with consistent 3% conversion. At 1M users, $5M revenue.
After: 3.1% of 18,400 accounts created Jan–Jun 2024 were paying within 90 days (measured). At $12/month: 1M users × 3.1% × $12 × 12 = $4.5M a year.
What improved: Placeholder figures showing the format: status, base, window and price make the projection reproducible and expose a headline that does not match.
Why this one number carries the model
A freemium business gives most of its users the product for free and earns from the few who pay. Revenue is therefore free users × conversion rate × price per paying user. A change of one percentage point in conversion can double or halve the revenue on the financials slide, which is why investors read this number closely.
Most slides in this set put the rate on the business model slide and use it immediately in a projection at a round number of users: Buffer at 1M, Vind at 1 million, TelemetryDeck at 1M, InvestorConnected at 120,000. The projection is only as strong as the rate and price beneath it, so the slide should show both and say where the rate comes from.
Measured, target or assumed
A measured rate comes from the company's own users: "11% of the 3,400 doctors who registered in 2015 upgraded within six months" would be a measured rate. A target is what the company intends to reach. An assumption is a rate used in a model with no claim that it has been achieved. All three are legitimate on a pitch deck; presenting one as another is not.
Huntly is clear: "Premium Conversion Rate: Target a 5% conversion rate from free to premium subscriptions within the first year." HealthyAlways gives both, and the pairing shows why wording matters: "Our current conversation ratio of converting free to paid subscriptions is 11%, we plan to maintain a minimum of 25% conversion ratio once we start the marketing efforts." A company cannot "maintain" 25% when its current rate is 11%. The slide describes a target more than double the current figure, and it does not explain how marketing would raise the rate rather than add more free users.
Buffer and Vind both use the word "consistent" ("consistent 2% conversion", "consistent 5% conversion"). That suggests a measured rate held over time, but neither slide says over how many months or how many users. TopHatch's ">12% free-to-paid" sits beside "$200k 12 mo. sales", which implies real users, but the base is again missing.
What counts as a free user, and over what period
Conversion can be measured against every account ever created, against accounts created in a period, or against active users only. The first gives the lowest rate; the last the highest. Titan Academy's page 4 is the most specific: "Conversion from free analysis usage to paying", which counts only people who used the analysis feature.
Time matters as much. Many users upgrade weeks or months after signing up, so the share who have converted rises as a group of sign-ups ages. Huntly's target specifies "within the first year"; no measured rate in this set states its period.
A useful line names the base and window: "Of 12,000 accounts created in Q1, 4.1% were paying by the end of Q2; of accounts active in their first week, 9.8%." Two rates side by side show investors both the funnel and the quality of sign-ups.
Checking the revenue arithmetic
When a slide gives a rate, a user count, a churn rate and a lifetime value, a reader can check whether they agree. Buffer's page 7 states: "consistent 2% conversion from Free to Paid plans", "5% churn equates to a LTV of $240 and allows us to pay up to $5 to acquire a free user", and "At 1M users, our projected revenue is $3.6M".
Our calculation, assuming the 5% churn is monthly and LTV is monthly revenue per payer divided by churn: $240 × 5% = $12 a month per paying user. 2% of 1M users is 20,000 paying users; at $12 a month that is $2.88M a year. The slide says $3.6M, which would need $15 a month per payer or 2.5% conversion. The $5 acquisition figure does agree: 2% × $240 = $4.80 of lifetime value per free user. The slide does not say which assumption differs in the $3.6M figure; it may include a price mix or growth the slide does not show.
TelemetryDeck's page 4 gives "644 customers with a 7.5% conversion rate from free to paid plans", "~5% monthly churn" with "LTV of 269 €" and "CAC of 4,60 €", and "22.2M € p.a. projected revenue at 1M customers" marked "Forecast based on current numbers". Our calculation: 269 € × 5% ≈ 13.45 € a month per payer. If 1M customers are all users and 7.5% pay, that is 75,000 payers and about 12.1M € a year; if 1M are all paying, about 161M €. Neither matches 22.2M €, which would need about 24.70 € a month from 75,000 payers. The tier prices listed (9, 69 and 299 € a month) could produce that average with the right mix, but the slide does not state the mix. These are our calculations; the slide's own figures cannot be reconciled from what it shows.
Vind's "At 1 million users, our expected revenue is $2M from subscription" with 5% conversion implies 50,000 payers at $40 a year each, about $3.33 a month by our calculation. The slide gives no price, so a reader cannot tell whether $40 a year is the plan's price or a blended figure.
Comparisons with other companies
Titan Academy's page 6 compares "Gaming coaching startups focusing on other games" with itself: conversion from free to paying "~1%" against ">10%", paying user lifetime "2-3 months" against "6+ months". Page 4 of the same deck supports its own side with ">10% Conversion from free analysis usage to paying" and ">50% Month 10 retention for users that have paid", from its racing product Track Titan.
The comparison is persuasive only if the ~1% is sourced and measured the same way. The slide does not say which companies, or whether their 1% counts all sign-ups while Titan's counts users of the analysis feature. If you compare, name the source and the definition, or compare with a published range rather than a single unnamed figure.
When the figure is redacted
Nanonets' business model slide shows "$0.1/page", "Freemium model, scales with volume", "<X% Churn", "132% NRR" and "XX% Free Trial Conversion". The public copy hides the conversion figure while leaving net revenue retention visible.
Redacting for a public release is common and reasonable. For a founder studying the slide, the lesson is the layout: price per unit, churn, net revenue retention and trial conversion in one row give an investor the four numbers needed to judge a usage-priced freemium model. "Free trial conversion" also differs from free-to-paid: a trial ends, a free plan does not, so trial conversion rates are usually much higher and should not be compared directly.
How to present your own rate
Put the measured rate first, with its base and window, then the price and the resulting revenue per free user. If you have only a target, label it and explain what it rests on (an early cohort, a pricing test, a comparable product). If the financials use a different rate from the one you have measured, show both and explain the gap.
Then show the projection's arithmetic in one line. "1M free users × 2.5% × $12/month × 12 = $3.6M" is easy to check and easy to believe; "$3.6M at 1M users" asks the reader to trust numbers they cannot see. The line also keeps you consistent: if the churn, LTV and conversion on the same slide do not produce the headline, a reader will notice, as our checks of Buffer and TelemetryDeck show.
Common mistakes
Target shown as fact. Label targets and assumptions; keep them apart from measured rates.
No base. A rate without the number of free users measured cannot be judged.
No window. Conversion rises as sign-ups age; say how long users had to convert.
No price. Without the price, a reader cannot reproduce the revenue projection.
Projection that does not add up. Check that rate, price, churn and LTV on the slide produce the headline revenue.
Trial and freemium mixed. Free-trial conversion is usually much higher than free-plan conversion; do not compare them.
Diagnostic checklist
The rate is labelled measured, target or assumption.
The base (which free users, how many) is stated.
The conversion window is stated.
The price per paying user is on the slide.
The revenue projection can be reproduced from the slide's own numbers.
Any comparison with other companies is sourced and uses the same definition.
Frequently asked questions
What free-to-paid conversion rate should I show in a pitch deck?
Show the rate you have measured, with its base and window, rather than a benchmark. The rates in this set range from 2% (Buffer) to over 12% (TopHatch), but they are measured on different bases and for different products, so they are not comparable with each other or with yours.
Can I use a target conversion rate before launch?
Yes, if it is labelled. Huntly writes "Target a 5% conversion rate from free to premium subscriptions within the first year"; add what the target rests on, such as a pricing test or an early group of users.
How do I check my freemium revenue projection?
Multiply free users × conversion rate × monthly price × 12 and compare with the headline. If you state LTV and churn, monthly price per payer is LTV × monthly churn. Our checks of Buffer and TelemetryDeck show the stated figures do not reproduce their headline revenue.
Is free-trial conversion the same as free-to-paid conversion?
No. A trial ends and forces a decision; a free plan does not. Nanonets reports "Free Trial Conversion", which should not be compared with the freemium rates on the other slides here.
How we chose these examples
Search (2026-09-30): the durable corpus index (docs/seo/artifacts/corpus-search, 70,729 unique pages, deduplicated by deck-file sha256 + page) was searched for free-to-paid, trial-to-paid, freemium conversion and free users near a percentage (20 hits across two searches, some pages overlapping). Existing guides were read first: go-to-market, devtools traction, media business model, product and AI go-to-market guides mention free-to-paid conversion only in passing, and the unit economics guide covers LTV and CAC but not the conversion step, so this guide asks a question none of them answers.
Eleven candidate pages were rendered from the original public deck files and read from the images; ten are used: HealthyAlways 25, Buffer 7, TelemetryDeck 4, Vind 5, InvestorConnected 15, Huntly 27, Titan Academy 4 and 6, TopHatch 4, Nanonets 13. Titan Academy appears twice because page 4 defines its own rate and page 6 compares it with unnamed competitors. Ten images were stored from the original PDFs on 2026-09-30.
Left out: The Plate 5 (a 1% follower-to-subscriber funnel describing its customers' businesses, not its own users), TelemetryDeck-style projections without any rate, Startupflux 8 and Task Pigeon 12 (conversion named as a goal with no figure), and Lightpanda 16 ("free to paid" refers to advertising). Refund and product-return rates were researched in an earlier run and set aside for lack of founder evidence; LTV-to-CAC ratios are already covered by the unit economics guide.
All calculations are ours, labelled, and state their assumptions (for Buffer and TelemetryDeck, that churn is monthly and LTV equals monthly revenue per payer divided by churn). How we built this: drafted and checked with AI assistance (editorial model review against the original slide images); no human editor has reviewed this guide.