Climatiq’s Series A deck is a masterclass in positioning a company as 'infrastructure' rather than just another SaaS tool. By securing 190+ B2B software customers and maintaining a churn rate of less than 1%, the company demonstrates that its API-first approach is becoming the plumbing for the carbon accounting industry. The deck emphasizes a massive data foundation—over 200,000 vetted emission factors—and an AI computation engine that automates Scope 1, 2, and 3 reporting. The narrative moves from the immediate need for ESG compliance to a future where carbon metrics drive every business dec…
Key takeaways
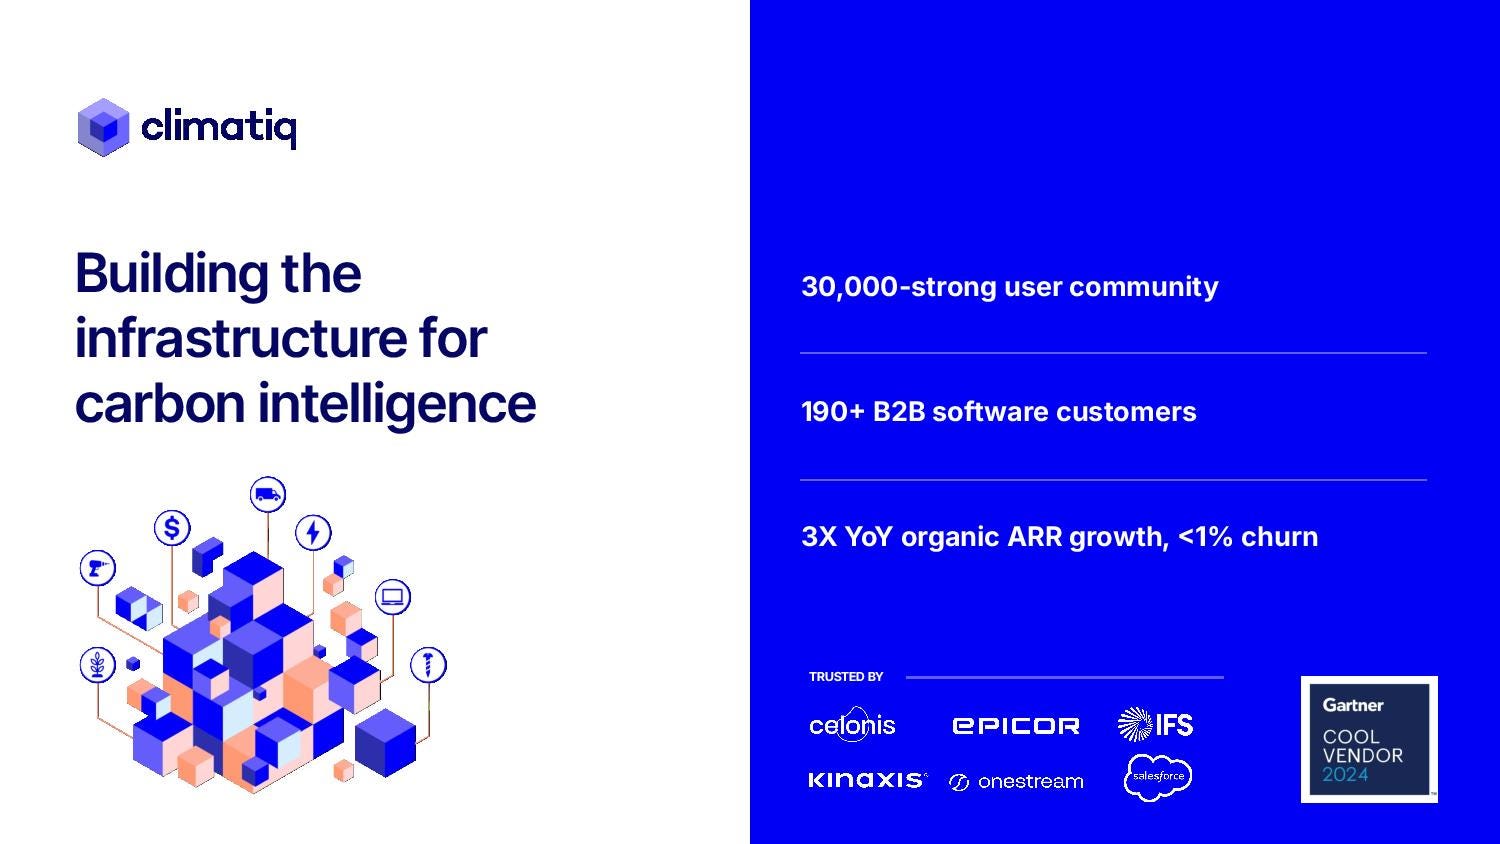
- Climatiq reports a 30,000-strong user community and over 190 B2B software customers on slide 1.
- The company claims 3X year-over-year organic ARR growth with less than 1% churn as of slide 1.
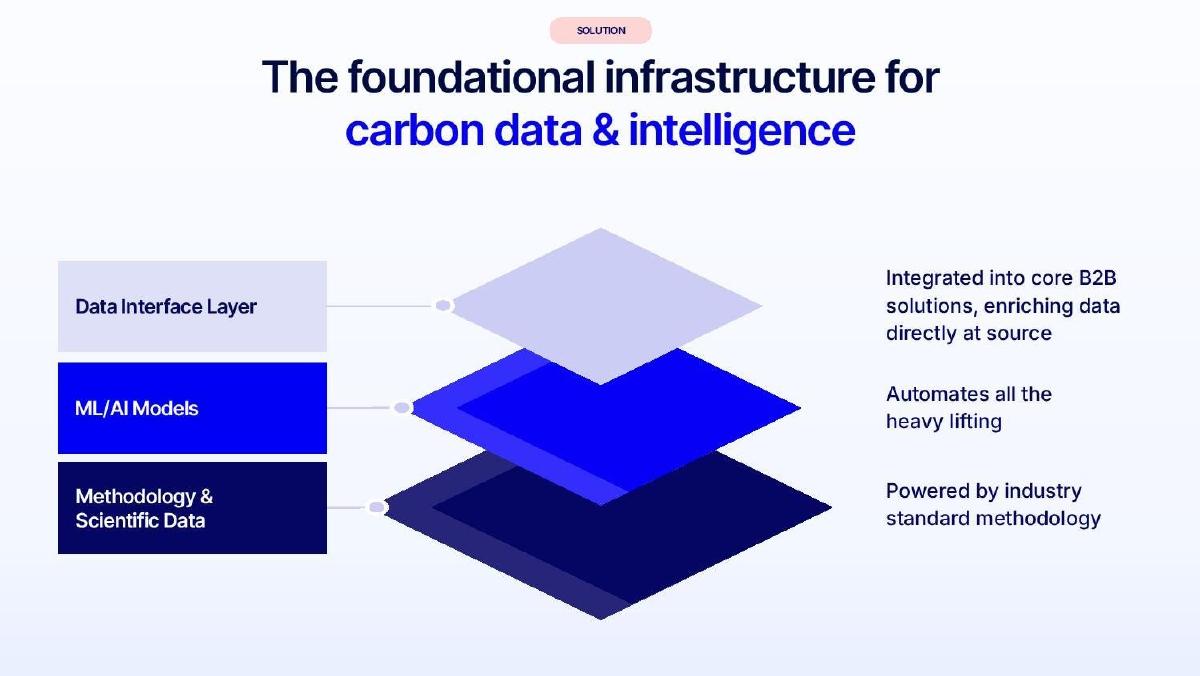
- The solution is presented as a three-layer stack: Data Interface Layer, ML/AI Models, and Methodology & Scientific Data on slide 3.
- Climatiq positions itself against 'Vertical Players' by offering a 'Sticky API-first solution' that creates a network effect with each integration (slide 4).
- The data foundation includes 200,000+ vetted emission intensity factors across 60+ datasets and 300+ regions (slide 5).
- The platform is expanding its data library by approximately 20% new factors month-over-month according to slide 5.
- Climatiq raised €1.6M in Pre-Seed (Q2-21) and €6M in Seed (Q2-22) before seeking €10M for this Series A (slide 6).
- The long-term vision is to become the 'system of record' where any tool relying on carbon data integrates with their platform (slide 6).
Climatiq Series A Teardown: The Infrastructure Play
Climatiq’s Series A pitch deck is a concise, 11-slide presentation that successfully raised $11.6M in 2024. The deck is notable for its clean aesthetic and its refusal to get bogged down in the 'climate catastrophe' narrative, instead focusing on the technical and economic reality of carbon accounting as a mandatory business function. By positioning itself as the 'infrastructure for carbon intelligence,' Climatiq moves away from the crowded ESG dashboard market and into the more defensible territory of data APIs.
Slide 1: The Hook and Traction
The cover slide does more than just introduce the company; it serves as a summary of the entire investment thesis. Climatiq leads with its vision: 'Building the infrastructure for carbon intelligence.' This is a critical distinction from 'carbon accounting software.' Infrastructure implies a foundation that other companies build upon, suggesting a much larger Total Addressable Market (TAM).
The right side of the slide provides immediate validation with three high-impact bullet points: a 30,000-strong user community, 190+ B2B software customers, and 3x YoY organic ARR growth with less than 1% churn. The mention of 'organic' growth is a subtle nod to capital efficiency, and the sub-1% churn is a powerful indicator of product-market fit in the enterprise space. The slide also features a 'Gartner Cool Vendor 2024' badge and logos from major enterprise players like Salesforce and Celonis, establishing instant credibility.
Slide 2: The Market Shift
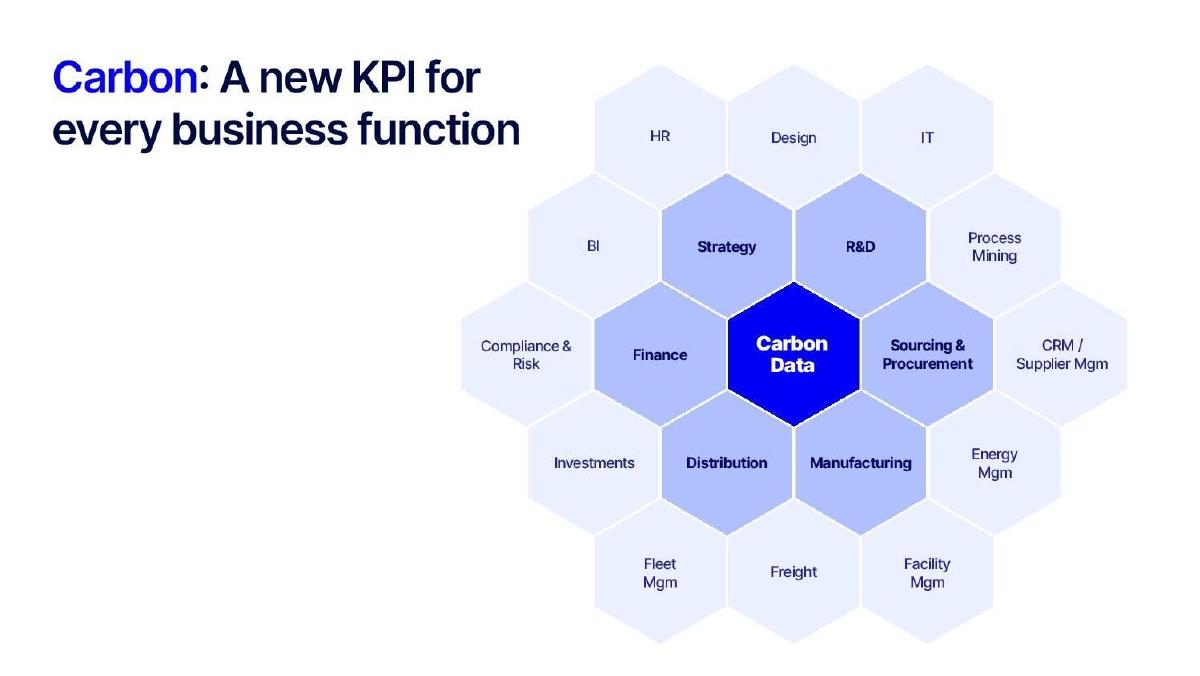
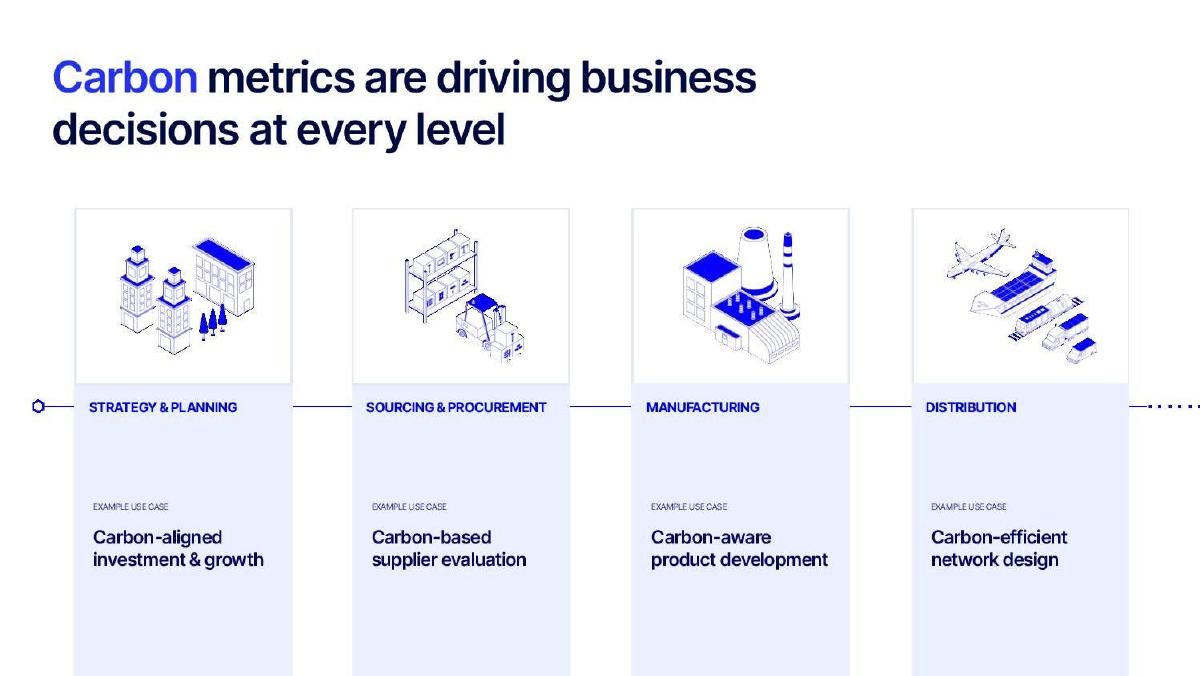
Slide 2 addresses the 'Why Now?' and the scope of the problem. It argues that carbon metrics are no longer just for sustainability reports; they are driving business decisions at every level. The slide breaks this down into four key areas: Strategy & Planning, Sourcing & Procurement, Manufacturing, and Distribution. Each area is paired with a specific use case, such as 'Carbon-based supplier evaluation' and 'Carbon-efficient network design.' This slide successfully expands the utility of the product beyond compliance, framing it as an operational necessity for modern supply chains.
Slide 3: The Solution Architecture
This slide visualizes the product as a three-layer stack. At the base is 'Methodology & Scientific Data,' powered by industry-standard methodology. The middle layer consists of 'ML/AI Models' that automate the 'heavy lifting' of data processing. The top layer is the 'Data Interface Layer,' which integrates into core B2B solutions. This architectural view reinforces the 'infrastructure' positioning. It tells the investor that Climatiq isn't just a front-end; it's a deep-tech stack that enriches data 'directly at source.'
Slide 4: Competitive Advantage and Ecosystem
Slide 4 is a strategic map of the carbon intelligence landscape. It categorizes the market into Self-Build, Consultancies, ESG SaaS, and SaaS Platforms. Climatiq places itself at the bottom, providing the 'Data, APIs, and integrations' that support all these categories. This is a classic 'picks and shovels' strategy. Instead of competing with ESG SaaS providers, Climatiq aims to be the engine that powers them.
The 'Our Advantage' section on the right lists four points: comprehensive data, a 'sticky' API-first solution, an established brand, and a network effect that 'grows stronger with each integration.' The network effect claim is particularly important for a Series A, suggesting that as more companies use Climatiq, the data becomes more accurate and the platform becomes more indispensable.
Slide 5: The Toolkit (Data and Calculation)
This slide gets into the technical weeds of the 'how.' It splits the offering into 'Data' and 'Calculate.' The 'Data' side boasts 200,000+ vetted emission intensity factors across 60+ datasets and 300+ regions, with a 20% MoM growth in new factors. This volume of data represents a significant moat; replicating this library would be a massive undertaking for a competitor.
The 'Calculate' side highlights the AI-powered computation engine for Scope 1, 2, and 3 emissions. It specifically mentions 'product-level emissions (PCF)' and 'built-in methodology compliance with full audit trails.' The inclusion of code snippets and map visualizations at the bottom of the slide emphasizes that this is a developer-first tool, further distancing it from generic ESG reporting software.
Slide 6: The Roadmap and The Ask
The final visible slide provides a timeline of the company’s history and its future goals. It shows a clear progression: Pre-Seed (Q2-21) to build the core platform, Seed (Q2-22) for product dev and growth, and the current Series A to 'Scale GTM & AI.' The slide explicitly states they are 'Raising €10M' (which aligns with the reported $11.6M USD round).
The 'Series B+' column outlines the long-term vision: 'Establish the system of record.' The goal is to become the 'ground truth' for environmental data, where any tool relying on carbon data integrates with their platform. This is a bold claim, but it is supported by the traction and infrastructure positioning established in the previous slides. The slide also lists an impressive roster of angel investors from companies like Spotify, Indeed, and Datadog, which provides a final layer of social proof.
What Works in the Climatiq Deck
1. Clear Positioning: The deck never wavers from its 'infrastructure' and 'API-first' messaging. This is a highly attractive position for VCs because it suggests high switching costs and the potential to become a standard in the industry.
2. Metric-Forward Approach: Leading with 3x growth and 3. Moat Visualization: By detailing the 200,000+ emission factors and the 20% MoM growth in data, Climatiq clearly illustrates its competitive moat. It’s not just about the code; it’s about the proprietary and vetted data library.
4. Ecosystem Thinking: Slide 4 shows that the founders understand the market dynamics. They aren't trying to fight everyone; they are trying to enable everyone. This 'partner-first' approach is a scalable way to capture market share.
What is Missing from the Climatiq Deck
1. Team Slide: The provided slides do not include a dedicated team slide. While the angel investors are listed, the backgrounds of the founders and the 'Scientific Advisory Board' mentioned on slide 6 are not detailed. For a Series A, the pedigree of the technical and scientific team is usually a major selling point.
2. Detailed Unit Economics: While churn is mentioned, there is no data on Customer Acquisition Cost (CAC), Lifetime Value (LTV), or payback periods. Investors at the Series A stage typically want to see the 'money in, money out' mechanics of the sales engine.
3. Case Studies: While logos like Salesforce and Celonis are shown, the deck lacks a deep dive into how a specific customer uses the API to solve a complex problem. A 'before and after' story could have made the value proposition more tangible.
4. Financial Projections: The deck focuses on the past (traction) and the future (vision) but lacks a slide showing the projected revenue growth or the specific allocation of the €10M raise beyond 'Scale GTM & AI.'
Founder Takeaways: How to Copy the Climatiq Strategy
1. Sell the 'Plumbing': If you are building a B2B tool, consider if you can position it as infrastructure rather than an application. Infrastructure companies often command higher valuations because they are harder to replace. Use Climatiq's 'Data Interface Layer' framing to show how you fit into existing workflows.
2. Use 'Traction as Introduction': Don't wait until slide 10 to show your numbers. If your growth is impressive, put it on the cover. It changes the tone of the entire meeting from 'convincing' to 'validating.'
3. Define Your Moat Quantitatively: Don't just say you have a 'large database.' Say you have '200,000+ vetted factors growing at 20% MoM.' Specificity creates a sense of inevitability and makes it harder for investors to dismiss your competitive advantage.
4. Map the Ecosystem: Show that you understand where you sit in the value chain. By identifying 'Vertical Players' and 'ESG SaaS' as distinct from your own offering, you demonstrate market maturity and help investors categorize your business correctly.
5. Focus on 'Stickiness': In a crowded market, churn is the ultimate truth-teller. Highlighting a churn rate of less than 1% is the most effective way to prove that your product is a 'must-have' rather than a 'nice-to-have.'
Frequently asked questions
- What is Climatiq's core product offering?
- Climatiq offers an API-first carbon intelligence platform. As shown on slide 5, this includes a 'Data' component with 200,000+ emission factors and a 'Calculate' component featuring an AI-powered computation engine for Scope 1, 2, and 3 emissions. It is designed to be embedded into existing B2B software rather than serving as a standalone end-user dashboard.
- How does Climatiq differentiate itself from other ESG SaaS companies?
- According to slide 4, Climatiq views ESG SaaS and Vertical Players as potential partners or customers rather than direct competitors. They position themselves as the underlying infrastructure ('Data, APIs, and integrations') that provides the reliability and flexibility to support any industry at scale, whereas vertical players often focus on point solutions for specific sectors like travel or freight.
- What are the key growth metrics mentioned in the deck?
- Slide 1 highlights three primary metrics: a 30,000-strong user community, 190+ B2B software customers, and 3x year-over-year organic ARR growth. Notably, they report a churn rate of less than 1%, which is exceptionally low for the enterprise software sector.
- What is the stated goal for the Series A funding?
- Slide 6 indicates the Series A focus is to 'Scale GTM & AI.' The company sought to raise €10M (reported as $11.6M USD) to expand its team and further develop its AI features, moving toward a 'Series B+' goal of becoming the definitive system of record for environmental data.
- Who are some of Climatiq's notable customers and investors?
- Slide 1 lists 'Trusted By' logos including Celonis, Epicor, IFS, Kinaxis, Onestream, and Salesforce. Slide 6 lists previous investors such as Cherry Ventures, Singular, and AngelInvest, along with angels from Spotify, Indeed, Lufthansa, Snyk, and Datadog.