Clearbanc's pitch deck is a masterclass in category creation, framing their revenue share model not just as a loan, but as a 'new asset class.' By targeting the inefficiency of using expensive equity to fund predictable ad spend, Clearbanc tapped into a massive E-commerce market. The deck leans heavily on high-growth metrics, including a 940% CAGR and a projected $1B in funding for 2019. It effectively uses social proof through high-profile Venture Partners and detailed case studies like Vinebox, which saw a 1,101% ROI. While it lacks traditional unit economics like CAC or LTV for Clearbanc i…
Key takeaways
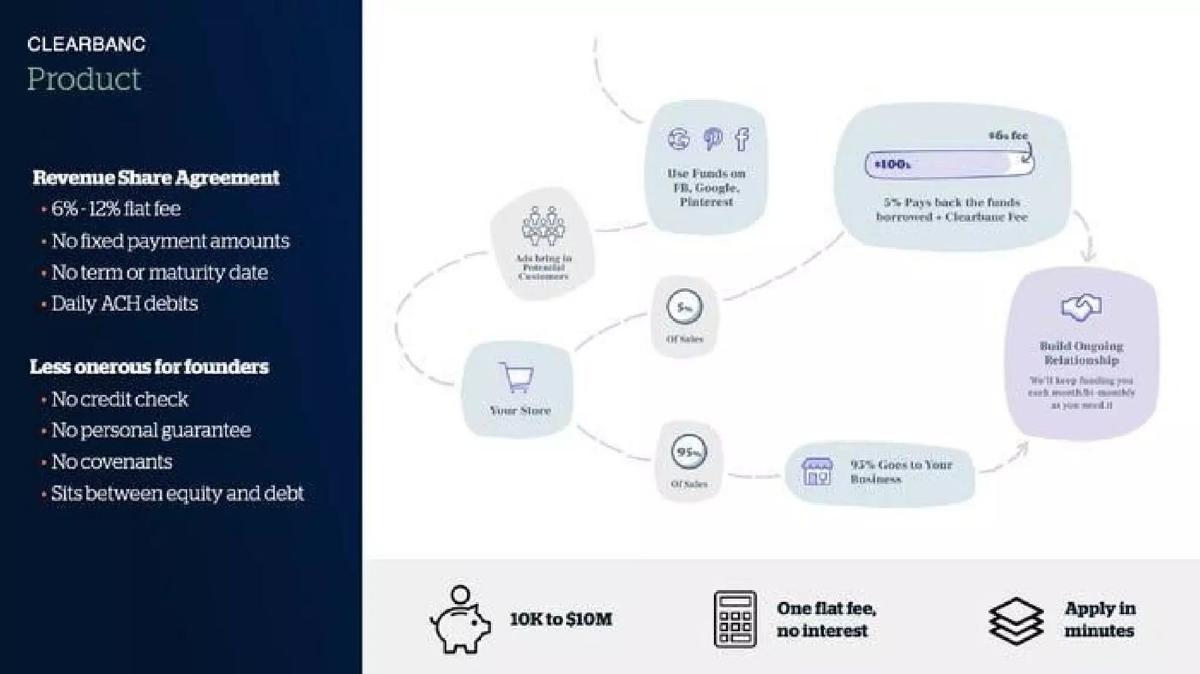
- Clearbanc positions its product as a 'Revenue Share Agreement' with a 6%-12% flat fee and no fixed payment amounts (Slide 6).
- The company demonstrated massive traction with a 940% CAGR and a projection to fund $1B in 2019 (Slide 7).
- The deck highlights a significant market opportunity, noting that E-commerce brands spend 40%-60% of revenue on customer acquisition (Slide 10).
- Clearbanc emphasizes its social impact, stating they have funded 8X more women than the venture capital industry average (Slide 13).
- Risk management is addressed through a declining loss rate chart from 2018-Q1 to 2019-Q1 (Slide 14).
- The 'Venture Partners' slide features high-profile names like Gary Vaynerchuk and Ryan Hoover to build credibility (Slide 15).
- The co-founders' backgrounds are exceptionally strong, with Michele Romanow noted as the youngest 'Dragon' on CBC's Dragons' Den (Slide 16).
- Case studies in the appendix, like Vinebox, show specific outcomes such as a 595% growth in revenue after receiving $150k in funding (Slide 18).
Clearbanc: The Non-Dilutive Revolution
Clearbanc (now rebranded as Clearco) emerged as a disruptive force in the fintech and venture space by offering a third way to fund startups. This 19-slide deck was instrumental in communicating a complex financial product—revenue-based financing—as a simple, superior alternative to traditional equity and debt. The narrative is built on the premise that venture capital is 'the most expensive capital' and should not be wasted on repeatable, predictable costs like Facebook and Google ads.
The Macro Trend and Problem Statement
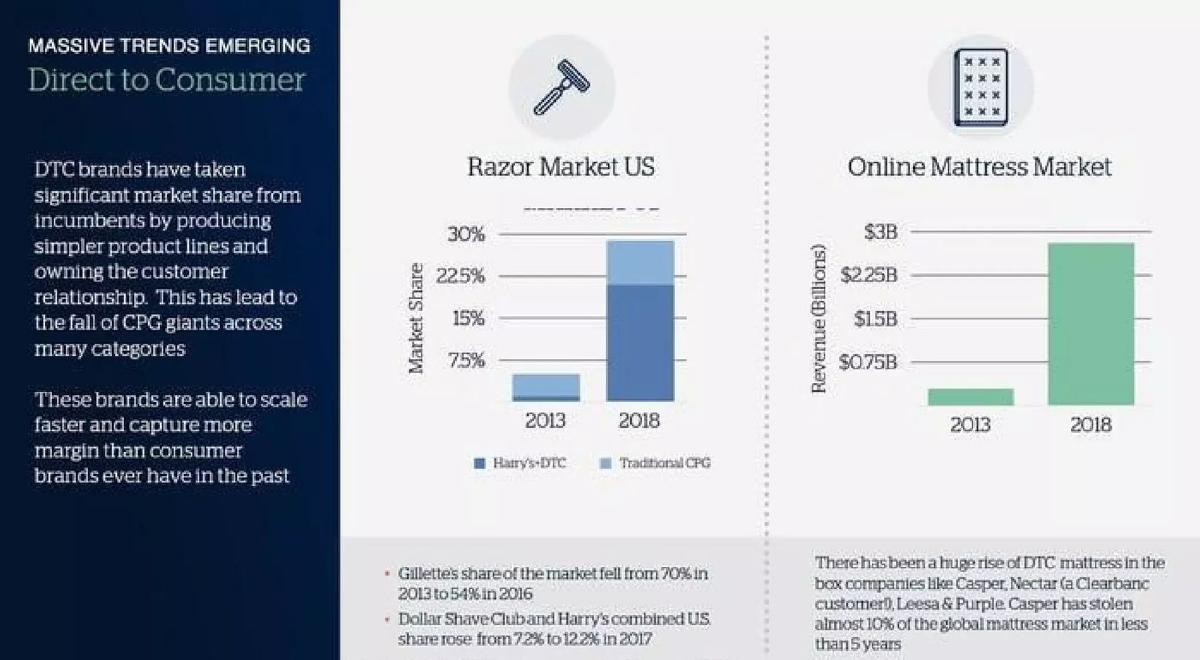
Slides 1-3: Setting the Stage The deck opens with a dark, cinematic cover slide titled 'Growth Capital for the New Economy.' It immediately moves into 'Massive Trends Emerging' on Slide 2, focusing on the explosion of Direct to Consumer (DTC) brands. It uses the Razor and Online Mattress markets as examples, noting that Gillette's market share fell from 70% in 2013 to 54% in 2016, while DTC brands like Harry's and Dollar Shave Club rose. Slide 3 broadens the scope to capital markets, highlighting that founders are staying private longer and seeking alternatives to traditional VC, evidenced by headlines about Spotify and Slack's direct listings.
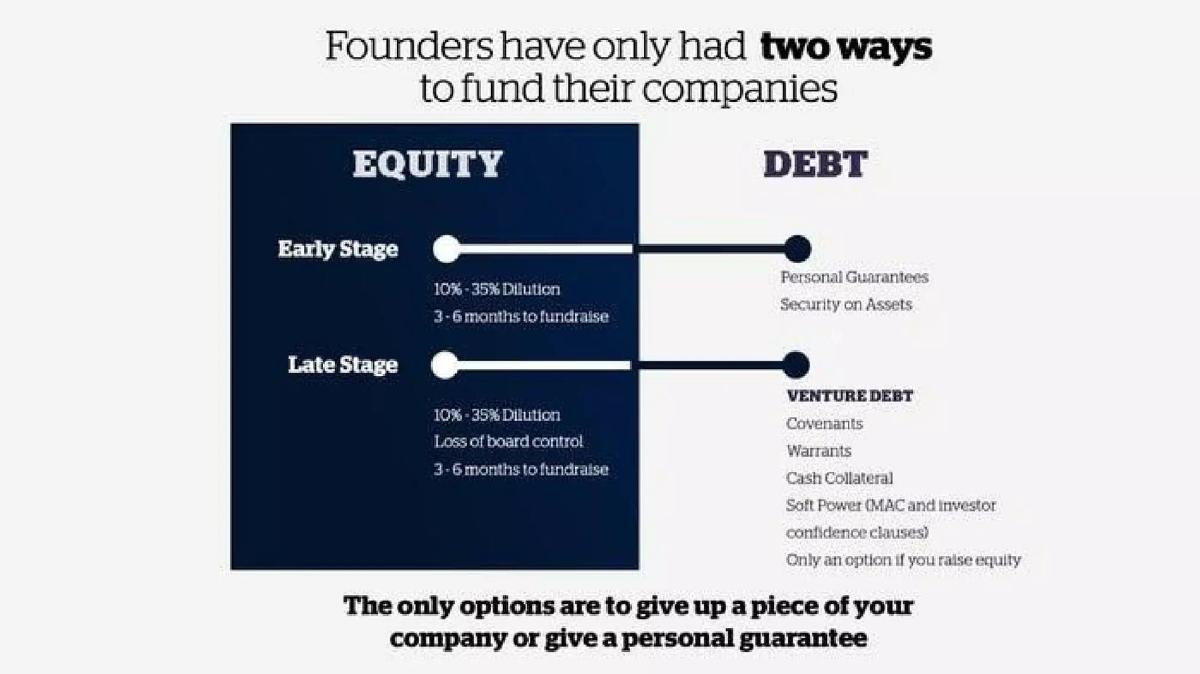
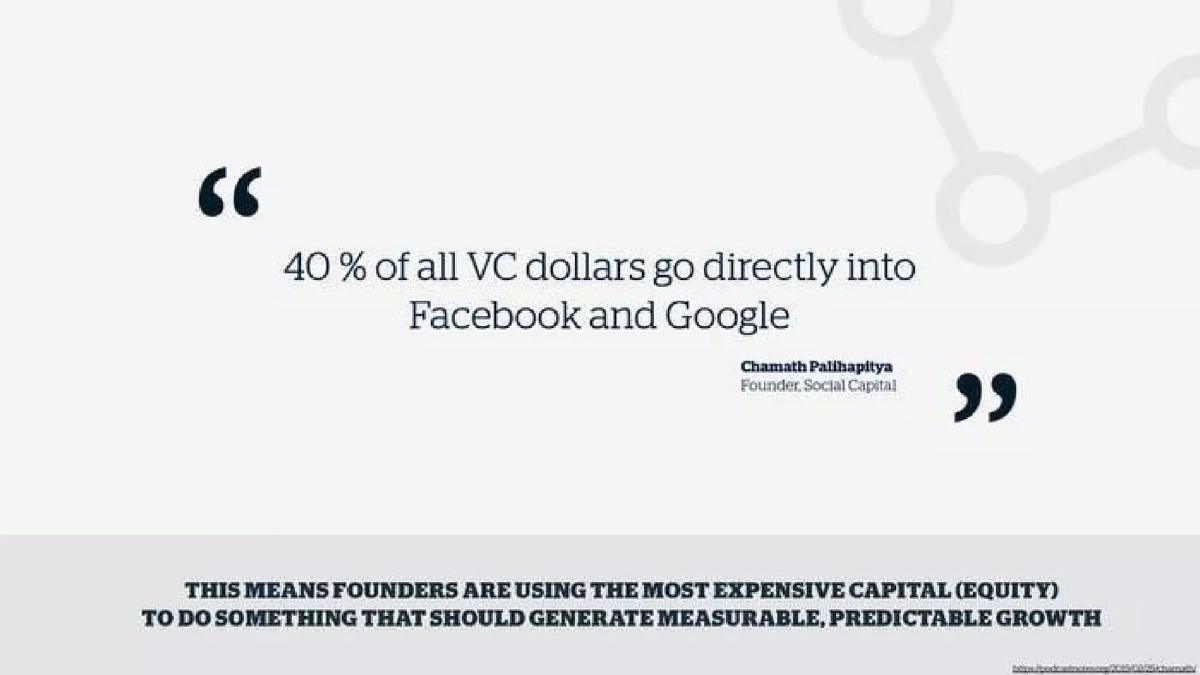
Slides 4-5: The Funding Gap Slide 4 identifies the binary choice founders previously faced: Equity (10%-35% dilution, 3-6 months to raise) or Debt (personal guarantees, security on assets). Slide 5 introduces a powerful quote from Chamath Palihapitiya: '40% of all VC dollars go directly into Facebook and Google.' This is the 'aha' moment of the deck, arguing that founders are using high-cost equity to fund predictable growth that should be financed differently.
The Solution and Product Mechanics
Slide 6: The Revenue Share Agreement This slide details the product: a 6%-12% flat fee with no fixed payment amounts, no maturity date, and daily ACH debits. It emphasizes that the product is 'less onerous' because it requires no credit check, no personal guarantee, and no covenants. A flow chart illustrates the cycle: Clearbanc provides funds, the founder uses them on ads, ads bring in customers, and a small percentage of sales (e.g., 5%) pays back the funds until the fee is met.
Slides 8-9: Cost Comparison Slide 8 is a direct comparison table. Clearbanc claims 'None' for risks, whereas Venture Capital carries the risk of losing control, and Bank Loans carry the risk of losing your house. Slide 9 reinforces this with the 'Cost of Equity' argument, using Uber's valuation growth to show that a small early equity check can eventually cost a founder over a billion dollars in value—an 'effective APR' that dwarfs Clearbanc's flat fee.
Traction and Market Opportunity
Slide 7: Explosive Growth Clearbanc presents its traction with a bar chart showing a leap from $17M funded in 2017 to a projected $1B in 2019. The slide boasts a 940% CAGR and states they have funded over 1,000 companies. This is the primary evidence that the market has accepted their 'new asset class.'
Slide 10: The TAM The Total Addressable Market is framed through E-commerce. With a $2.3T global market and $504B in the USA, Clearbanc points out that there are 1.2M global businesses doing over $100k in revenue. The key insight here is that these brands spend 40%-60% of their revenue on customer acquisition, which is Clearbanc's primary use case.
Slides 11-13: Portfolio and Impact Slide 11 displays logos of funded companies like Nectar, Vinebox, and Public Goods. Slide 12 summarizes why founders 'love' them: speed (24 hours), transparency, scale ($10k to $10M), network, and discounts. Slide 13 adds a social mission layer, stating they fund 8X more women than the VC average, positioning their AI-driven, data-only underwriting as a tool for democratization.
Risk Management and Team
Slide 14: Underwriting Excellence For a financial services company, the loss rate is the most critical metric. Slide 14 shows a line graph of a 'Lower Loss Rate' from Q1 2018 to Q1 2019. The logic provided is 'More Data = Better Underwriting = Lower Loss Rate,' which addresses the investor's fear of capital depletion as the company scales.
Slides 15-16: The Pedigree The 'Venture Partners' slide (Slide 15) is a 'who's who' of the tech world, featuring Gary Vaynerchuk and Ryan Hoover. The 'Co-Founders' slide (Slide 16) provides extensive bios for Michele Romanow and Andrew D’Souza. Romanow’s bio is particularly dense, highlighting her role on Dragons' Den and her history of successful exits like SnapSaves (acquired by Groupon). D’Souza’s bio emphasizes his experience raising $50M+ and scaling teams at Top Hat.
Appendix and Case Studies
Slides 17-19: Real-World Proof The deck concludes with an appendix featuring two detailed case studies. Slide 18 focuses on Vinebox, a Y-Combinator backed company that used $150k from Clearbanc to achieve 595% revenue growth and an 1,101% ROI. Slide 19 features Coastal Co., showing how a 6% fee generated $4M in Lifetime Value (LTV), resulting in an 'effective cost margin of 0.45%.' These slides move the conversation from theoretical benefits to concrete unit economics for the end-user.
What Works in This Deck
Clearbanc excels at framing the enemy . By positioning traditional Venture Capital as 'expensive' and 'predatory' for certain types of spend, they make their own product seem like the only logical choice for a rational founder. The use of the Chamath quote on Slide 5 is a perfect example of using an industry insider's words to validate a disruptive thesis.
The traction visualization on Slide 7 is also highly effective. By showing the $1B projection for 2019 alongside the actuals from 2017 and 2018, they create a sense of inevitable momentum. Furthermore, the loss rate chart on Slide 14 is the most important slide for a Series B fintech investor, as it proves that growth is not coming at the expense of credit quality.
What is Missing
Despite the massive funding amount, the deck is surprisingly light on Clearbanc's own unit economics . While they show the ROI for their customers (Slide 18), they do not explicitly state their own Customer Acquisition Cost (CAC), the LTV of a lending relationship, or their net interest margin after accounting for the cost of their own capital.
There is also no competitive landscape slide. While they compare themselves to 'Venture Capital' and 'Bank Loans' generally, they omit other emerging revenue-based financing competitors who were entering the market at the same time. Finally, the use of proceeds for the $300M raise is not detailed; investors are left to assume it will be used as lending capital, but the split between balance sheet capital and operational scaling is not defined.
What a Founder Should Copy
Founders should emulate the 'Comparison Table' on Slide 8. It is a classic way to highlight a product's advantages, but Clearbanc takes it a step further by including 'Risks' as a row, which allows them to claim their product has 'None' compared to the catastrophic risks of their competitors.
The 'Democratizing Access' slide (Slide 13) is another brilliant inclusion. By tying their business model to a positive social outcome (funding more women), they build a brand narrative that goes beyond just 'money lending.' Any founder building a platform that uses data to remove human bias should include a similar slide to highlight the ethical advantages of their technology.
Company: Clearbanc (now Clearco) · Sector: E-Commerce / Fintech · Stage: Later (Series B) · Year: 2019 (based on Slide 7 projections) · Slides: 19 · Deck Type: Fundraising Pitch Deck · Outcome: Raised $300M · HQ: Toronto, Canada
Frequently asked questions
- What is Clearbanc's core value proposition to founders?
- Clearbanc offers 'non-dilutive' capital, meaning founders don't have to give up equity or board control. According to Slide 6, their revenue share agreements require no personal guarantees, no credit checks, and no covenants. They position themselves as 'The Most Affordable Capital,' providing funds in as little as 24 hours for predictable growth expenses like digital advertising.
- How does Clearbanc justify its market size?
- On Slide 10, Clearbanc identifies a $2.3 trillion global Total Addressable Market for E-commerce, with $504 billion in the USA. They specifically target the 1.2 million global businesses doing over $100k in annual revenue with a 2:1 Return on Ad Spend (ROAS), noting that these brands spend up to 60% of revenue on customer acquisition.
- What metrics did Clearbanc use to show traction?
- The deck focuses on deployment volume and growth rates. Slide 7 shows they funded $17M in 2017, $143M in 2018, and were on track for $1B in 2019. They also highlight a 21% Compound Monthly Growth Rate (CMGR) and a 940% CAGR. Crucially, Slide 14 shows a steadily declining loss rate, proving their AI-driven underwriting was improving with scale.
- Who are the key people behind Clearbanc?
- The team is led by high-profile co-founders Michele Romanow and Andrew D’Souza. Romanow is a serial entrepreneur and a judge on Dragons' Den, while D’Souza has a track record of raising over $50M for previous startups and serving as COO of Top Hat. They are supported by 'Venture Partners' including Gary Vaynerchuk and Product Hunt founder Ryan Hoover (Slides 15-16).
- How does Clearbanc compare itself to traditional VC?
- Slide 9 uses a 'Cost of Equity vs Clearbanc' chart to show that while Clearbanc's cost remains flat, the cost of equity increases proportionally with a company's valuation. They cite Uber as an example, where a $250,000 early investment became worth over $1.1 billion, illustrating the extreme 'effective APR' of equity compared to their flat fee.