Clark’s pitch deck is a concise 12-slide presentation that leans heavily on market positioning and the 'inevitability' of digital disruption. Rather than bogging the reader down in complex actuarial data, the deck uses powerful analogies to established tech giants (Slide 2) and a clear 'Blue Ocean' strategy (Slide 5) to justify its role as a digital broker. The deck is particularly strong in demonstrating brand dominance, showing a 15% aided brand awareness that leads the pure-play digital market (Slide 4). While it lacks granular unit economics and a specific funding ask, it provides a high-…
Key takeaways
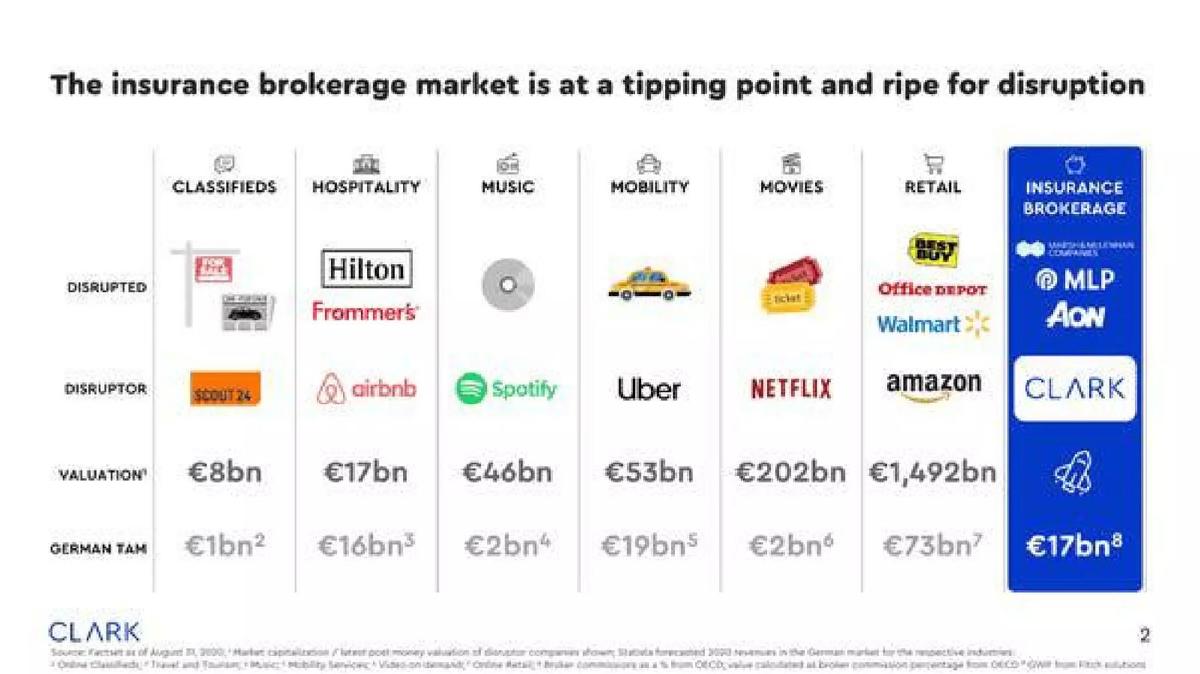
- The deck uses a 'disruption analogy' table to compare insurance brokerage to industries like retail and movies, citing a €17bn German TAM (Slide 2).
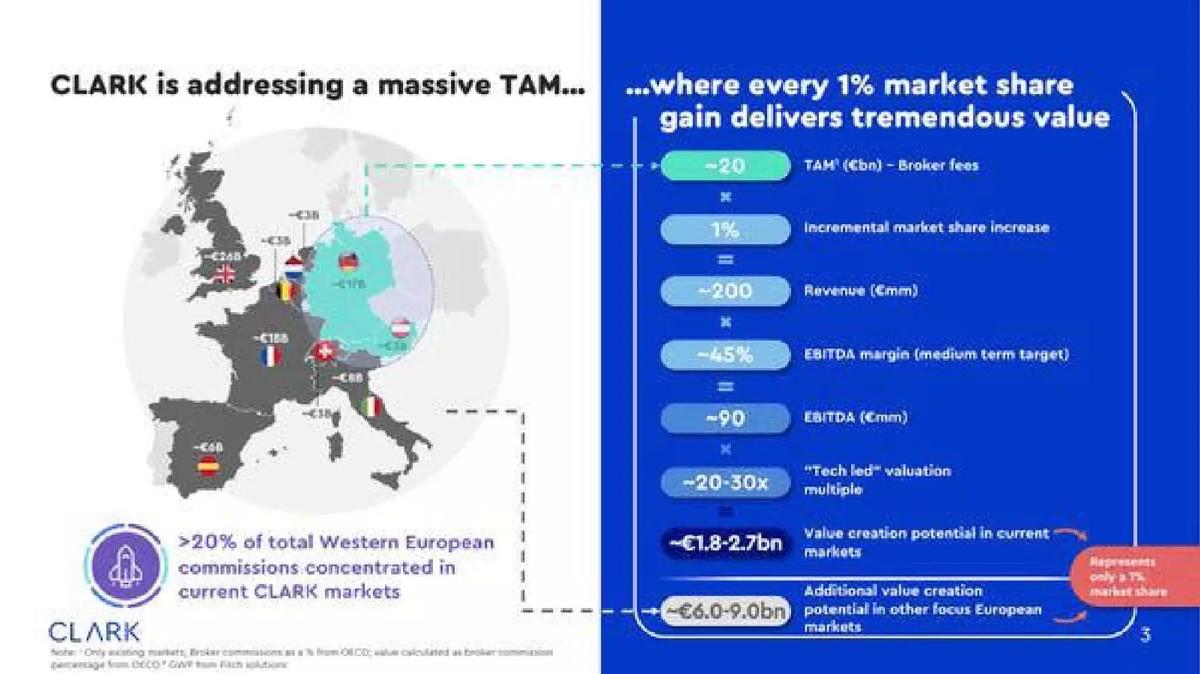
- Clark quantifies the value of market share, stating that a 1% gain equals ~€200m in revenue and ~€90m in EBITDA (Slide 3).
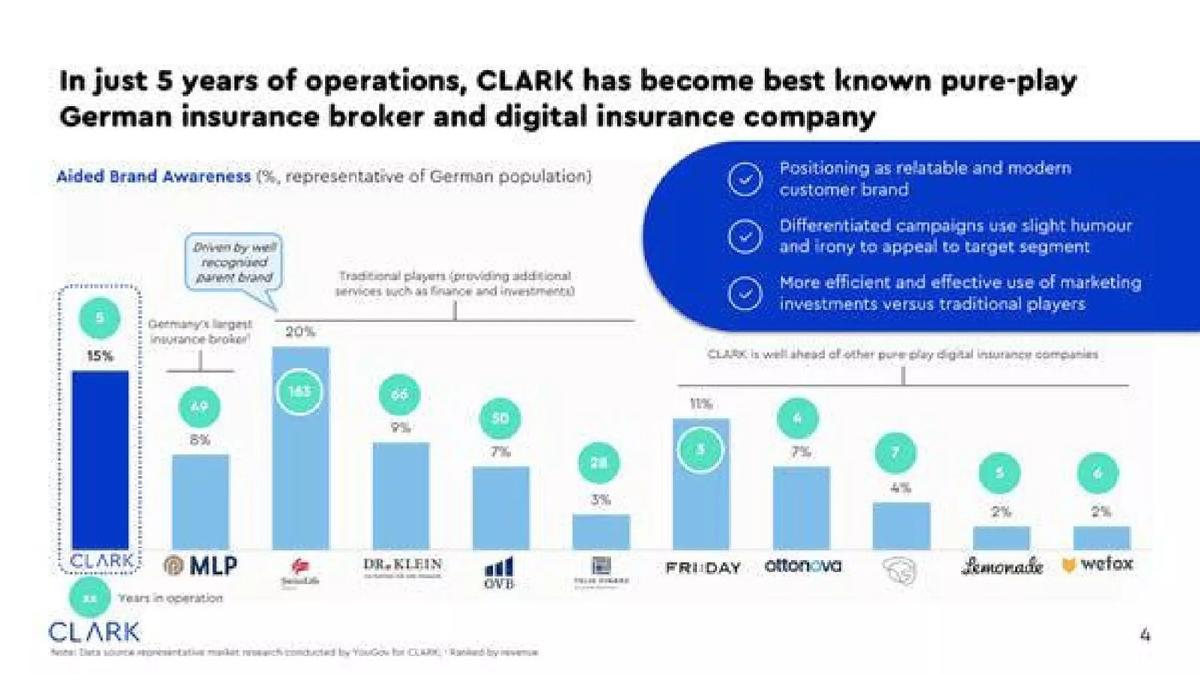
- The company claims the highest aided brand awareness (15%) among pure-play digital insurance brokers in Germany (Slide 4).
- A 'Blue Ocean' quadrant map positions Clark as the only player that is both customer-focused and fully online (Slide 5).
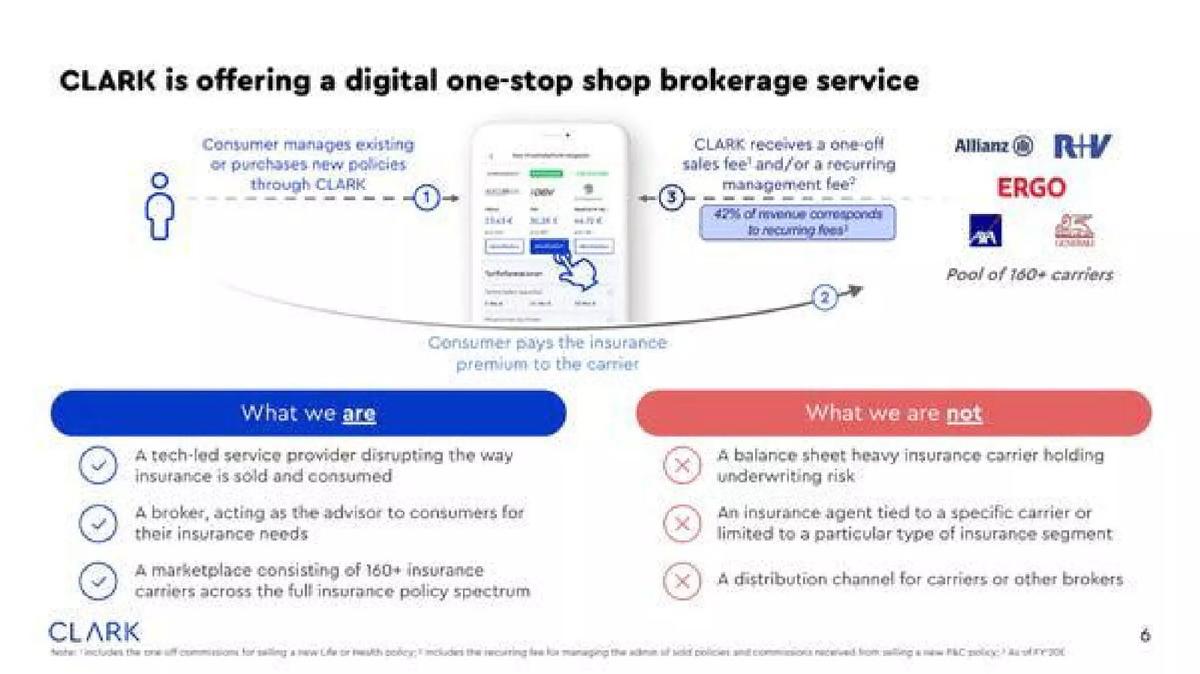
- The business model is clarified as a 'one-stop shop' where 42% of revenue comes from recurring management fees (Slide 6).
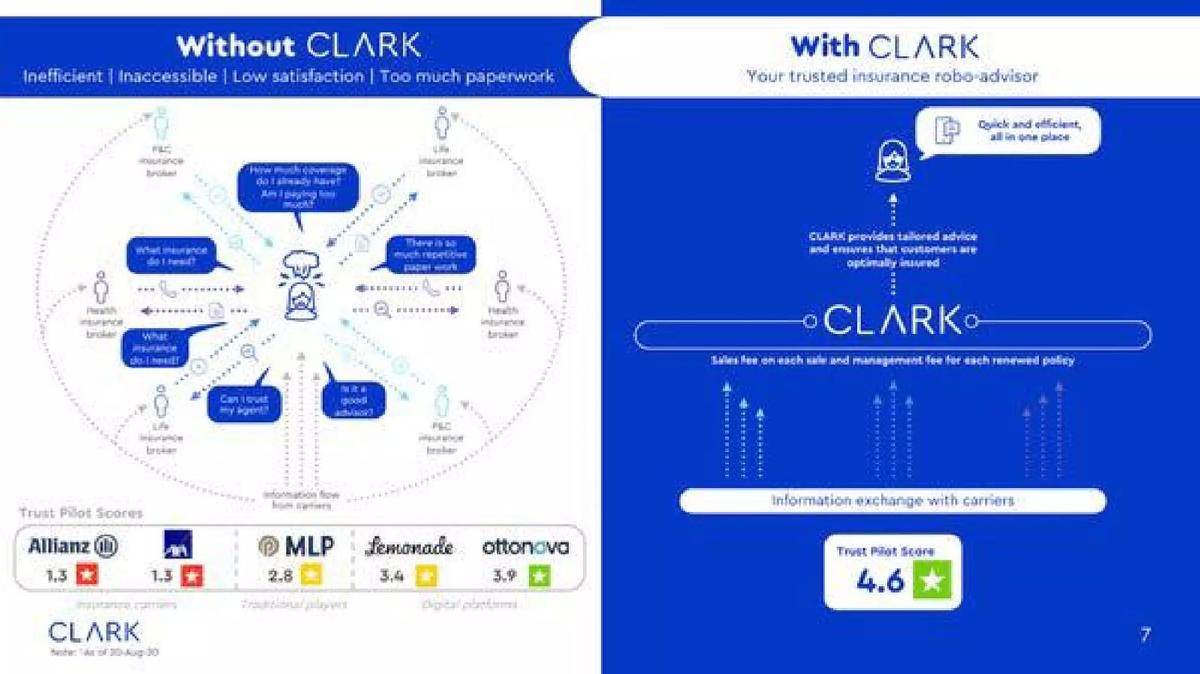
- The deck highlights a TrustPilot score of 4.6, significantly higher than incumbents like Allianz at 1.3 (Slide 7).
- The management team features founders with backgrounds at BCG, Wimdu, and Commerzbank, reporting a low 1.2% employee churn (Slide 10).
- The deck omits a specific 'Ask' slide and detailed financial projections beyond high-level margin targets.
Executive Summary: The Disruption Narrative
The Clark pitch deck is a masterclass in narrative-driven fundraising. At 12 slides, it is concise, visually consistent, and focused on a single thesis: the insurance brokerage market is the next domino to fall in the digital revolution. By leveraging the 'Amazon of X' or 'Netflix of Y' framework, Clark positions itself not just as a tool, but as an inevitability. The deck successfully balances high-level market opportunity with specific proof points regarding brand dominance in the German market.
Slide 1: Title and Vision
The cover slide is minimalist, featuring the Clark logo and the tagline "Digital is our policy." Three smartphone mockups display the user interface, immediately signaling that this is a mobile-first, consumer-facing product. The use of a deep blue brand color establishes a sense of trust and stability, which is critical in the insurance sector.
Slide 2: The Disruption Tipping Point
Slide 2 is perhaps the most aggressive in the deck. It presents a table comparing various industries (Classifieds, Hospitality, Music, Mobility, Movies, Retail) and their respective 'Disruptors' (Scout24, Airbnb, Spotify, Uber, Netflix, Amazon). Clark places itself in the final column as the disruptor for Insurance Brokerage . The slide notes a German TAM of €17bn for insurance brokerage, citing a source from Fitch solutions. By aligning itself with companies valued between €8bn and €1,492bn, Clark sets a high psychological anchor for its own potential valuation.
Slide 3: Quantifying the 1%
This slide breaks down the unit value of market share. It uses a mathematical waterfall to show that a 1% incremental market share increase in a €20bn TAM (Broker fees) leads to ~€200m in revenue . With a medium-term EBITDA margin target of ~45% , this results in ~€90m EBITDA . Applying a "Tech led" valuation multiple of 20-30x , Clark calculates a value creation potential of €1.8-2.7bn in current markets. The slide also includes a map of Europe, highlighting that >20% of total Western European commissions are concentrated in Clark's current markets (Germany and Austria).
Slide 4: Brand Awareness Dominance
Clark uses Slide 4 to prove it is winning the battle for the consumer's mind. A bar chart shows Aided Brand Awareness among the German population. Clark leads the "pure-play digital" category at 15% , significantly ahead of competitors like Friday (11%), ottonova (7%), Lemonade (2%), and wefox (2%). While traditional players like MLP (8%) and Dr. Klein (9%) are shown, Clark emphasizes that its marketing is more efficient and effective than these legacy brands.
Slide 5: The Blue Ocean Strategy
Slide 5 utilizes a quadrant map to differentiate Clark from the rest of the market. The axes are Offline vs. Online and Product-Focused vs. Customer-Focused . Clark occupies the "Blue Ocean" quadrant (Online + Customer-Focused). They contrast this with:
Traditional Players: Stale experience, offline, and struggling with digitalization. · Mass-Sale Brokers: Product-focused and often price-led "wrong ocean" players like Check24. · Digital Platforms: One-size-fits-all approaches primarily focused on lower-margin P&C contracts.
Slide 6: Business Model Clarity
This slide defines exactly what Clark is and, importantly, what it is not. It describes the company as a "digital one-stop shop brokerage service." Key facts include:
Clark receives a one-off sales fee and/or a recurring management fee. · 42% of revenue corresponds to recurring fees. · They have a pool of 160+ carriers including Allianz, AXA, and ERGO. · What they are not: A balance sheet heavy carrier holding underwriting risk.
Slide 7: The Trust Gap
Slide 7 focuses on the customer experience. The left side ("Without Clark") depicts a confused consumer surrounded by fragmented brokers and paperwork. The right side ("With Clark") shows a streamlined "robo-advisor" model. The most compelling data point here is the TrustPilot Score . Clark boasts a 4.6 , compared to 1.3 for Allianz and 3.4 for Lemonade . This slide argues that Clark isn't just more digital; it is fundamentally more trusted by the user.
Slide 8: Product Walkthrough
This slide provides a four-step visual guide to the app's functionality:
1. Simplified Overview: Instant insurance scoring. · 2. Needs Assessment: Profile-based recommendations. · 3. 1-Click-Buying: Curated pre-selection of top 3 offers. · 4. Expert Access: In-app chat with insurance experts.
This demonstrates that the "robo-advisor" is backed by real-world utility and ease of use.
Slide 9: The Hybrid Advice Model
Clark elaborates on its "unique combination" of Robo-advice and Independent expert advice . The robo-advice provides transparent price-to-quality comparisons, while the human experts drive sales of higher margin life and health products and support customers in managing claims. This hybrid model is presented as the key to satisfying all insurance needs while maintaining high margins.
Slide 10: The Team and Culture
The management team slide features four key leaders: Dr. Christopher Oster (CEO), Steffen Glomb (CTO), Dr. Marco Adelt (COO), and Chris Lodde (CMO) . Their backgrounds include heavyweights like BCG, Wimdu, Vodafone, and Commerzbank . A notable and unusual metric included here is "1.2% churn" among employees, described as "exceptionally strong turnover" (meaning low turnover). The slide also lists supporting investors like Portage, White Star Capital, FinLeap, and Yabeo .
Slide 11: Market Recognition
The penultimate slide is a "logo wall" of awards and press mentions. It includes the Google/McKinsey Digital Top 50 , Bloomberg's 50 Most Promising Startups , and the KPMG Top 100 Fintech list. This serves as final validation of the company's trajectory and industry standing.
Slide 12: Closing
The final slide is a simple brand graphic with the Clark logo. It lacks contact information or a call to action, which is common in decks intended for live presentations rather than cold sends.
What Works in This Deck
The Disruption Analogy: By comparing insurance to retail and music, Clark makes a complex, regulated industry feel understandable and ripe for investment. It moves the conversation from "how does insurance work?" to "who will be the Amazon of insurance?"
Recurring Revenue Focus: Highlighting that 42% of revenue is recurring is a major win for a brokerage model. It suggests a high Lifetime Value (LTV) and a more stable, predictable business than a traditional commission-only shop.
Trust Metrics: In an industry plagued by low consumer trust, the 4.6 TrustPilot score is a powerful differentiator. Contrasting it directly against a giant like Allianz (1.3) makes the incumbent look vulnerable.
What is Missing
The Ask: There is no mention of how much money the company is looking for, the valuation they are seeking, or the specific milestones they intend to hit with the new capital.
Unit Economics: While the deck mentions high-level margins, it omits the "Golden Ratio" of startup health: Customer Acquisition Cost (CAC) vs. LTV. For a digital broker, marketing spend is the primary engine of growth, and investors would want to see the efficiency of that spend.
Historical Growth Data: The deck mentions being in operation for 5 years, but it doesn't show a year-over-year growth chart for revenue, users, or policies managed. It relies on brand awareness as a proxy for growth, which is less rigorous than hard financial data.
What a Founder Should Copy
The "1% Market Share" Slide: Founders should copy the way Clark breaks down the value of a single percentage point of market share. It makes a massive TAM feel attainable and shows that the company doesn't need to own the entire market to be a multi-billion dollar success.
The "What We Are Not" Section: Clearly defining your boundaries (e.g., "not a balance sheet heavy carrier") helps investors understand your risk profile immediately. It prevents them from comparing you to the wrong types of companies.
Visual Consistency: The deck uses a very limited color palette and clean, professional icons. This gives the impression of a polished, mature company that is ready for Series-level investment.
Conclusion Clark’s deck is a high-level strategic document designed to sell a vision of market leadership. It succeeds by framing the company as the dominant digital brand in a massive, outdated industry. While it leaves many financial questions unanswered, it provides a compelling narrative hook that would likely secure a follow-up meeting with any fintech-focused VC.
Frequently asked questions
- What is Clark's primary business model according to the deck?
- Clark operates as a digital insurance broker, not a carrier. According to Slide 6, they act as a tech-led service provider and marketplace for over 160 carriers. They generate revenue through a combination of one-off sales fees and recurring management fees, with the latter accounting for 42% of their revenue. This allows them to avoid the 'balance sheet heavy' risks of traditional underwriting.
- How does Clark justify its market valuation potential?
- On Slide 3, Clark uses a 'Tech led' valuation multiple of 20-30x EBITDA. They argue that in their current markets, a 1% market share increase could create €1.8-2.7bn in value. They further project an additional €6.0-9.0bn in value creation potential by expanding into other focus European markets, emphasizing the scalability of their digital-first brokerage model.
- Who are Clark's main competitors mentioned in the deck?
- The deck categorizes competitors into three groups on Slide 5: Traditional Players (e.g., Allianz, AXA, MLP), Mass-Sale Brokers (e.g., Check24, Walmart), and Digital Platforms (e.g., Lemonade, wefox, ottonova). Clark positions itself in the 'Blue Ocean' quadrant, claiming to be more customer-focused than digital platforms and more online-centric than traditional incumbents.
- What evidence of product-market fit does the deck provide?
- Clark points to two main metrics: brand awareness and customer satisfaction. Slide 4 shows they have 15% aided brand awareness in Germany, leading all other digital-only competitors. Slide 7 highlights a TrustPilot score of 4.6, which they contrast against the much lower scores of traditional carriers (1.3) and other digital platforms like Lemonade (3.4).
- What information is missing from this pitch deck?
- The deck is notably missing a specific 'Ask' slide detailing how much capital is being raised and how it will be used. It also lacks a detailed slide on unit economics (CAC/LTV) and specific historical financial growth charts. While it mentions a 'medium term target' for EBITDA margins (45% on Slide 3), it does not provide a year-by-year path to profitability.