The 2011 Bukalapak pitch deck is a lean, 10-slide presentation delivered at Jakarta Ventures Night. It highlights the company's early position as a C2C marketplace, specifically dominating the bicycle niche. The deck relies heavily on traction metrics, showing a 58x increase in pageviews over a single year (Slide 5) and a highly engaged user base that outpaced competitors in pageviews per user (Slide 6). Notably, the company operated with just three employees at the time, achieving profitability with very low overhead (Slide 7 and 10). While the deck lacks a formal 'ask' or long-term roadmap,…
Key takeaways
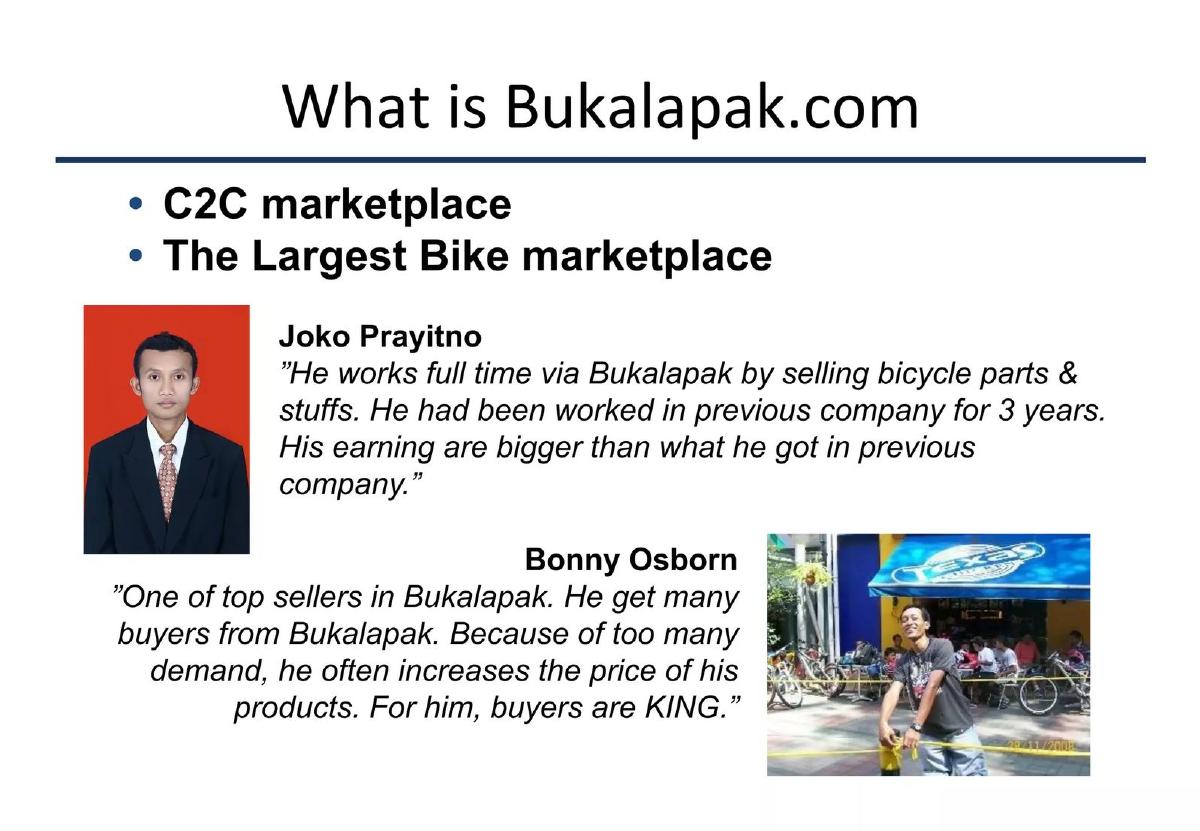
- Bukalapak identified itself as the 'Largest Bike marketplace' in Indonesia to establish early dominance (Slide 3).
- The core team consisted of four members with backgrounds in tech development, BCG consulting, and community management (Slide 2).
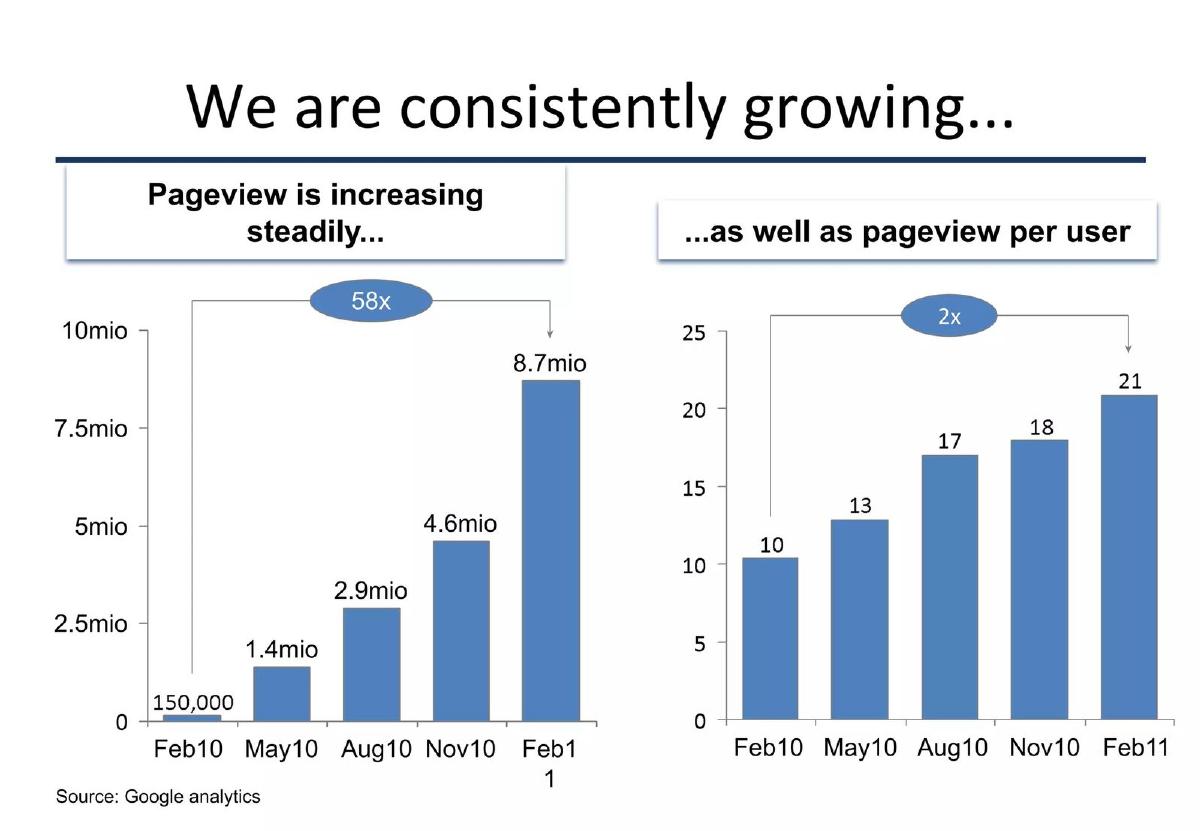
- Pageviews grew 58x from 150,000 in February 2010 to 8.7 million in February 2011 (Slide 5).
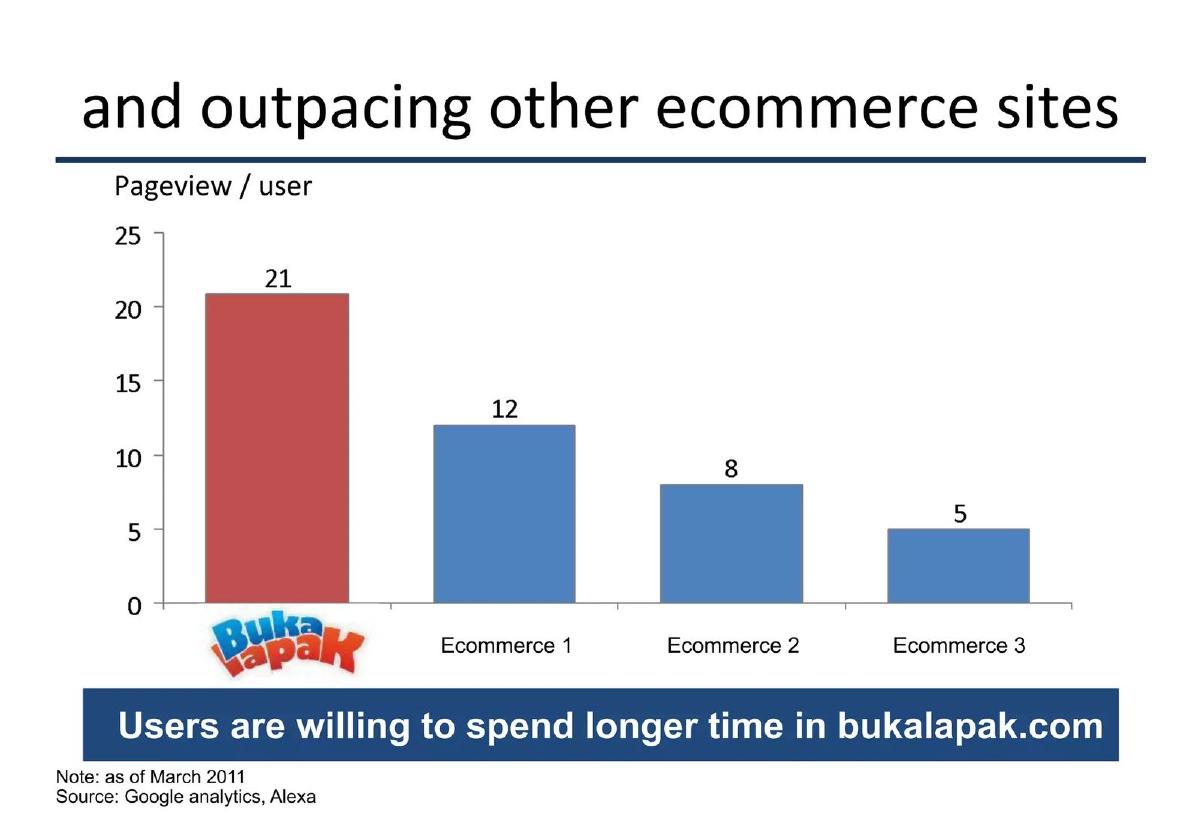
- User engagement was a key differentiator, with 21 pageviews per user compared to 5-12 for unnamed competitors (Slide 6).
- The company maintained a lean operation with only 3 employees, significantly fewer than its immediate competitors (Slide 7).
- Daily transaction value reached IDR 100-200 million, driven by an average selling price of IDR 2,000,000 (Slide 8).
- Potential revenue was calculated based on 400K daily pageviews and a $1.5 CPM, totaling $600 per day (Slide 9).
- The deck claims profitability as of early 2011, with monthly revenue (IDR 6.5 Mn) exceeding monthly costs (IDR 5.7 Mn) by May 2011 (Slide 10).
Introduction
The 2011 Bukalapak pitch deck is a historical artifact from the early days of the Indonesian startup ecosystem. Presented at Jakarta Ventures Night on March 18, 2011, this 10-slide deck represents a company that would eventually become one of Indonesia's largest e-commerce platforms and its first to list on the Indonesia Stock Exchange. At the time of this presentation, Bukalapak was a lean operation focused on a specific niche: the bicycle community. The deck is a masterclass in using traction and efficiency to overcome a lack of scale.
Slide 1: Title Slide
The title slide is minimalist, featuring the original Bukalapak logo and the presentation context: "Presented in: Jakarta Ventures Night, 18 March 2011." There is no tagline or mission statement, which places the burden of explanation on the subsequent slides.
Slide 2: Meet our core team
The team slide introduces four key members: Achmad Zaky (CEO), Fajrin Rasyid (CSO), Nugroho 'xinuc' (CTO), and Arief Nugroho (Community Manager). The credentials are impressive for an early-stage startup. Zaky is credited with 4 years of tech development experience. Rasyid is highlighted as a former BCG consultant and a Summa Cum Laude graduate from ITB with a 4.0 GPA. Nugroho is positioned as a Ruby expert, and Arief Nugroho is noted as a "top poster at an Indonesian cyclist online community forum." This last detail is critical, as it links the team's personal passions directly to the company's initial market wedge.
Slide 3: What is Bukalapak.com
This slide defines the business as a "C2C marketplace" and, more specifically, "The Largest Bike marketplace." It uses two testimonials to prove the platform's value proposition. Joko Prayitno claims his earnings on Bukalapak are higher than his previous full-time job, while Bonny Osborn notes that demand is so high he frequently increases his prices. These anecdotes serve as early proof of liquidity—the most important metric for any marketplace.
Slide 4: Introduce our interface
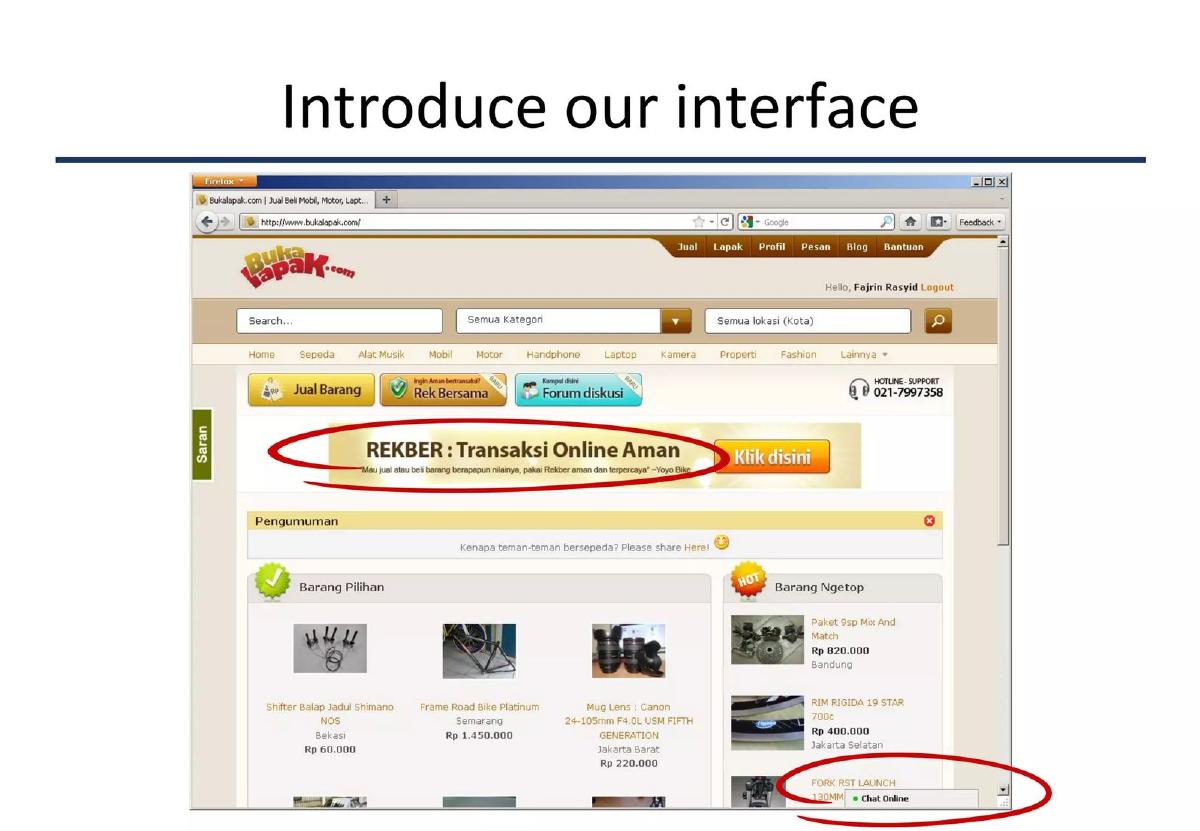
The interface slide shows a screenshot of the website as it appeared in 2011. The design is functional, featuring categories like Sepeda (Bikes), Alat Musik (Musical Instruments), and Handphone. Two areas are circled in red: "REKBER: Transaksi Online Aman" (Joint Account: Safe Online Transactions) and a "Chat Online" feature. This highlights that Bukalapak was solving the two biggest hurdles in early Indonesian e-commerce: trust and real-time communication between buyers and sellers.
Slide 5: We are consistently growing...
This is the primary traction slide. It uses two bar charts sourced from Google Analytics. The first shows pageviews growing from 150,000 in February 2010 to 8.7 million in February 2011—a 58x increase. The second chart shows "pageview per user" doubling from 10 to 21 in the same period. This demonstrates not just growth in traffic, but a significant increase in user engagement and site stickiness.
Slide 6: ...and outpacing other ecommerce sites
Bukalapak uses a comparative bar chart to show that their 21 pageviews per user significantly beats three anonymous competitors, who range from 5 to 12 pageviews per user. The note at the bottom attributes this data to Google Analytics and Alexa. This slide is intended to show that Bukalapak's community-driven model creates a more loyal and active user base than generic e-commerce platforms.
Slide 7: ...with lower cost
In a rare move for a pitch deck, Bukalapak brags about its small team size. The chart shows Bukalapak operating with only 3 employees, while "Ecommerce 1" and "Ecommerce 2" have 12 and 10 employees, respectively. This slide argues for the company's operational efficiency and the scalability of its technology stack, implying that they are doing more with less.
Slide 8: ...and large base of transaction...
This slide moves from traffic to financial activity. It lists 50-100 daily transactions with an average selling price (ASP) of IDR 2,000,000. This results in a "Daily transaction value" of IDR 100-200 million. The high ASP is a direct result of their focus on the bicycle niche, where high-end components and frames command significant prices compared to general consumer goods.
Slide 9: ...providing opportunity to monetize
Bukalapak presents a simple monetization formula: 400,000 daily pageviews multiplied by a $1.50 CPM equals a "Daily Potential Revenue" of $600. By framing revenue as "potential" based on existing traffic, they de-risk the investment, showing that they don't need to find a new business model—they just need to turn on the taps of their existing traffic.
Slide 10: ...currently, we are profitable
The final slide provides a breakdown of monthly revenue and costs from February to May 2011. Revenue is split between "Advertisement" and "Payment," growing from IDR 3.2 Mn to IDR 6.5 Mn. Costs, split between "Salary," "Hardware," and "Maintenance," grew from IDR 4.0 Mn to IDR 5.7 Mn. By May 2011, the company shows a small profit. While the absolute numbers are small (IDR 6.5 million was roughly $750 USD in 2011), the trend line and the achievement of profitability at such an early stage are powerful signals to investors.
What Bukalapak Did Well
Niche Dominance: By focusing on the "Bike marketplace," Bukalapak avoided a direct war with larger, generalist competitors. They built a community first, which provided the liquidity needed to expand later. The inclusion of a community manager who was a "top poster" in cycling forums (Slide 2) was a brilliant way to show they understood their core user.
Engagement Over Scale: In 2011, raw traffic numbers were often manipulated. By focusing on "pageviews per user" (Slide 6), Bukalapak proved that their users weren't just landing on the site and leaving—they were deeply engaged. This is a much harder metric to fake and a better indicator of long-term success.
Extreme Leaness: The comparison of employee counts (Slide 7) is a bold tactical move. It tells investors that the founders are disciplined with capital and that the technology is doing the heavy lifting. This is particularly attractive to early-stage investors who want to see their capital go toward growth rather than bloated payrolls.
What Was Omitted
The Ask: The most glaring omission is a funding ask. There is no mention of how much money they are looking for, what the valuation is, or what the specific use of funds will be. This suggests the deck may have been part of a broader competition or a "demo day" style event where the ask is handled in follow-up meetings.
Market Size: The deck never addresses the Total Addressable Market (TAM). While they prove they can dominate the bike niche, they don't explain how big that niche is or how they will transition from bikes to a multi-billion dollar general e-commerce platform. Investors usually want to see the "ceiling" of the business.
Competitive Landscape: While they compare themselves to "Ecommerce 1, 2, and 3," they don't name these competitors or explain their specific advantages over them. A more detailed competitive analysis would have helped clarify their moat beyond just "higher engagement."
Lessons for Founders
Start with a Wedge: If you are building a marketplace, don't try to be everything to everyone on day one. Find a high-value, high-engagement niche (like bikes) and own it. Use that momentum to expand into adjacent categories.
Traction is King: If you have a 58x growth rate (Slide 5), you don't need a 50-page deck. Bukalapak's deck is only 10 slides because the numbers do the talking. Focus your deck on the 2-3 metrics that prove your business is working.
Show, Don't Just Tell, Profitability: Even if the numbers are small, showing that you can balance a budget (Slide 10) builds immense trust with investors. It proves you aren't just a "burn and churn" startup, but a real business with a grasp on unit economics.
Frequently asked questions
- What was Bukalapak's initial market entry strategy?
- Bukalapak used a 'wedge' strategy by focusing on a specific, high-engagement niche: bicycles. Slide 3 explicitly labels them as the 'Largest Bike marketplace.' By dominating a community-driven vertical where users were already active in forums, they built a liquid marketplace before expanding into broader C2C categories like electronics and fashion, which are visible in the interface screenshot on Slide 4.
- How did the team demonstrate technical and operational competence?
- The team slide (Slide 2) highlights a balanced mix of skills. CEO Achmad Zaky brought 4 years of tech venture experience, while CSO Fajrin Rasyid provided strategic weight as a former BCG consultant with a 4.0 GPA from ITB. The CTO, Nugroho, was noted as an expert in Ruby and high-performance programming, which likely contributed to the lean 3-person headcount shown on Slide 7.
- What metrics did Bukalapak use to prove user engagement?
- Instead of just focusing on raw user counts, Bukalapak emphasized 'Pageview per user' on Slide 6. They showed that their users viewed 21 pages per session, which was nearly double their closest competitor ('Ecommerce 1' at 12). This metric proved that their platform was 'sticky' and that the community-centric approach was working better than generic e-commerce sites.
- How did the company plan to monetize in its early stages?
- Slide 9 outlines a primary monetization path through advertising. By multiplying 400,000 daily pageviews by an average CPM (cost per mille) of $1.5, they projected a daily potential revenue of $600. Slide 10 confirms that by May 2011, their revenue mix already included both 'Advertisement' and 'Payment' fees, though advertising was the larger contributor.
- What is missing from this pitch deck compared to modern standards?
- This deck is remarkably brief at 10 slides. It lacks a formal 'Problem' slide, a 'Market Size' (TAM/SAM/SOM) analysis, a 'Competitor Matrix' (beyond anonymous bar charts), and a specific 'Funding Ask.' It functions more as a traction report to prove the business model's viability rather than a comprehensive strategic plan for regional expansion.